
ABSTRACT
The research examines the implication of Nigeria’s lopsided land transport structure for performance and efficiency in the freight transport sector using the Lagos–Kano corridor as a case study. A comparative analysis of road and rail performance in freight transport using defined performance indicators shows that road transport performed better on all but two indicators, namely, freight ton-kilometres moved per vehicle hour travelled and throughput per unit of energy consumed. Other performance indicators such as absolute throughput of freight, freight ton-kilometres performed, speed, freight throughput per unit cost of operation and revenue per ton of freight moved favoured roads over rail. Clearly, rail comparative advantage relates to capacity, but freight shippers are looking for speed that shortens vehicle turnaround time. The lesson is that freight shippers will not explore modal comparative advantages (such as capacity and lower freight rates) except such advantages are complemented with competitiveness conferred by technology (especially speed).
Introduction
Historically, in the pre-colonial years, and running through to one and half decades after independence (about 1975), railways played a significant role in the movement of passengers and goods and so contributed significantly to transport output and to Nigeria’s economy. The rail sector accounted for a third of overland freight movement in addition to passenger movement on medium and long hauls and formed a major mode of transport used in facilitating the opening up of several mineral producing and agricultural areas (Adesanya, Citation2010). Up until about 1980, land transport modal split presented a healthy mix of road and rail shares from historical times.
Thereafter, growing populations which gained momentum in the 1980s triggered a process of spatial development marked by built-up city areas served mostly by roads and not rail infrastructure. Existing rail lines could not match the fast pace of city development and its related demands as narrow gauge rail lines offered 45–50 km per hour. Travel distances were increasing exponentially, and connecting origin and destination points needed fast means of transport. Coupled with this, the unconventional structural transformation of the Nigerian economy characterized by diversification into low-end services, away from agriculture and neglect of manufacturing has further led to demand shifts to road rather than rail transport. It in fact appears that there is a two-way effect here. The slow pace of rail modernization in Nigeria did affect growth of the manufacturing sector as it resulted in poor linkages between agricultural/mineral producing regions, on one hand, and on the other, processing points and potential markets. Similarly, declines in manufacturing output have reduced the derived demand for high-capacity less flexible modes like rail transport. In the last couple of decades, therefore, over 90% of traffic associated with overland transport of people and goods in Nigeria has been by road (Adesanya et al, Citation2008; Adesanya et al., Citation2017). Given the minimal increase in the quantity of road stock in Nigeria in the last decade (Nigerian Institute of Social & Economic Research, (NISER), Citation2015), coupled with the fact of a large proportion of poor quality road stock, and the substantial increase in vehicle population over the years, Nigeria’s land transport system has become extremely vulnerable.
Research problem
The kernel of the research problem lies in the fact that much of Nigeria’s overland traffic has been diverted to roads, thus compromising performance and efficiency of land modes. Rail transport operations in Nigeria has been characterized by a chequered performance trajectory, with a definite downward spiral in railway performance between 1985 and 2009. During this period, rail freight volumes (in tons) as given in a Nigerian Railway Corporation (NRC; Nigeria Railway Corporation, Citation2018) report declined by as much as 95%. Following this dismal performance, there were a series of interventions to revive the rail sector, which include track rehabilitation, purchase of new locomotives and institutional reform initiatives in the NRC. These interventions yielded some fruit which led to resuscitation of rail services in December 2010.
From 2010 onwards, there have been gradual improvements in passenger and freight performance, with increasing volumes recorded for both traffic segments. However, progress does not appear good enough. Transport share of Nigeria’s Gross Domestic Product (GDP) averaged 1.2% between 2010 and 2015. Rail share of this transport sector output in Nigeria stagnated at 0.02% between 2010 and 2015, while road share of transport sector output was as much as 84% (Central Bank of Nigeria (CBN), Citation2014; http://statistics.cbn.gov.ng/cbn-onlinestat).
Although rail transport services have been resuscitated in Nigeria since December 2010, it appears that passengers and shippers are not keen on exploiting the comparative advantages inherent in this mode. While the current narrow gauge offers slow speeds and is unlikely to be attractive to passengers, the network has capabilities for freight transport and could be used for same in order to check the current chaos on our roads.
The overall objective of the paper is to examine rail transport potentials for absorbing overland freight traffic in Nigeria in order to achieve improved performance and greater efficiency in the nation’s land transport system. In more specific terms, the study seeks to
determine and compare performance measures for road and rail transport;
analyse current freight flow patterns through road and rail modes; and
articulate interventions needed to achieve land freight traffic redistribution via modal shifts to rail transport.
Materials and methods
This section provides some conceptual background to the study; the study utilizes Wandel’s three-layer model (TLM). A review of literature is undertaken, and the study methodology is expatiated thereafter.
Wandel’s three-layer model (TLM)
Wandel et al. (1992, as cited in Arvidsson, Citation2011) present a useful TLM which depicts the infrastructure, transport flow and material flow in a transport system (). In a freight transportation market, the interplay between the actors can be considered supply and demand actions in which the transport operators or forwarders supply and the transport buyers consume. The uppermost layer consists of production and distribution centres that exist in different nodes; this could be sea ports,Footnote1 inland ports or warehouses. In the next layer, load units – vehicles or containers – are moved between nodes. This is where consolidation and modal shifts take place. Movements could be by a combination of modes, such as by road (using trucks) or by rail (using freight trains). Some segment of the journey distance may be covered using trucks up to a location (e.g. a rail hub) where shipments are then transferred to rail wagons. Almost always, a rail shipment will need the help of a truck at some point; this is known as intermodal freight shipping.
Figure 1. Wandel’s three-layer model.
Cost efficiency dictates that the mode with the highest comparative advantage is used in the transport flow layer for different segments of the journey. However, infrastructure is the basic layer that dictates if such decisions can be made rationally. The last layer shows that infrastructure is the undergirding element that allows for other layers of the flow model to function.
Transport flow, a derived demand manifesting as flow of vehicles, constitutes a critical middle component in the TLM. Vehicles could be trucks or other articulated vehicles; these could also be rail freight wagons. Which one of the modes bear the brunt of vehicular traffic in distributing materials depends on the existing infrastructure (for our present study – road and rail) and their integration in the transport system. Wandel’s TLM disaggregates the transportation system into infrastructure, load units (vehicles) and material flows and provides a hierarchical relationship between the three layers. The model provides us with some understanding of how to engineer modal shifts for improved efficiency of traffic flows.
Equally relevant to this study is the transportation and activity flow (TAF) model. In the model, espoused by Matthew (Citation2011), the transportation system is defined by three basic variables – transportation networks, socio-economic activities and pattern of flows. Transportation networks affect patterns of socio-economic activity, while socio-economic activities also trigger changes in the transportation system. Socio-economic activities and their locations also determine the patterns of commute and flows in the transportation system.
Conceptual clarifications
Freight transport cost efficiency – the term efficiency relates to a ratio between resources and products, costs and benefits, inputs and output of a defined process. Efficiency can be defined as doing things in the most economical way or a good input to output ratio. Cost efficiency in transport relates to movements by modes offering the lowest unit cost per kilometre of movement. Distance and volume of freight are basic factors determining unit cost of freight transport. Irrespective of transport mode, rates taper off with increasing distance; that is, cost of transport increases at a decreasing rate. While rail has comparative advantage of transport of bulk freight over long distances, road transport is more economical over short distances.
Energy efficiency – this relates to lower carbon footprints per passenger kilometre travelled or per freight ton kilometre moved. Working with simple law of averages, rail transport (given its potential for higher capacity) offers lower carbon footprints per freight ton kilometre than road transport assuming the train has a reasonable level of capacity utilized. Globally, freight transportation demand is projected to grow to 27.5 billion tons in 2040, and by extrapolation, to nearly 30.2 billion tons in 2050, requiring even greater amounts of energy (Grenzeback et al., Citation2013). Nigeria will have its fair share of this projected growth and as such must explore energy-efficient means for freight movements.
Operational definitions
Freight – typically refers to goods transported in bulk by truck, train, ship or aircraft.
Freight throughput performance – operationally, freight throughput is calculated as volume of freight multiplied by distance covered in transport; this gives freight-ton kilometres. In order to determine performance, the following indicators were calculated for road and rail:
freight throughput per operational cost,
freight throughput per energy use,
revenue per freight throughput and
freight-ton kilometre per hour travelled.Footnote2
These indicators relate to a cross section and pertain to 2017 since road freight dataFootnote3 were available only for that year. The indicators were operationalized as follows:
Freight throughput per operational cost = total throughput of freight ÷ operating cost of vehicle use and maintenance.
Freight throughput per energy use = total throughput of freight ÷ total litres of vehicle fuel used
Revenue per freight throughput = total revenue from freight ÷ total volume of freight
Freight-ton kilometre per hour travelled = Maximum freight-ton kilometre achievable per trip ÷ journey time in hours
Review of literature
Comparative advantages of land-based transport modes
Transport modes are known for their comparative advantages in the movement of passengers and freight. Consequently, transport networks and policies are often designed to ensure that users explore modes with the highest comparative advantage for the service which they demand. Roads are the most ubiquitous modes of transport. Water transport is limited by natural geographies, while air transport is often relatively expensive. Rail transport is the closest competitive mode to roads, given that both are land based. With foresight and proper design, however, road and rail and indeed other transport modes can be complementary and integrated in an efficient transport system. Principally rail transport comparative advantage over road includes potential for high throughput owing to high carrying capacity and predictable journey times due to track monopoly. In the case of roads, the major comparative advantage is flexibility and quick delivery in the case of freight. When transport modes are used purposefully to explore their inherent comparative advantages, the principles of efficiency and optimal performance are likely to be upheld. However, when reverse is the case, these principles are compromised.
Freight transport studies in Nigeria
Recent studies on freight shipments in Nigeria include those by Odeleye (Citation2015) and Ubogu (Citation2011). In his study, Odeleye (Citation2015) notes that a challenge exists with respect to integrated transport infrastructure in Nigeria, hence there are constraints to realizing seamless freight and passenger transport services. The author recommends public–private partnerships (PPPs) to achieve a sustainable integrated transport infrastructure system. Ubogu (Citation2011), in his research, evaluated the potentials of integrating rail-road system for port-hinterland freight in Nigeria and found that integrating rail-road for hinterland bound goods offered cost-effective dividends. Results from the study showed potential savings of 44.2% and 93.7% freight costs on the western and eastern flank, respectively, from the seaports of Lagos and Port Harcourt.
Other studies on freight transport in Nigeria are quite dated. They include Alokan (Citation1995), Ogwude (Citation1990) and Ogunsanya (Citation1981). Alokan concluded that the road freight industry was ill‐suited to the kind of traffic generated at the time as roads did not have the capacity to match the demand in the transport of domestic freight. This demand has since increased tremendously, while road stock has only increased marginally. This further underscores the need for complementary transport modes such as rail.
Ogwude (Citation1990), in an attempt to quantify factors influencing choice of freight transport modes in Nigeria, estimated relative contributions of factors determining modal choice using a logit model. Freight rate was a significant factor, although significance varied between groups of industrial freight and transport modes. He opined that service competition (more than freight rates) would lead to greater modal shifts for consumer goods in future. He also concluded that rail could attract a reasonable amount of traffic by offering relatively lower charges. Given that lower unit cost of transport is an inherent comparative advantage in rail, it follows that rail freight transport is a viable option in Nigeria. With respect to freight transport costs incurred in the use of road and rail, Abioye (Citation2016), in his study conducted in Nigeria, observes that rail transport is cheaper at every distance range. Abioye also noted that rail transport offers better energy efficiency and space economy in addition to cost-effectiveness when compared with road.
Freight transport studies in other countries
Reviews on the freight transport situation in other climes show that road transport disproportionate shares of overland traffic is not peculiar to Nigeria. The European Commission for Mobility and Transport (Citation2017) notes that there has been no measurable modal shift in the region since 2012 when steady growth in economic activity resumed following the 2008/09 financial crisis. At 72% , the modal share of road in the activities of all inland transport modes was the same in 2015 as it was 10 years earlier. Road haulage over long distances (greater than 300 km), however, grew more slowly than over short and medium distances (up to 300 km; where there is not much competition from other transport modes). One of the goals in the 2011 White Paper- ‘Roadmap to a Single European Transport Area – Towards a competitive and resource efficient transport system’ is to shift 30% of road freight over 300 km to other modes such as rail or waterborne transport by 2030.
The story is similar in the United States where trucks exclusively move more than two-thirds of the volume of all U.S. goods. However, several other transportation modes carry high-value products and bulk commodities critical to regional economies. Trucks have consistently carried the most goods nationally, up to 75% of the value and weight of commodities, ranging from electronics to agricultural products. In contrast, air modes tend to move innovative, high-value commodities like precision instruments, while rail-roads and pipelines specialize in raw commodities like energy fuels (Joseph & Adie, Citation2015).
With respect to energy efficiency, Rafaa and Riad (Citation2014) analysed relationships between annual carbons iodide emissions from road freight transport and some influencing factor in Tunisia, namely, energy emission, fuel use and road freight transport intensities. He concludes that decoupling road freight activity from economic growth by shifting to rail mode would be one main solution to reduce transport intensity. Incentives to use clean fuel and clean vehicles are considered helpful tools to enhance energy efficiency.
Developing Asian countries also rely primarily on road freight. Governance-related issues (lack of enforcement), market fragmentation and poor freight data are identified as key challenges towards transformation of freight transport in the region (Bjarne, Citation2016). In addition to technology solutions, long-term transformative interventions such as land use planning and alternative modes for freight are being considered for implementation in the region.
In South Africa, efficient freight transport is an important driver of national competitiveness and is especially pertinent because transport costs contribute as much as 61% of logistics costs (Havenga & Simpson, Citation2012), compared to the global average of 39% (Rodrigue et al., Citation2009). South Africa’s industrial concentration in the middle of the country, which developed around mining deposits, is served by long, dense freight corridors to and from ports and agricultural communities. Road freighters have an almost 90% corridor tonne-kilometres (tonne-km) market share (Havenga & Simpson, Citation2012). Meanwhile, dense long-distance corridors, such as those which are obtained in South Africa, are ideal routes for intermodal rail (Rodrigue, Slack & Blank Citation2006). The failure of South Africa’s freight railway to capture this market is attributable to a lack of policy direction regarding the role of the two modes (road and rail) in the surface freight transport industry (Development Bank of Southern Africa, (DBSA), Citation2012), caused by the absence of sufficient market intelligence to inform policy (Havenga, Citation2007).
Experiences in land freight transport from other countries suggest that modal shifts of land freight from roads do not happen by default, but have to be deliberately engineered through incentives and disincentives for rail and road, respectively. The following sections provide a more detailed review of rail freight in the European Union (EU) and USA.
The EU and USA
In spite of the general story of insignificant modal shifts to rail in the EU region, member countries do manifest some differences. Islam et al. (Citation2016) identified the extent of rail liberalization as a factor influencing relatively high rail market shares in some EU countries as well as in Norway and Switzerland. Countries at the top of the Rail Liberalization Index chart (such as Sweden, Great Britain and Germany) appeared to have witnessed higher rail market shares compared to those at the bottom of the chart (Spain, Luxembourg and Ireland). High truck fees were also identified as a factor in the modal split towards rail in some countries such as Germany, Austria and Switzerland (Islam et al., Citation2016).
In a 2014 study, Islam considered constraining factors and enablers for the European rail freight market. He concluded that the door-to-door service model which was a high priority for modern supply chains was absent among rail operators. This door-to-door service is achievable only when rail transport is integrated with road. Furthermore, in their assessment of advances in competitiveness of Pan-European rail freight services, Islam and Eidhammer (Citation2016) found that intra-rail competition had improved following the entrance of new operators; however, levels of competitiveness achieved were not enough to result in a modal shift of cargo from road to rail. Major attributes of road freight services such as price, transit time and flexibility were yet to be matched.
While the European rail sector appears to promote passenger transport, U.S railway networks and infrastructure are mostly owned by freight operators with passenger service providers operating as tenants on the freight lines (Islam, Citation2014). The U.S railways’ success story includes outcomes such as reduced freight rates and improved productivity. Spychalski and Swan (Citation2004) opine that these results were achieved through a mix of strategies including the termination of loss-making services, use of more modern and efficient equipment, flexible work rules and reductions in employment.
Lessons for Nigeria
Nigeria’s rail infrastructure is state owned, and its services are equally state operated. Meanwhile, studies from more developed climes such as the EU and USA show that rail liberalization does lead to improved rail freight market shares. Liberalization of transport services in Nigeria has occurred in the air transport sector and is equally being envisioned for the rail sector as espoused in the 25 -year Strategic Vision for Nigeria’s Railways. Currently, the focus is on modernizing the railways via a shift from narrow to standard gauge tracks. Attempts at concessioning the 3505 km of narrow gauge tracks are yet to yield positive results, owing in part to issues of legislation. Recently, ticket services are now being outsourced to private companies on some standard gauge tracks. The conclusion is that the state must gradually divest from the railways and embrace private sector participation in the sector, if broader gains are to be seen in the rail sector.
Knowledge gaps
None of the studies reviewed on rail freight in Nigeria undertakes a direct comparison of road and rail on specific performance indicators. This study contributes to fill this gap, and by so doing provides evidence to propel speedy conclusion of rail modernization efforts in Nigeria. This will ensure that rail becomes competitive for freight transport.
Methodology
The study area for the research is the Lagos–Kano corridor, one of the two main rail lines of narrow gauge, on the western flank of Nigeria’s rail network, which caters to both passengers and freight. On the eastern flank is the Port Harcourt–Maiduguri corridor. Freight flows were studied on road and rail routes for the chosen corridor. An inventory map of the country’s road and rail network infrastructure (which also includes the Lagos–Kano corridor) formed the baseline maps for the study. Transport costs, transport firms operational cost, trip time, fuel consumption and freight throughput data were obtained for road and rail freight shipments to enable descriptive and comparative analysis of cost and energy efficiency for both transport modes.
Data was sourced from the NRC, the National Association of Road Transport Owners (NARTOFootnote4) and the Nigerian Shippers’ Council (NSC). The NSC represents an umbrella association of customers who patronize the transport market for the shipment of freight. The NRC provided secondary data on freight types on Lagos–Kano corridor, freight rates, fuel consumption and trip frequencies. NARTO provided equivalent primary data for roads as well as freight origin locations in the Lagos area. The data from NARTO was in the form of pooled and average data for major freight movers on the Lagos–Kano corridor. The NSC provided primary data on truck types, fuel utilization and cost components of road haulage rates. This data also relates to pooled data of freight movers on the Lagos–Kano corridor. A small group consisting of five freight movers was included in a focus discussion to interrogate issues on modal choice. All of the data described above was obtained using semi-structured questionnaires and data checklist templatesFootnote5 during the field survey conducted in mid-year 2019. Given the nature of cross-sectional data obtained for roads, data analysis was basically descriptive, including description of the infrastructure network, analysis of freight throughput and freight flow analysis.
Results and discussion
Road and rail infrastructure networks
Road and rail networks constitute the infrastructure layer in this study. These networks supply the capacity needed to absorb the traffic market. As at the time of field work in 2018, Nigeria’s rail network consisted of 3505 km of narrow gauge lines and 617 km of standard gauge lines. Trains on the narrow gauge average about 35 km/h, while those on the standard gauge average 90–100 km/h. The narrow gauge line traverses as many as 28 out of the 36 states of the country, while the standard gauge line runs through 10 states and the Federal Capital Territory (FCT). Prospects for rail modernization include linking all the 36 state capitals and the FCT by standard gauge line totalling 3421 km. A baseline map of the rail network, showing the corridor of interest (Lago–-Kano narrow gauge line), is shown in . Nigeria has about 194,000 km of road, about 70% (135,000 km) of which are unpaved, according to the Infrastructure Concession and Regulatory Commission (ICRC) (Izuwah, quoted in www.vanguardngr.com). The road network map is presented in and includes the Lagos–Kano road corridor.
Figure 2. Nigeria’s rail network.
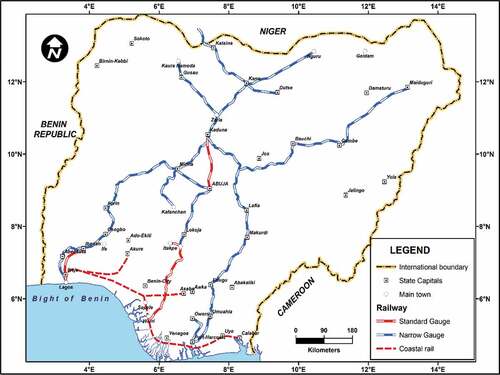
Figure 3. Nigeria’s road network.
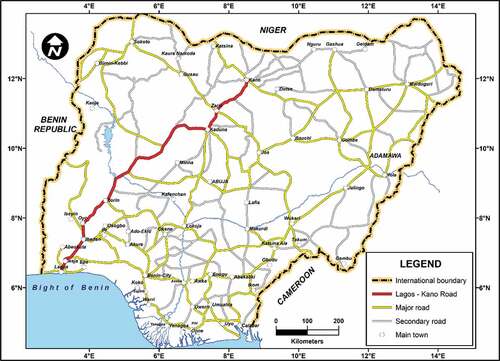
The total rail and road networks translate to a density of 0.0045 km and 0.21 km per square kilometre of land area, respectively. The road network is clearly more ubiquitous, but mostly of poor quality (70% unpaved), while the current rail network is grossly inadequate as reflected in very low density. The infrastructure system so described provides the basis for our analysis of vehicle and freight flows in the network.
Vehicle flows via road and rail
Transport operators supply load units in the transport system and provided the needed capacity for material flows in the network as shown in the Wandel model. The National Association of Road Transport Owners (NARTO) office provided truck flows for different commodity types (dry freight) which originate from Lagos and environs, destined for Kano. This was used to estimate average daily truck flows for 2017; total number of truck trips on the Lagos–Kano corridor came to 480 trucks daily, estimate of 165,600Footnote6 trips annually. The wet freight component obtained from the Petroleum Products Pricing and Regulatory Agency (PPRA) truck-out reports could not be used because data on fuel trucks were not recorded for routes. Rather, records were simply for nodes (i.e. different states). Since the data was non-directional, it had to be excluded from the data pool. Consequently, a limitation of the study is that articulated vehicles data and consequent throughput is underrated as it pertains only to dry freight. Meanwhile, data obtained from the NRC showed load units supply by rail (freight train movements) occurred on the average three times a month in 2017 and seven times a month in 2018. Trucks are clearly dominant with respect to vehicle flows in the transport system.
Discussions relating to distribution of freight (freight throughput and freight flows) are discussed against the background of transport costs and energy use by vehicle units in the transport system.
Freight transport costs and energy use by road and rail
Similar to preliminary findings on freight transport costs by Abioye (Citation2016), data obtained from NARTO and from NRC show that haulage rates on road are far more expensive than rail freight rates. shows freight and haulage rates on rail and road on the Lagos–Kano route. Three destinations are used as sample points, one in close proximity to the origin (Abeokuta), the second about midway (Lokoja) and the third is Kano which is the final destination point on the route.
Table 1. Road and rail freight charges
Much of the freight originates from Lagos ports, reflecting the import dependent nature of the Nigerian economy. Road haulage vehicles may be 30 or 45 tons sided body/general cargo trucks, they may also be 20 feet, 40 feet or 2 × 20 feet container carrier trucks. Rail and road freight charges are charged per ton and graduated based on distance for roads. The Nigerian railways charges N7.10 per ton per km of dry goods rail freight, while haulage rates range from N59.4 at 101 km to N15.6 per km at 1149 km distance. This shows the principle of transport rates tapering with increasing distance. At 101 km, rail freight charges for a 30 ton freight amounts to about 11% of what obtains for road charges. Rail freight charges form about 30% of road charges at 540 km distance and about 44% of road charges at 1126 km. The breakdown on road haulage charges cost components as given by NARTO is listed in . Some parallels of road cost component are provided for rail to attempt some comparison.
Table 2. Cost components of road freight rates
Road freight shippers incur a lot of overhead costs which add on to the haulage rates. Some of these costs are equally incurred by the rail service provider, but are spread over larger tons of freight (given the larger capacity offered by trains) and multiple users of freight wagons. This phenomenon is what underlies the rail’s comparative advantage in the movement of bulk freight over medium and long hauls. A sided body/general cargo truck would accommodate a maximum of 45 tons of freight thereabout, while a 2 × 20 feet container carrier truck may accommodate about the same tons of freight for road haulage.
A full rakeFootnote7 according to the NRC was capable of accommodating 1000–1200 tons, but currently takes about 600 tonsFootnote8 due to challenges with locomotives. At this suboptimal condition, maximum capacity on one train trip amounts to about 13 times the maximum capacity of road haulage vehicles (45 tons). Clearly, some of the costs borne by the state in the provision of rail services are passed on to the consumer; however, the amount paid for the service often represents a subsidized charge. This is evidenced in the difference between the costs of running rail operations and the revenue which accrues therefrom. As at August 2017, 30 million naira was generated monthly from the Abuja–Kaduna rail line, while the government expended 56 million naira monthly running the trains on this line (News Agency of Nigeria (NAN), Citation2017). This difference represents a subsidy on fares and is a recurring decimal for passenger and freight traffic on both standard gauge and narrow gauge lines. Very likely, rail freight charges will become cost-reflective if taken over by private operators. Nevertheless, private operators will only take charge if tracks can afford some minimum acceptable speed. Their locomotives will offer faster speeds, and they will definitely offer consumers increased frequencies. These factors combined will lead to increase in market share and result in economies of scale for private operators. Consequently, freight rates will still be appreciably below that which is offered on the roads.
With respect to energy efficiency, trains in use by NRC consume more fuel per kilometre when compared with trucks. However, the larger capacity offered by trains makes average energy use per freight ton lower for trains than for trucks. This is analysed in .
Table 3. Energy use by trucks and trains
Most trucks are of 30–45 ton capacity, and at 100% load factor (full capacity) will use up as much energy as what a train would at 50% load factor (half capacity). Response from NARTO representative is that 60 ton trucks are not common; they however match current train energy use at full capacity. Energy use is often more efficient for high-capacity modes which are consequently more environmental friendly.
Freight throughput performance in road and rail
While rail transport is theoretically known to have comparative advantage in freight throughput and lower unit cost of transport, it is necessary to determine empirically if this is in fact the case in Nigeria currently. Performance measures were therefore computed based on freight throughput figures, operational costs, kilometres travelled, energy (fuel) cost, transport time and freight revenue. shows performance measures calculated for road and rail using data for 2017/18 on the Lagos–Kano corridor.
Table 4. Performance measures in Nigeria’s land transport (Lagos–Kano corridor)
Clearly, absolute throughput of freight is much higher on roads than on rail, with roads recording about 247 times of throughput achieved on rail on the same corridor. Freight ton kilometres (weight of freight multiplied by total distance travelled) is 252 times higher on roads than on rail. Road speed is over twice that of rail; while trucks complete their journey on the corridor in two and half days on the average, freight trains complete the trip using an average of five and half days. The freight throughput per unit cost of operations is about two and half times higher on roads, and shows that for each Naira spent on operational costs, more freight is moved on road than on rail.
The comparative advantage of capacity offered by rail however shows up in its performance in freight ton-km per vehicle hour travelled. While freight trains can move as much as 600 tons per trip, most trucks move 33.6 tons, as seen in the survey. Consequently, for each hour travelled, trains achieve much higher freight ton-km. The fact that freight ton-km in absolute terms is higher on the road shows that there are numerous articulated vehicles on the road to enable achievement of this feat and so give a higher performance score than rail. Trains are also more efficient users of energy. In spite of the fact that freight trains are operating at half capacity, freight throughput per litre of diesel on rail is almost five times that achieved on road. Freight trains use about 4504 l of diesel on the corridor, while trucks use an average of 1200 l. However, the huge capacity offered by the train discounts the energy use per ton of freight. Revenue per ton of road freight is about 10 times the amount achieved on rail. While freight shippers are profit maximizers, rail transport is provided mostly as a social service and at subsidized rates; this would explain differential in revenue per ton of freight. Although revenue per ton of freight and freight throughput per unit cost was calculated for the entire rail network; it nevertheless gives an indication of what corridor-specific figures (such as Lagos–Kano) would approximate.
Freight flow patterns by road and rail
The patterns of freight flows from origins to destination relate to the production and distribution layer espoused in Wandel’s TLM. Although rail transport offers lower unit cost per freight throughput, the patterns of freight flow lean more to roads. This is as a result of the flexibility offered by road transport; flexibility is mostly with respect to time, routing and ability to track consignments personally. Irrespective of the freight type, freight owners desire the flexibility offered by road haulage, but more so when freight is of perishable nature. show the flow of freight by rail and road, respectively ,on the Lagos–Kano corridor.
Figure 4. Monthly freight flows by rail.
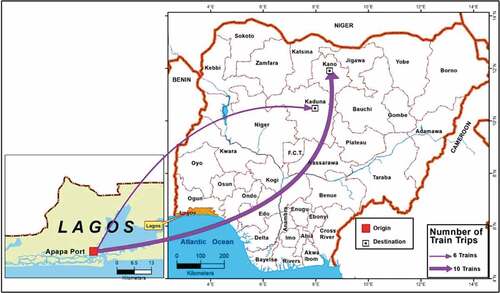
Figure 5. Monthly freight flows by road.
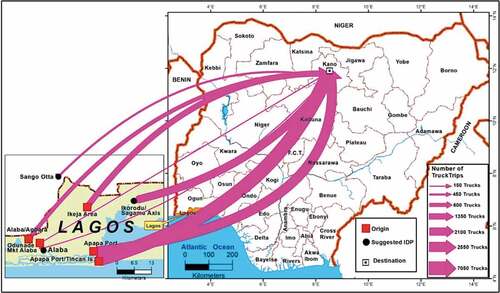
show that freight flows on the roads are clearly much denser that what is obtained on rail. Road capacity on the land corridor is stretched, while rail capacity in underutilized. Rail freight originates and is distributed mostly from Apapa port while road freight originates from Lagos port area and environs, Ikorodu/Sagamu axis, Ikeja area, Badagry expressway area, Agbara area, Sango-Ota and Ibeju-Lekki area. The fact that there are several origins for road freight again underscores its flexibility and preference for freight shippers. In , freight origin points which account for substantial truck traffic have been indicated as possible locations for intermodal hubs. Among these locations, Ikorodu/Sagamu axis and Ikeja area are the most heavily trafficked points in the hinterland. Major components of rail freight include dry food products (bulk), containers, cars and petroleum products. Road freight components include dry and perishable food items, and pharmaceutical products – these appear to be the major components of road freight. A variety of inputs including building materials, fertilizers and vehicle spare parts as well as a wide range of finished products (electronics and other household appliances) are equally transported by roads. Road freight components appear to lean more towards distribution and delivery of retail items (dry, perishable food items and pharmaceuticals). These retail items constitute daily needs which require frequent delivery to accessible and remote locations. The flexibility offered by road transport thus caters well to this market. Expectedly, rail attracts transport of heavy duty and bulk items such as containers, cars and petroleum products – these represent imported consignments cleared from the sea ports.
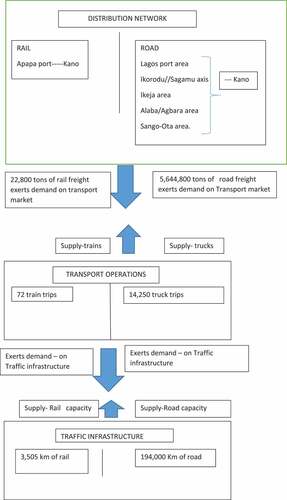
Ideally, both freight types (retail for daily need and bulk containers) would exert demand on the transport market (load units supplied by trains and trucks). However, given that load supply units are in short supply for rail transport,Footnote9 the road transport market is proving to be the more viable land transport option for almost all types of freight. The road infrastructure capacity however cannot absorb the diversions of freight which ordinarily would have been moved by rail. Road supply capacity has not witnessed any major expansion in the last decade (road network stands at 194,000 km over a decade), but interviews conducted with Narto show that the demand for freight movements using trucks has increased tremendously over the last couple of years, indicating that vehicle flows and vehicle loadings have equally increased and are exerting on road infrastructure. The impact is that roads and road infrastructure are deteriorating fast under pressure given that truck payload capacities are being exceeded. gives a descriptive pictorial analysis of freight flows by road and rail using the cross-sectional data obtained for 2017. Data on the density and types of road/rail freight will help guide policy and planning needed for modal shifts in freight transport.
Figure 6. Freight flows by road and rail on Lagos–Kano (2017) depicted in three-layer mode.
There are really no freight train schedules, unlike what is obtained for rail passengers. Freight trains move based primarily on availability of locomotive. Frequency of rail freight service varied over the period 2014–2018 from as low as two trips per month to seven trips per month. At its peak, the frequency of rail freight services is less than twice a week. Meanwhile, vessels conveying freight of varying types berth at the Apapa port daily waiting for distribution to several destination points in Nigeria. These tons of freight are flowing inland via the road transport system as seen in the number of trucks deployed from Lagos area on the Kano route daily, bearing different freight types. Service consistency therefore falls severely short on the rail route, while road offers freight transport service on demand. While freight flows on the 1149 km road distance to Kano are completed in 2–3 days, rail freight on the same route of 1126 km is completed in twice the time (5–6 days). Information obtained from the NRC is that locomotives purchased in 2010 have maximum speeds of 100 km/h. However, it appears that these are not in optimal conditions. Moreover, the rehabilitated tracks need revisit as they are also not in optimal condition and are limiting train speed. It is critical that the state invests in upgrading rail infrastructure to be able to woo private investors into financing rolling stock. Rail tracks offering speeds as low as 35 km/h which are not attractive to freight shippers can in no way be attractive to potential investors.
The low frequency offered on rail for freight movements is as a result of the low demand for rail services. This low demand is closely linked to the poor speed of 35 km/h offered on rail. Hence, we see a circularly causal effect of low rail speed, leading to low demand then to low frequencies offered by the NRC and ultimately to low output in rail freight transport. Freight owners will keep trading off the high cost of road haulage as long as transport time for freight on rail remains twice the time for roads. If train speeds could match that of trucks and transport time was similar to road haulage time, business sense dictates that freight owners will shift to rail which offers lower unit cost and more predictable transport time as a result of track monopoly. Currently, the slow speed, low frequency of service and long transport time are disincentives to freight owners and shippers.
Analysis of freight flows
Factors influencing modal choice
The most important factor influencing modal choice for freight shipments according to the freight movers and key informant from NARTO is the frequency of service, which ultimately affects time of shipment and transport time to destinations. Both factors must be improved simultaneously if shippers are to divert their freight to rail. If freight train frequencies are increased such that there is a daily trip assured, but speed remains at 35 km/h, freight shippers will not patronize the train. If, however, there is a predictable daily freight train on the Los–Kano route and it can aim to complete its journey in one and half days, it is very likely that business sense will prevail and shippers will be encouraged to move freight by rail. However, decisions with respect to freight movements in Nigeria’s land transport space seem to transcend economics. NARTO represents a strong and formidable trucking industry with vested interests in road transport. Beyond increasing service frequencies and speed in rail, truck owners and shippers will need strong incentives to shift to rail. This may mean involving them in provision of rail services from which they can obtain economic rents.
A contextualization of empirical findings within theory
As espoused in Wandel’s TLM, production and distribution systems generate freight flows which make a demand on the transport market. The main origin for generation of freight flows on the Lagos–Kano corridor is Apapa port area. Given the antecedents of absolute throughput performance which is many times higher on roads, freight owners and shippers make more demands on road than on rail. Load units supplying freight transport service are therefore mostly in the form of trucks rather than trains. Trucks, however, have much smaller capacity than trains;; therefore in order to keep up with throughput performance, several load units of trucks are deployed. The vehicle flows so generated make a huge demand on the road infrastructure system leaving the rail under-utilized. However, the decision to patronize a transport market is entirely a business decision, which, according to freight shippers on the Lagos–Kano corridor, is influenced chiefly by the frequency of service offered by road and rail transport operators and transport time spent between origin and destination. The quality of infrastructure itself is a bane of the rail subsector. Given that the Lagos–Kano track is a narrow gauge line offering very slow speeds, freight owners and their shippers have abandoned the trains for trucks. The lesson here is that comparative advantages of transport modes will only be explored if technology confers a competitive advantage on that mode.
The TAF model posits that flows (in this case movement of freight) are determined by the transportation systems in place (road and rail networks) and the activities occurring within a socio-economic milieu. Drawing from the model, we conclude that flows should influence investments in transportation systems, given patterns observed in ‘activity’. Activity patterns show an import dependent economy, which means that ports are priority nodes for origination and distribution of freight. The pattern of activity also depicts a high density of freight flows on the road corridor which really is stretching road network load capacities. Consequently, investments in high-capacity modes such as rail are desirable, with priority tracks targeted at intermodal connection at the main origin node for freight distribution, namely the Lagos port area.
Conclusions and recommendations
In Nigeria, both rail and road infrastructure stock fall short of standard benchmarks in physical planning. The unit cost of freight transport is far cheaper on rail than on roads with rail freight costs ranging from 11 to 44% of road haulage charges. Per capita energy use is also lower for rail than for road, making the former more environmentally friendly. In spite of factors in favour of rail, freight throughput performance with respect to operational costs, average speed and consequently transport time is higher on roads than on rail. Thus we observe freight flows occurring much more densely on roads than on rail tracks. A major disincentive for freight owners and movers is the slow speed offered on rail, the low frequencies of service and the elongated transport time. Freight shippers are therefore trading off higher costs of road haulage to buy time and to enjoy some flexibility in routing.
In order to achieve shifts of land freight to rail, rail tracks must be rehabilitated to the point that faster speeds are assured. An upgraded track will attract private investors to finance rolling stock. Consequently, rail freight frequencies on the narrow gauge track will be increased. Beyond infrastructure and economic investments though, current actors in the trucking industry need to be incentivized for modal shift. There are plans in place to link the standard gauge rail to Apapa ports; this same plan should be extended to Tincan Island port as both ports have substantial cargo throughput. The findings on freight flow show that Apapa port and its environs (the Lagos port area) form major origin points for flows on the Lagos–Kano corridor.
Apart from the Lagos port area, other freight origin/distributions centres identified in the Lagos area should be prioritized for intermodal hub facilities, integrated with the rail tracks and carriageways in good condition to accommodate freight movements. Such integration will facilitate freight movements from heavily trafficked origins especially Ikorodu/Sagamu axis and Ikeja area. The breakdown of cost components incurred in road haulage when compared with rail costs shows that there are several costs (overheads and others) that can be avoided when freight shippers deflect to rail services. The implication of this deflection would be increased competitiveness and increased profit margins for freight and business owners.
Supplemental Material
Download MS Word (26.2 KB)Supplemental data
Supplemental data for this paper can be accessed on the publisher’s website.
Disclosure statement
No potential conflict of interest was reported by the author(s).
Additional information
Funding
Notes
1. In Nigeria, sea ports are a significant hub for freight and represent the origin of many freight shipments. They will therefore feature as originating nodes in the study methodology.
2. This is a maximum potential capacity measure – assuming full capacity of the most commonly used road/rail vehicles and given the average vehicle speed that subsists for road/rail, what is the freight-ton km achieved per hour travelled on the corresponding road/rail corridors?
3. This was generated during field survey.
4. The subgroup of the association consisting business units involved in the haulage of dry cargo.
5. The instruments used for data collection are given in the Appendix.
6. Allowance given for 15 non-working days in a year owing to truck down times or observed holidays.
7. A line of coupled wagons and coaches.
8. 15 wagons weighing 40 tons each.
9. An NRC official mentioned that freight movements on the narrow gauge depend on locomotive availability.
10. Other arrangements (apart from scheduled train services) by companies or customers to move freight.
1 Other arrangements (apart from scheduled train services) by companies or customers to move freight
References
- Abioye, O. 2016. “Privatisation of the Nigerian Railway Corporation: An Evaluation of Critical Choices.” Ph.D Thesis submitted to Cardiff Metropolitan University.
- Adesanya, A O. (2010). Bringing the Nigerian railways back on track: Challenges and options. Ibadan: Lecture Delivered at the Monthly NISER Seminar Series, NISER.
- Adesanya, A. O, Adeniji, K, Olokesusi, F, Adeagbo, A, Olorunfemi , F, Daramola, A, Ehigimetor, J, Oke, O, Anyali, E et al . (2008). Impact evaluation of infrastructure reform: Focus on federal roads programmes since 2003. NISER.
- Adesanya, A. O, Daramola, A, Adeagbo, A . Economic Recession and Critical Infrastructure. In Adeyeye, V, and Akpokodje, G., Economic recession and pulling the nigerian economy out of recession, by V.A Adeyeye and Godwin Akpokodje. Nigerian Institute of Social and Economic Research (NISER); 2017. p. 117–164.
- Alokan, O O. (1995). The road freight industry in Nigeria: New challenges in an era of structural adjustment. Transport Reviews, 15(1), 27–41. https://doi.org/10.1080/01441649508716899
- Arvidsson, N. 2011. “Operational freight transport efficiency- a critical perspective.” Essay, university of Gothenburg, school of business, economics and law. (University of Gothenburg, School of Business, Economics and Law).
- Bjarne, P. (2016, November 8). Sustainable road freight transport: An Asian perspective. the furture role of trucks for energy and environment. (Accessed 12, January 2020). www.cleanairasia.org.
- Central Bank of Nigeria (CBN). (2014). Central Bank of Nigeria statistical bulletin.
- Development Bank of Southern Africa, (DBSA). 2012. Accessed July 23, 2013. http://www.gov.za/documents/download.php?f=174619
- European Commission for Mobility and Transport. 2017. An overview of the EU road transport market in 2015. European Commission for Mobility and Transport, Unit C.1- Road Transport.
- Grenzeback, L. R, Brown, A.; Fischer, M.J.; Hutson, N.; Lamm, C.R.; Pei, Y.L.; Vimmerstedt, L.; Vyas, A.D.; Winebrake, J.J. Freight Transportation Demand: Energy-Efficient Scenarios for a Low-Carbon Future. Transportation Energy Futures Series, DOE/GO–102013–3711, pp. 82. Prepared by Cambridge Systematics, Inc., and the National Renewable Energy Laboratory (Golden, CO) for the U.S. Department of Energy, Washington, DC. 2013, March.
- Havenga, J. H. 2007. “The development and application of a freight transport flow model for South Africa.” PhD thesis, Department of Logistics, Stellenbosch University.
- Havenga, J. H, & Simpson, Z. 2012. “National logistics costs and global trends’, in 9th annual state of logistics survey for South Africa: Connecting neighbours engaging the world.” CSIR. Accessed July 21, 2013. http://www.csir.co.z
- Islam, D. M. Z. (2014). Barriers to and enablers for European rail freight transport for integrated door-to-door logistics service. part 1: Enablers for multimodal rail freight transport. Transport Problems, 9(3), 43–56. http://transportproblems.polsl.pl/.
- Islam, D. M. Z, & Eidhammer, O. (2016). Advances in the competitiveness of pan-European rail freight services: Findings from a case study. R and D Management, 46(4), 761–780. https://doi.org/10.1111/radm.12135
- Islam, D. M. Z, Ricci, S, & Nelldal, B.-L. (2016). How to make modal shift from road to rail possible in the European transport market, as aspired to in the EU transport white paper 2011. European Transport Research Review, 8(3), 18. https://doi.org/10.1007/s12544-016-0204-x
- Izuwah, C. (2017, 7 September). 135,000km road network in Nigeria remains untarred— ICRC. Vanguard.Accessed November 11, 2017. https://www.vanguardngr.com/2017/09/135000km-road-network-nigeriaremains-untarred-icrc/
- Rodrigue Jean-Paul, Claude Comtois, and Brian Slack. (2006). The Geography of Transport Systems (3rd edition). Routledge, London & New York.
- Joseph, K, & Adie, T. (2015). Metro modes charting a path for U.S freight transportation network. global cities initiative. A Joint Project of Brookings and JPMorgan Chase. https://www.brookings.edu/program/brookings-metro/.
- Matthew, V T. 2011. “Transportation systems analysis.” Lecture notes in Transportation Systems Engineering. https://www.civil.iitb.ac.in
- News Agency of Nigeria (NAN). 2017. Abuja-Kaduna rail line generating 1 million Naira daily. https://www.premiumtimesng.com/news
- Nigeria Railway Corporation. (2018). Facts and figures. managing director’s office, NRC headquarters, Ebutte-Metta, Lagos and D-Way consulting.
- Nigerian Institute of Social & Economic Research, (NISER). (2015). Pattern of economic growth and extent of its inclusiveness in Nigeria</ctl>. In Unpublished 2015 team research project (TRP) report. Productive Sector Group, Economic Policy Research Department.
- Odeleye, J. (2015). The need for multimodal transport development in Nigeria. Journal of Geography and Regional Planning, 8(9), 239–243. https://doi.org/10.5897/JGRP2015.0508
- Ogunsanya, A. A. (1981). Urban freight transport in a developing economy: The case of Lagos, Nigeria. The Nigerian Geographical Journal, 24(1&2), 147–165.
- Ogwude, I. (1990). Estimating the modal choice of industrial freight transportation in Nigeria. International Journal of Transport Economics, 17(2), 187–205.
- Onakala, P ca. 2015. “Transportation development in Nigeria: The journey so far and the way forward.” 97th inaugural lecture of the university of Nigeria Nsukka.
- Rafaa, M, & Riad, H. (2014). Road freight transport and carbons iodide emissions: Policy options for Tunisia. Energy and Environment Journal, 25(1), 79–92. https://doi.org/10.1260/0958-305X.25.1.79
- Rodrigue, J. P, Comtois, C, & Slack, B. (2009). The geography of transport systems, 2nd edn. Routledge.
- Spychalski, J. C & Swan. (2004). P.F. U.S. rail freight performance under downsized regulation. Utilities Policy, 12(3), 165–179. https://doi.org/10.1016/j.jup.2004.04.002
- Ubogu, A. E. (2011). The potentials of rail-road integration for port-hinterland freight transport in Nigeria. International Journal for Traffic & Transport Engineering, 1(2), 89–107. http://statistics.cbn.gov.ng/cbn-onlinestat
APPENDIX I
– DATA COLLECTION INSTRUMENTS
Research instrument for Nigeria Railway Corporation, LAGOS DISTRICT. EBJ, LAGOS.

THIS STUDY IS ON FREIGHT TRANSPORT IN LAGOS DISTRICT. IT IS PART OF A SERIES OF RESEARCH AT THE NIGERIAN INSTITUTE OF SOCIAL AND ECONOMIC RESEARCH (NISER). OUR FOCUS IS ON FREIGHT TRANSPORT ON THE IDDO-KAJOLA ROUTE. KINDLY ASSIST BY PROVIDING INFORMATION NEEDED.
TARGET RESPONDENT: NRC OFFICIAL
INFORMATION NEEDS:
1. Kindly provide data from your records on volume of freight moved on Iddo-Kajola route in the last five years (2014-2018).
2. What are the major destinations for freight trains on the Iddo-Kajola route and what major freight types are transported to these various destinations? (see )
Table 1. DESTINATIONS AND MAJOR FREIGHT TYPES ON IDDO-KAJOLA ROUTE
3. What is the maximum freight capacity (for dry and wet freight) on the Iddo-Kajola route? (give consideration to number of additional wagons that a locomotive could accomodate). See
Table 2: FREIGHT LOAD FACTORS
4. How often does the Iddo-Kajola freight train run? (please supply us your schedule for freight trains on this route).
5. What is the cost per ton per rail km on Iddo-Kajola route?……………………………
……………………………………………………………………………………
6. What is the cost of fuelling a train trip on the Iddo-Kajola route?
…………………………………………………………………………………………
7. Please provide information on other non-scheduledFootnote1 freight train services (if any) on the Iddo-Kajola route (see )
Table 3. Non Scheduled Train Operations
8. Why do you think rail patrons prefer to move their freight by rail rather than road?
9. Kindly supply a list of regular users of freight trains on the Iddo-Kajola route and the freight types moved.
KINDLY PROVIDE DETAILS REQUIRED ON FREIGHT LOADING AND FREIGHT TRANSPORT TIME IN
Table 4. FREIGHT TRANSPORT TIME
INTERVIEW GUIDE
TARGET RESPONDENT: FREIGHT MOVERS (5-10)
1. Why do you prefer to move your freight by rail?
2. What challenges do you experience, moving freight by rail?
3. What suggestions do you have for improved freight services by NRC?

Research instrument for National Association of Road Transport Owners (NARTO) - LAGOS
DATA ON ROAD PASSENGER AND FREIGHT TRANSPORT IS SCARCE, YET SUCH DATA IS CRITICAL FOR PLANNING IN THE TRANSPORT SECTOR. THIS STUDY IS ONE OF THE SERIES OF RESEARCH PROJECTS BY NISER RESEARCHERS. THE STUDY IS ON FREIGHT TRANSPORT ON LAGOS-KANO ROUTE. KINDLY ASSIST BY PROVIDING INFORMATION NEEDED.
INFORMATION NEEDS:
1. Number of registered members with your branch (NARTO, lagos)
2. Number of registered trucks/trailers/tankers
3. Number of articulated vehicles that ply Lagos-Kano route
4. Major destinations on the Lagos-Kano route (specific cities)
5. Major commodities to various destinations on Lagos-Kano route
6. What proportion of articulated vehicles registered with NARTO (Lagos) make use of
Petrol……………………%
Diesel…………………….%
7. Why do you think freight shippers prefer road transport to rail transport?
8. Do any of your members patronize rail (in addition to road) for shipment of freight?
If Yes please give a proportion, (eg 20%, etc)
KINDLY PROVIDE DETAILS REQUIRED IN TABLES BELOW
: TRANSPORT COST
KINDLY PROVIDE COST OF TRANSPORTING COMMODITIES TO VARIOUS DESTINATIONS ON LAGOS KANO ROUTE