
ABSTRACT
This study investigates the association between surface conditions and pedestrians’ and bicyclists’ route choices during winter. We analyzed responses from two surveys in which pedestrians and bicyclists answered questions regarding their route choices in winter environments. We also conducted an experimental study to investigate the association between surface conditions and route choice. The results indicate that surface conditions have a significant impact on pedestrians’ and bicyclists’ route choice. Specifically, pedestrians avoid slippery surfaces in general, while bicyclists avoid surfaces with a build-up of loose snow on the pavement. When bare pavement is available, some pedestrians change their route from snow- or slush-covered surfaces to walk on a bare surface, even when the amount of snow or slush is minimal. On the other hand, based on the experimental results, a partly ice-covered surface did not deter pedestrians, indicating that a correspondence between actual surface conditions and pedestrians’ visual perceptions is an important factor in their informed decision-making. Decision makers can use the results to gain an understanding of which winter maintenance measures are the most important for implementation in order to provide an acceptable service level that promotes walking and cycling in a winter environment.
1. Introduction
Today, governments and transportation planners in many places are encouraging people to walk and cycle more, as active mobility offers several benefits compared to driving a car, including health gains, reduced emissions, less congestion, and reduced road maintenance costs. Understanding road user behavior is essential for implementing the most efficient measures to make walking and cycling more attractive.
In cold regions, weather conditions can vary substantially by season. These weather differences affect streets and roads. In winter, snowfall, freezing and thawing result in snow and ice buildup on the pavement. This can be a real challenge that must be overcome to supply infrastructure that supports an acceptable level of accessibility for all road users.
To cope with these problems, certain levels of winter operation and maintenance are usually required. Snow removal by plowing or scraping, friction-increasing measures such as sanding or gritting, and some anti- and de-icing applications are typical examples of winter operations conducted on a day-to-day basis to support safe, efficient travel.
A critical aspect of road user behavior is route choice. Route choice is especially interesting because, more so than whether to go on the trip at all, mode choice, and when to travel, it is typically the first road user travel behavior that changes when pedestrians and bicyclists perceive compromised safety (Backer-Grøndahl et al., Citation2007). Given that slippery or otherwise difficult to maneuver surfaces are typically associated with compromised safety, this is a good starting point for investigating which types of surfaces pedestrians and bicyclists find more or less attractive.
Although extensive research has been conducted on pedestrians’ and bicyclists’ route choices, the association between route choice and surface conditions during winter has not yet been thoroughly studied. This study’s research questions were as follows:
How do pavement surface conditions affect pedestrians’ and bicyclists’ route choice decisions during winter?
Does a difference in winter maintenance service level––that is, between a bare pavement standard and a winter pavement standard––affect pedestrians’ and bicyclists’ route choices?
We examine both pedestrians and bicyclists in this paper rather than investigating them independently in separate papers because they usually share the same road or street facilities. In Norway, where this study was conducted, bicyclists are allowed to use sidewalks. Even when the two groups are separated, the methods used to operate and maintain the facilities they use are usually the same.
2. Literature review
Unlike vehicular traffic, where route choice is mainly based on efficiency, several factors influence pedestrians’ and bicyclists’ decisions.
2.1 General factors that influence pedestrians’ route choice
The literature suggests that pedestrians choose routes with which they feel comfortable. When they perceive their current route as unattractive, they take detours to utilize more comfortable routes (Corazza et al., Citation2016; Marisamynathan & Vedagiri, Citation2014; Ren et al., Citation2011). After conducting on-site interviews in six European cities to explore aspects of pedestrian comfort, Øvstedal and Ryeng (Citation2002) found that pedestrians’ feelings of safety and security are the most important factors when walking outdoors. Feeling safe and secure and surface quality were found to be the most important factors influencing pedestrians’ sense of comfort.
In general, when several route options are available, pedestrians tend to choose the shortest route to reach their destination (Muraleetharan et al., Citation2005; Seneviratne & Morrall, Citation1985; Verlander & Heydecker, Citation1997). Other factors influencing route choice are the width of the walkway, pavement surface characteristics, attractions along the route, the purpose of the trip, conflicts with other road users, the inclination of the walkway, and available facilities (Muraleetharan et al., Citation2005; Sevtsuk et al., Citation2021). Pedestrians state that they sometimes choose a different route because of compromised safety. Based on surveys in two Norwegian cities, Backer-Grøndahl et al. (Citation2007) found that 60% of pedestrians sometimes chose a different route because they felt unsafe, and 7% did so often. Pedestrians feel more unsafe in the evening than during the daytime. Insufficient street lighting, the fear of encountering unpleasant people, and other road users’ behavior were found to be more important than surface conditions in making pedestrians feel unsafe.
2.2 Winter-related factors that influence pedestrians’ route choice
Of the general factors that influence pedestrian route choice, the quality of the surface is directly related to winter operation and maintenance. In winter, the pavement surface is affected by the chosen winter maintenance level of service (LOS) and how well it is executed. In particular, the evenness of the pavement, friction level, and accessibility were affected by winter maintenance. Walkway width can also be affected by winter maintenance through the effectiveness and rationality of snow clearance and storage. In a Swedish study based on interviews and observations, Sakshaug et al. (Citation2013) found that very few people make detours to walk on bare instead of icy road surfaces. They concluded that many people do not seem to take the risk of slipping and falling seriously.
2.3 General factors that influence bicyclists’ route choice
Bicyclists’ route choices are sensitive to the effects of distance, slope, the presence or absence of traffic lights, traffic volumes, and turn frequency (Broach et al., Citation2012; Stinson & Bhat, Citation2003). Travel time is another important factor in bicycle route choice, especially for commuters (Sener et al., Citation2009). Wardman et al. (Citation2007) found that the time spent cycling is valued approximately three times higher than travel times for other modes. Furthermore, bicyclists prefer simple routes and want to travel in straight directions (Zimmermann et al., Citation2017).
The presence and quality of infrastructure are also key factors in their route choice. A recent study from Oslo, Norway found that, on average, bicyclists cycle 21% longer than the shortest possible route (Hulleberg et al., Citation2018). Detours are mainly made to access cycling infrastructure that is separated from other traffic. Avoiding upward slopes was found to be another important factor influencing route choice decisions. Menghini et al. (Citation2010) found that distance was the most important variable influencing bicyclists’ route choices in Zürich, Switzerland. The portion of bicycle paths was also found to be substantial, but this had a smaller impact than distance.
Backer-Grøndahl et al. (Citation2007) found that 55% of bicyclists sometimes changed their travel route because they felt unsafe; however, only 1% reported doing this often. For bicyclists, surface conditions and other road users’ behavior were found to be the main reasons contributing to their sense of compromised safety (Backer-Grøndahl et al., Citation2007).
2.4 Winter-related factors that influence bicyclists’ route choice
Most research related to bicycling in winter conditions has investigated how winter-related variables affect the decision of whether to cycle, without specifically examining route choice. In a survey of 1 402 current and potential cyclists in Vancouver, Canada, Winters et al. (Citation2011) found that snowy and icy routes were major deterrents when deciding to ride a bike. In a study of the self-reported commuting trips of bicyclists from a northern US state, Flynn et al. (Citation2012) found that approximately 2.5 cm of snow on the ground reduced the likelihood of cycling by about 10%. Better snow clearance and perhaps ice formation prevention could lead to a higher winter cycling rate. Indeed, in a Swedish study, Bergström and Magnusson (Citation2003) found that improving winter maintenance has the potential to increase the number of winter bicycle trips by 18%. Snow clearance was found to be the most important measure for achieving this.
Although many studies have investigated the effects of pedestrian and bicycle route choices, there is obviously a knowledge gap in the association between surface conditions during winter and pedestrians’ and bicyclists’ route choices.
2.5 Winter maintenance levels of service
The desired objective of winter operation and maintenance is to create acceptable surface conditions. The goal is to maintain, restore, control, or improve surface conditions to a level that acceptably supports safe, effective travel. In this paper, we will distinguish between two winter maintenance LOS: GsA and GsB. The terms GsA and GsB are acronyms used in the Norwegian guidelines for the two LOS described below.
GsA is basically the implementation of a bare-road strategy for pedestrian and bicycle facilities. Salt is usually used for anti- and de-icing to keep the pavement free of snow and ice. For snow clearance, the pavement is swept by a vehicle with a front-mounted power broom in a manner similar to Swedish ‘sweep-salting’. There are indications that this method results in an increased number of winter bicycle trips and reduced incidence of accidents caused by skidding; in addition, bicyclists, in general, are pleased with the results (Niska & Blomqvist, Citation2016, Citation2019; Niska et al., Citation2019).
On the other hand, GsB is the implementation of a winter road strategy for pedestrian and bicycle facilities. Snow is cleared by plowing, and salt is usually not used for anti- and de-icing. Instead, sanding or gritting is used as a friction-increasing method if the pavement becomes slippery owing to compaction and freezing. GsB also has several requirements regarding the evenness of the pavement, the friction level, and the height of loose snow. The snow accumulated on the pavement should be compact, not loose.
Ideally, the use of salt should be minimized. However, salting for anti-icing, de-icing, and anti-compaction purposes is widespread in Norway. It is a popular method used on roadways, especially in regions where the temperature fluctuates around 0 °C and traffic volume is high. In 2017/18, 325.000 tons of salt were used on Norwegian roads (The Norwegian Public Roads Administration, Citation2019). In recent years, an increased portion of Norwegian pedestrian and bicycle facilities have also been salted owing to the prioritization of these modes of transport. It is assumed that both bicyclists and pedestrians prefer black instead of white pavement, with a compact layer of snow on the asphalt. The use of salt has often been criticized because of environmental concerns and the fact that salt corrodes infrastructure, vehicles, and bikes.
3. Methods
3.1 Surveys
Two surveys asking respondents a wide range of questions concerning winter operations and maintenance were administered to answer the first research question. The surveys were created and distributed by the Institute of Transport Economics, Norway. Only the excerpts concerning route choices are presented here. The remainder has been published separately (Aasvik & Bjørnskau, Citation2021; Johansson & Bjørnskau, Citation2020a, Citation2020b).
The first survey targeted pedestrians and was distributed in February 2019. The second targeted bicyclists and was distributed in June 2019. The two surveys were distributed at different times because they were administered as part of two independent studies. However, since the questions analyzed in this paper are identical in both, we treat them as if they were conducted as part of a single study. The survey was web-based. A total of 2,745 respondents answered the online pedestrian questionnaire. The respondents included members of the Norwegian Automobile Association (n = 1628), the Norwegian Association of Disabled (n = 7), and the Norwegian Pensioners’ Association (n = 31), as well as persons who signed up for an e-mail list (n = 1079). Members of the Norwegian Automobile Association make up 59% of the sample. Respondents from this group were included because they were convenient to recruit, since their member register was available to the Institute of Transport Economics, which distributed the survey. Their members make up 9% of the population in which the study was conducted. Approximately 70% of the population had a driver’s license and an available car at most times, and most drivers were also pedestrians. Therefore, we argue that increasing the sample size by including this group is a greater gain for the study than the potentially negative effect this group could have on the sample’s representativeness.
For the bicycle survey, respondents were recruited from e-mail lists (n = 87) and using posters at bicycle workshops (n = 35). In addition, employees in the city of Oslo received an e-mail invitation (n = 846), and respondents were drawn from the Norwegian Cyclists’ Association (n = 566), as well as through invitations sent via cycling-themed Facebook groups and those generally consisting of dedicated cyclists (n = 885). Other respondents received a link to the survey from project partners in the Norwegian Public Roads Administration (n = 137). This sampling method can be categorized as convenience sampling. It was made clear to the invitation recipients that the target group was cyclists. The survey was web-based, and there were 2,556 respondents in total.
As previously mentioned, the questions analyzed in this study are identical in both surveys. Both surveys’ respondents were asked questions regarding their daily travel behaviors, their attitudes to operation and maintenance related to their travel behavior, and their background information such as age, gender, and place of residence. Respondents were asked about their general travel behavior during winter and not about a specific trip. The questions were formulated to cope with the time-lapse between the bicycle survey’s spring/summer distribution and the survey content requesting the report of typical behavior during winter. Information about trip purpose was not retrieved from either survey.
Filtering was performed to analyze typical pedestrians and bicyclists who are familiar with winter conditions. For the pedestrian survey, only respondents who reported that they usually walk outside during winter and that they leave their homes at least 4–5 times per week were included in the analyses. For the bicycle survey, only bicyclists who stated that they often cycle during winter were included.
For both surveys, we also performed filtering based on the respondents’ place of residence. We filtered out those who live in western and southern Norway, where there is little snow and the average winter temperature is above 0°C, and retained the respondents from the eastern and northern parts. After filtering, there were 1 677 pedestrian survey respondents and 736 bicycle survey respondents. Data were analyzed using SPSS Statistics 26.
3.2 Limitations of the surveys
Due to the recruitment methods used, we do not know the response rates, and we cannot conclude whether the samples represent the overall population. In particular, the bicycle survey, where many respondents are members of the Norwegian Cyclists’ Association, is likely not representative of the average Norwegian bicyclist. However, we are only interested in those who actually walk or cycle during winter and those who are familiar with walking and cycling in such conditions. This is because we want to analyze actual and not potential behavior as much as possible. Therefore, the results reflect experienced winter cyclists’ and pedestrians’ behavior, not that of inexperienced and potential pedestrians and bicyclists. The results should be evaluated with this in mind.
Since the surveys are based on self-reported behavior, the results will be affected by any bias resulting from self-reporting. More specifically, the survey targeting bicyclists relies on self-reported winter behavior reported approximately six months after the end of the winter season. Since the bicycle survey sample mainly consists of experienced winter cyclists, it is assumed that any bias or error resulting from this is minor.
3.3 Experimental study
We conducted an experiment to answer the second research question. The experiment quantified pedestrian and bicycle traffic on two identical pedestrian and bicycle facilities separated by a roadway (see, ). Traffic was quantified in the fall when the surface conditions were identical on both sides; this was the reference period. During winter, one side was maintained through GsA by using salt for anti-icing, de-icing, and anti-compaction, and sweeping for snow clearance. This resulted in a bare pavement surface with visible black asphalt during the entire period. The top left picture in illustrates the surface condition on the side maintained through GsA.
Figure 1. Sketch of the experimental site.
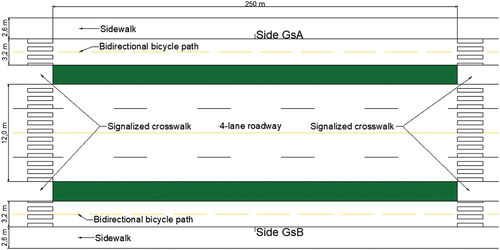
Figure 2. Typical examples of the categorized surface conditions. Top left: Bare pavement. Top right: Snow-covered pavement. Bottom left: Slush-covered pavement. Bottom right: Partly ice-covered pavement.
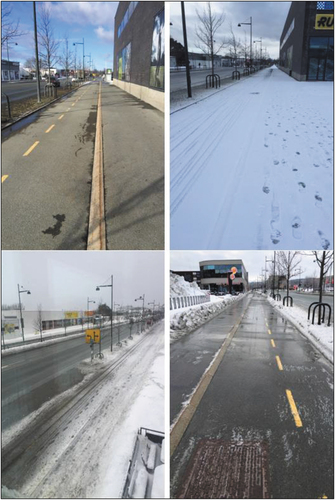
The other side was maintained through GsB by plowing for snow clearance without the use of salt. In practice, this means that we allowed a compact or loose layer of snow to accumulate on the asphalt, depending on the amount of snow. When needed, gravel was used as a friction-increasing measure for GsB. In winter, the temperature fluctuated around 0°C. This resulted in Side GsB, where no salt was used to create varying surface conditions depending on weather and temperature. The surface conditions on this side varied between snow-, slush-, and ice-covered pavement. The amount of snow, slush, and ice on the GsB was relatively modest owing to the weather during the observation period. During this period, the snow depth on the surface was 5 cm or less. Typical examples of the surface conditions of GsB during winter are shown in .
Data collection was conducted in fall 2018 and winter 2019. The infrastructure where the observations were obtained was identical in both periods. Traffic was quantified on five random weekdays in fall and seven weekdays in winter. Observations were taken between 07:30, 18:00. The data consist of 2 060 observations of pedestrians, with 1 246 in fall and 814 in winter. From a total of 1,292, the number of bicycle observations in fall was 965, and in winter, the number of observations was 327.
All observations were taken manually, on-site. The observer filled out a pre-prepared form prepared for this study. The form included a table that differentiated between the time of day, travel direction, type of road user, and which side the pedestrians and cyclists walked or cycled on. Information on weather and surface conditions was also documented in the form. The pedestrians and bicyclists were unaware of their registration. They were not informed that the two sides were maintained differently during the winter; they had to ascertain that through experience or visual perception. The pedestrians and bicyclists were categorized according to gender, travel direction, and age (over or below approximately 60 years of age based on observation). The time of day was registered and divided into morning rush, midday, and evening rush.
The experimental site was a suburban street in Trondheim, Norway. The street lies in a shopping area, and most traffic at the site is either commuter or shopping traffic. This site was selected because pedestrian and bicyclist facilities are identical on each side of the roadway separating them. The annual average daily traffic (AADT) on the roadway was approximately 15,300 vehicles/day. The only varying factors between the two sides are different stores and other destination points along the walkways and cycleways, and the difference in winter maintenance LOS during the winter period. The roadway is relatively flat, with an incline of approximately 0.9%. A schematic of the experimental site is shown in .
Of course, route or side choice is affected by trip origin and destination. To reduce this effect, we required that for any trip to be registered and form part of the dataset, the pedestrian or cyclist had to walk or cycle at least 250 m between the two crosswalks, as illustrated in . This criterion was included to ensure that the pedestrian or bicyclist had a choice regarding whether to cross the street at either end of the registration area and therefore had at least one opportunity to choose the alternative side instead. Further, we assumed that if a trip started or ended between the crosswalks, there was no choice involved, and the side where the trip started or ended would always have been chosen regardless of the surface conditions. Therefore, we did not register the trips that started or ended between the crosswalks; we only included those trips that spanned both crosswalks, as illustrated in . In practice, the pedestrian or cyclist had to pass both crosswalks, pass one and cross the other, or cross both. The goal was to capture the pedestrian and bicyclist through traffic because it was assumed that these road users have greater side choice freedom than those we excluded from the dataset. The crosswalks are signalized and actuated by pushing a button. The waiting time for a green signal to cross the roadway varies between 20 seconds and 60 seconds, depending on traffic volume.
3.3.1 Analyses
The data were analyzed using the Stata version 16. We analyzed the data using binary logistic regression because the outcome variable was binary: The pedestrian or bicyclist walks/cycles on either Side GsA or Side GsB. At the time of registration, each pedestrian or bicyclist that satisfied the criterion outlined in Section 3.3 was registered as walking/cycling on either Side GsA or Side GsB.
The main explanatory variable of interest was surface condition. The reference category for this variable, to which the other categories are compared, was when Side GsB had an uncovered asphalt surface. At that time, the surface conditions on Sides GsA and GsB were identical. This occurred during fall. During winter, the surface condition on Side GsB was either snow, slush, or partly ice covered. Each condition was coded separately. Side GsA always had an uncovered asphalt surface at registration. In summary, the surface condition variable has four categories, one for each of the surface conditions present on Side GsB at some point.
The data were collected during fall when both sides had the same surface conditions to provide a reference for comparison. It was assumed that the number of pedestrians and bicyclists usually walking/cycling on Sides GsA and GsB, respectively, would not be split 50/50 but would be skewed to one side or the other due to factors not controlled for in the regression models. Such factors were assumed to be, for instance, placement of different stores, placement of bus stops, general work trip origins/destinations in the area, and other similar reasons. If data were only collected during winter when the two sides’ surface conditions differed, it would not have been possible to determine how the surface conditions affected the likelihood of choosing one side or the other because the ‘natural’ skewness in the portion that usually uses either side would be unknown.
To test whether any predicted association between surface condition and route choice could be explained by the time of day when the observations were made or by travel direction, we included these variables in the regression models as control variables. We also included the variables of gender and age to determine whether these influenced the choice. All independent variables in the regression model were categorical.
Pedestrian and bicycle data were handled separately in the analyses. Model 1 predicts pedestrians’ side choice, whereas Model 2 predicts bicyclists’ side choice. For both analyses, we report the regression coefficients in log-odds units, standard errors, and p-values. Statistical significance was set at P < 0.05.
3.4 Limitations of the experimental study
A general remark on the experiment that is relevant to both bicyclists and pedestrians is that some road users might not have been aware that the two sides were maintained differently. If they were not aware of this difference, we would not expect the portion of pedestrians or cyclists to vary between the two data collection periods. One implication of this is that the result showing no difference in the portions of pedestrians and cyclists using the two sides in the two periods does not necessarily mean that surface conditions do not affect route choice. On the other hand, if the results show a difference, the effect size might be underestimated because many might not have been aware of the different surface conditions on the two sides.
4. Results
4.1 Surveys
4.1.1 Pedestrians
We analyzed 1 677 pedestrian survey respondents’ answers. The sample consisted of 1 099 men and 578 women; 988 respondents were in the 20–60 age group, and 689 were in the 60–90 age group. Almost one quarter of the pedestrians always or very often use an anti-slip device such as a crampon when walking during winter.
shows the number of people who chose alternative walking routes in winter compared to in summer. As shown in , 55.5% of pedestrians stated that they sometimes or very often chose different routes in winter compared to in summer. Of the pedestrians, 29.3% stated that they did not change their route in winter.
Table 1. Question asked: Do you choose to walk other routes in winter compared to in summer?
In general, women are more likely than men to choose alternative routes when walking in winter compared to summer. Those above age 60 are more likely than those below age 60 to choose alternative routes.
shows that the main reason pedestrians change their travel route is due to slipperiness owing to the presence of ice and snow. More than half (58.3%) of the respondents stated this as a reason for their choice. Many (37.5%) reported that another reason for changing travel route is that it is laborious to walk in snow. Uneven surfaces are the third most common reason for choosing alternative routes in winter conditions (10.1%). Older pedestrians are more likely than younger pedestrians to choose alternative routes because of slippery surfaces. Women are more likely than men to choose alternative routes for the same reason.
Table 2. Reported reasons pedestrians chose alternative routes in winter conditions. The respondents could select multiple reasons and add reasons not given as answer options
4.1.2 Bicyclists
We analyzed 736 bicycle survey respondents’ answers. The sample consisted of 486 men and 250 women; 622 respondents were in the 20–60 age group, and 113 were in the 60–90 age group. In the sample, 96.2% of bicyclists always or usually used studded tires when cycling during winter.
shows the number of people who chose to cycle on other routes in winter compared to in summer. As shown, 48.6 % stated that they sometimes or very often chose different routes in winter than they would in summer.
Table 3. Question asked: Do you choose to cycle other routes in winter compared to in summer?
Approximately one-third (36.8%) of the bicyclists stated that they never changed their route in winter compared to in summer. From , we see that the most stated reason for choosing an alternative route is that it is laborious to cycle in snow. Half (49.9%) of the bicyclists stated this. The second most common reason for choosing alternative routes is that uncertainty as to whether the routes were plowed and/or sanded (33.3%). The third most common reason is because of slippery surfaces (17.9%). Almost one-quarter of the female bicyclists changed routes due to slippery surfaces; 14.4% of the males in the sample exhibited the same behavior. Slipperiness due to ice and snow is the condition for which male and female bicyclists deviate the most in their answers. In general, bicyclists are more concerned than pedestrians about conflicts with other road users in winter, and 14.8 % of bicyclists change their travel route for this reason.
Table 4. Reported reasons for bicyclists to choose alternative routes in winter conditions. The respondents could select multiple reasons and add reasons not given as answer options
The respondents were also shown pictures of a snow-, slush-, and ice-covered road surface (see, ) and asked how often they chose another route when the conditions were as shown in the pictures.
Table 5. Question asked: How often do you choose an alternative route when the surface conditions are as shown in the pictures?
shows a clear difference between pedestrians’ and bicyclists’ preferences. A loose snow layer on the pavement is the condition that deters bicyclists the most, while this is less so for pedestrians. On the other hand, a frozen layer of ice on the pavement is the condition that deters pedestrians the most, but for bicyclists, this is less problematic than the other surface conditions. The reason ice is less of a deterrent for bicyclists is most likely because almost all of them use studded tires during winter. Slush is more of a deterrent than loose snow for pedestrians and more of a deterrent than ice for bicyclists.
4.2 Experimental study
The regression models for pedestrians and bicyclists are presented in . Model 1 predicted pedestrians’ reduced usage of Side GsB, and hence, their increased use of side GsA – when the GsB surface was covered with snow and slush, as illustrated in , compared to when it was bare in the reference period. When the GsB surface was partly covered with ice, the model predicted no change in its usage. Age was found to influence side choice. The model predicted that those above approximately 60 years old would be more likely to choose GsB than those younger than age 60. The time of day also affects route choice in Model 1. There was reduced use of Side GsB at midday and during evening compared to morning. Model 2 shows that surface conditions do not affect bicyclists’ route choice. The only significant variable in Model 2 is the time of day when the observations were taken, with an association similar to that found for pedestrians.
Table 6. Binary logistic regression models. Predicting pedestrians’ (Model 1) and bicyclists’ (Model 2) Side GsB usage
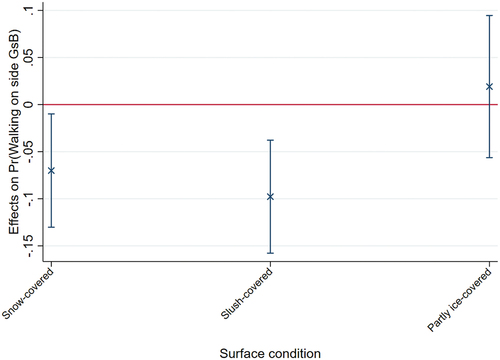
Since the regression models’ coefficients can be challenging to interpret, we converted the associations between surface conditions and pedestrians’ route choice to probabilities. shows the average marginal effects of the association between surface condition and the portion of pedestrians walking on Side GsB. It shows the change in probability as a function of surface conditions when everything else is held constant. We can see that when snow was present on the walkway, the model predicted a seven percentage point decrease (95% confidence interval [CI] between 13 and 1 percentage point(s)) in the portion that used it compared to the reference period when it was bare. Similarly, when slush was present on the walkway, the model predicted a ten percentage point decrease (95% CI between 16 and 4 percentage points). There was no change in the number of pedestrians that used Side GsB compared to the reference period when ice was present on the surface. All 95% CIs are quite broad, which means that the actual effect is uncertain. However, our analysis shows that snow and slush on the walkway are deterrent factors for some pedestrians, which increases the probability that an alternative route with a bare surface will be used. Further, due to overlapping CIs, shows that we cannot determine whether slush on the surface is more of a deterrent than dry snow.
Figure 3. Average marginal effects with a 95% CI. It shows the discrete change in the number of pedestrians walking on Side GsB for the different surface conditions, compared to the base level, that is, the reference period when Sides GsB and GsA both had a bare asphalt surface.
5. Discussion
In this paper, we set out to address the research questions outlined in Section 1.0. We wanted to investigate whether surface conditions affect pedestrians’ and bicyclists’ route choices during winter and whether a difference in winter maintenance service level affects their route choices.
5.1 Pedestrians
Our survey found that among the around 55% of pedestrians who stated that they sometimes or very often change route in winter, surface conditions were considered the most important reason for their choice. They stated the desire to avoid slippery surfaces in particular as their main motivation. Snow-covered surfaces that make walking laborious are also an important reason driving the decision to change route.
The association between surface conditions and pedestrian route choice was also supported by the choices the experiment revealed. The winter maintenance LOS does seem to matter when pedestrians choose where to walk; however, it should be noted that the effect sizes are quite small, despite their statistical significance. Even a small amount of snow and slush on the pavement caused a significant number of pedestrians to change their route. During the entire observation period, Side GsB was not exposed to any significant changes in surface conditions. The loose snow layer on the pavement was measured to be approximately 5 cm thick. This amount of snow should have a minimal practical effect; it merely causes a visible difference between the sides. The most surprising finding is that, given the significant change in route choice precipitated by the other surface conditions, partly ice-covered pavement was not associated with a significant change in route, even though this surface condition is arguably the most dangerous on which to walk and is also the reason pedestrians reported the most frequently in the survey, in general, to explain why they choose an alternative route.
One possible reason the ice condition did not lead to a route change is that when Side GsB was partly covered with ice, the visual difference between the two sides was minimal or non-existent compared to when Side GsB was covered with snow or slush. Thus, many pedestrians were likely deceived by the lack of visual difference and chose to walk on a surface that they did not prefer, even when a safe, more attractive option was available. This highlights the importance of correspondence between actual surface conditions and road users’ visual perceptions.
Higher age was found to be a good predictor of choosing Side GsB in the experiment. This finding is counterintuitive; that is, it is the opposite effect of what was expected. We would expect older people to be more sensitive to surface conditions and have a higher tendency to choose GsA. It could be that the 60+ group is the most sensitive to surface conditions but is also the group that has the lowest capacity to alter their route choice when they are outside because this will require more effort than it would for younger people. Hence, if one route has a substantially shorter travel time, it might be chosen regardless of the surface conditions. Based on the survey results, the > 60 segments stated they were somewhat more likely than the rest of the sample to choose alternative routes in winter compared to in summer. However, it is difficult to ascertain whether these route choice changes are pre-planned – that is, made before the trip – or if they are adaptations to the road environment the pedestrians encounter while walking outdoors during winter.
5.2 Bicyclists
Like pedestrians, bicyclists often choose alternative routes in winter compared to in summer. In the sample, 32.3% of the bicyclists stated that they sometimes choose alternative routes in winter, while 16.3% do so often. Approximately one-third stated that they do not choose different routes in winter than in summer.
In contrast to pedestrians, bicyclists are more concerned with loose snow and are less likely than pedestrians to change routes because of slippery surfaces. However, there is a gendered divide in the answers: In general, women are more concerned with slippery surfaces than men, which makes females more likely to choose an alternative route. The most probable reason icy pavement surfaces are not more of a deterrent for bicyclists is that almost all the bicyclists in the sample use studded tires when cycling during winter. Since loose snow is laborious to cycle through, many bicyclists avoid it when possible.
As the experimental results demonstrate, surface conditions did not affect which side bicyclists preferred. We have discussed the small variation in the surface conditions on Side GsB during the experimental observation period, which is probably one explanation for why it did not affect bicyclists’ route choice. It is likely that if the snow accumulations were higher, this would have manifested itself in bicyclists’ route choice as well. In one sense, we can say that we did not observe any critical threshold when surface conditions affected bicyclists’ route choice. Other concerns such as travel time, avoiding waiting at the crosswalks, and similar concerns most likely weighed more heavily than discomfort – if any – due to the presence of snow and ice on the pavement during this experiment.
Bicyclists are perhaps more affected by their trip origins and destinations than pedestrians. Owing to the speed difference between pedestrians and bicyclists, if the travel distance is the same, the waiting time to cross the roadway accounts for a higher percentage of overall travel time for a bicyclist than for a pedestrian. This increase in travel time suggests that the time penalty for crossing the road is felt more strongly among bicyclists than pedestrians. Hence, bicyclists prefer simple routes and want to travel in straight directions (Zimmermann et al., Citation2017). Stinson and Bhat (Citation2003) found that bicyclists tend to avoid traffic lights when choosing their travel routes. Considering these factors, it is plausible that if a bicyclist starts on the GsB side, the threshold to change to Side GsA would be high.
Another potential reason surface conditions did not seem to affect route choice is that bicyclists might have more conflicting considerations than pedestrians regarding what constitutes a good pavement surface. For instance, some bicyclists might avoid salted cycleways because salt leads to bike corrosion, which would incline these people toward GsB. Other bicyclists might feel safer when the asphalt is visible, which would incline them toward GsA. Unfortunately, the survey did not include a category for bicyclists who choose different travel routes in winter compared to in summer due to salt on the pavement. However, other parts of the survey suggest that the cycling community is divided in their opinion on salt usage (Johansson & Bjørnskau, Citation2020b). This issue needs further investigation and should be a topic for future research.
5.3 General remarks
As the survey results demonstrate, many pedestrians and bicyclists alter their route choices in winter compared to their preferred route in summer. The association between surface conditions and route choice is substantial. In general, bicyclists state that they want to avoid pavement with a build-up of loose snow because it is laborious to cycle through it, while pedestrians want to avoid surfaces that are slippery due to the presence of ice and snow. The experiment revealed that a small amount of snow and slush on a surface is associated with decreased pedestrian use if an alternative bare surface route is available. The same association between winter maintenance LOS and bicyclists’ route choices was not found. Plausible reasons for this have been discussed.
It should be noted that the results presented in are somewhat different from those Johansson and Bjørnskau (Citation2020a, Citation2020b) reported. This difference is most prevalent for bicyclists changing routes after encountering ice-covered surfaces. The aforementioned authors reported that 36% of bicyclists change routes very often on ice-covered surfaces, while we report that 20% do this very often. Furthermore, those authors used the entire dataset in their report, while we selected only those cyclists who were very familiar with cycling in winter conditions and lived in areas where the climatic conditions favor snow and ice. This difference indicates that ice is less problematic for experienced winter cyclists than for cyclists who are less experienced with winter cycling.
5.4 Further research
How long of a detour is the average pedestrian or bicyclist willing to walk or cycle to access surfaces that are perceived as more attractive? Unfortunately, the present study cannot answer this question. However, some alternative methods can be used. One could track pedestrians using a global positioning system (GPS), similar to Hulleberg et al.’s (Citation2018) study of bicycle trips in Oslo. One challenge with this approach is that winter surface conditions cannot be assumed to be stable; they can change drastically from day to day and from hour to hour. Therefore, continuous monitoring of road conditions is necessary if this method is used. How long a detour a person is willing to make is most likely correlated with the relative difference between road conditions on the route currently in use versus on the alternative route(s). Monitoring the road conditions in an analysis network can be both costly and challenging to manage in practice. Another approach is to find answers through stated preference surveys. However, as this study shows regarding willingness to change route on icy road surfaces, there might be a mismatch between stated and actual behavior. A third and perhaps the most promising approach is to use drone technology to study actual route choices. Multiple alternative routes can be studied simultaneously by obtaining a bird’s-eye perspective of the area of interest. This will enable the researcher to visually ascertain which part of the road is being used, a task that is challenging to manage through GPS data. Surface conditions can also be determined visually, to some extent.
The literature suggests that both pedestrians and bicyclists prefer routes that require less ascent (Broach & Dill, Citation2015; Broach et al., Citation2012; Hulleberg et al., Citation2018; Sevtsuk et al., Citation2021). Slippery surface conditions are most likely more problematic for both pedestrians and cyclists if the walkways and cycleways are steep than if they are flat. It is reasonable to assume that inclement surface conditions work as an additional deterrent on steep slopes, both when moving upwards or downwards. This hypothesis was not tested in the current study since the experimental study was conducted on flat ground, and the topic was not included in the surveys. Since this has implications for the planning of winter maintenance efforts and priorities, future research should investigate this further.
5.5 Implications
From a winter operation and maintenance perspective, we can ask, what is the most important measure to implement in order to make walking and cycling during winter more attractive? Eliminating winter conditions is, of course, impossible in practice. If only one measure was to be implemented, the results of the surveys suggest that the main focus directed toward pedestrians should be to mitigate slipperiness. On the other hand, for experienced winter cyclists, snow clearance resulting in even surfaces is an essential measure.
The experimental results suggest that a small but significant number of pedestrians alter their route choices owing to wintertime surface conditions, even when the amount of snow or slush is minimal. The results also highlight the importance of correspondence between actual surface conditions and pedestrians’ visual perceptions. When examining bicyclists, the results were ambiguous. It is unclear whether a bare pavement LOS is more favorable than a winter pavement LOS, given that the surface is kept compact and even.
Acknowledgments
This study was supported by the Norwegian Public Road Administration. We thank the Institute of Transport Economics for conducting the survey. We also thank the anonymous reviewers for their constructive and valuable comments.
Disclosure statement
No potential conflict of interest was reported by the author(s).
Data availability statement
Some or all data, models, and/or codes that support the findings of this study are available from the corresponding author upon reasonable request.
Additional information
Funding
References
- The Norwegian Public Roads Administration. (2019). Hvor mye salt brukes i Norge? https://www.vegvesen.no/fag/veg-og-gate/vinterdrift/salting/sporsmal-og-svar/hvor-mye-salt/
- Aasvik, O., & Bjørnskau, T. (2021). Cyclists’ Perception of Maintenance and Operation of Cycling Infrastructure – Results From a Norwegian Survey. Frontiers in Psychology, 12, 696317. https://doi.org/10.3389/fpsyg.2021.696317.
- Backer-Grøndahl, A., Amundsen, A., Fyhri, A., & Ulleberg, P. (2007). Trygt eller truende?: Opplevelse av risiko på reisen, report 913. Institute of Transport Economics.
- Bergström, A., & Magnusson, R. (2003). Potential of transferring car trips to bicycle during winter. Transportation Research Part A: Policy and Practice, 37(8), 649–666. https://doi.org/10.1016/S0965-8564(03)00012-0
- Broach, J., & Dill, J. (2015). Pedestrian route choice model estimated from revealed preference GPS data. Transportation Research Board, Washington, D.C., 94th Annual Meeting. In https://trid.trb.org/view.aspx?id=1338221
- Broach, J., Dill, J., & Gliebe, J. (2012). Where do cyclists ride? A route choice model developed with revealed preference GPS data. Transportation Research Part A: Policy and Practice, 46(10), 1730–1740. https://doi.org/10.1016/j.tra.2012.07.005
- Corazza, M. V., Di Mascio, P., & Moretti, L. (2016). Managing sidewalk pavement maintenance: A case study to increase pedestrian safety. Journal of Traffic and Transportation Engineering (English Edition), 3(3), 203–214. https://doi.org/10.1016/j.jtte.2016.04.001
- Flynn, B. S., Dana, G. S., Sears, J., & Aultman-Hall, L. (2012). Weather factor impacts on commuting to work by bicycle. Preventive Medicine, 54(2), 122–124. https://doi.org/10.1016/j.ypmed.2011.11.002
- Hulleberg, N., Flügel, S., & Ævarsson, G. (2018). Bedre sykkelveier fører til sykling av lange omveier.Samferdsel. https://samferdsel.toi.no/forskning/bedre-sykkelveier-forer-til-sykling-av-lange-omveier-article34053-2205.html
- Johansson, O., & Bjørnskau, T. (2020a). Pedestrians’ perceptions of operation and maintenance – Results from a survey in nine Norwegian cities, report 1768. Institute of Transport Economics.
- Johansson, O., & Bjørnskau, T. (2020b). Cyclists’ perceptions of operation and maintenance – Results from a survey in nine urban areas, report 1758. Institute of Transport Economics.
- Marisamynathan, S., & Vedagiri, P. (2014). Study on pedestrian crossing behavior at signalized intersections. Journal of Traffic and Transportation Engineering (English Edition), 1(2), 103–110. https://doi.org/10.1061/9780784413623.252
- Menghini, G., Carrasco, N., Schüssler, N., & Axhausen, K. W. (2010). Route choice of cyclists in Zurich. Transportation Research Part A: Policy and Practice, 44(9), 754–765. https://doi.org/10.1016/j.tra.2010.07.008
- Muraleetharan, T., Meguro, K., Adachi, T., Hagiwara, T., & Kagaya, S. I. (2005). Influence of winter road conditions and signal delay on pedestrian route choice in Japan’s snowiest metropolis. Transportation Research Record, 1939(1), 145–153. https://doi.org/10.1177/0361198105193900117
- Niska, A., & Blomqvist, G. (2016). Sopsaltning av cykelvägar: Utvärdering av försök i Stockholm vintern 2013/2014, VTI report 29-2015. Statens väg- och transportforskningsinstitut, Linköping.
- Niska, A., & Blomqvist, G. (2019). Sopsaltning av cykelvägar i teori och praktik: Erfarenheter från utvärderingar i svenska kommuner, VTI report 1005. Statens väg- och transportforskningsinstitut, Linköping.
- Niska, A., Eriksson, J., & Taavo, E. (2019). Sopsaltningens effekt på cykeltrafiken: En analys av cykelflöden och olyckor i Stockholm, VTI report 1012. Statens väg- och transportforskningsinstitut, Linköping.
- Øvstedal, L., & Ryeng, E. (2002). Understanding pedestrian comfort in European cities: How to improve walking conditions. In European Transport Conference, 9-11 September, 2002. Cambridge, UK. .
- Ren, G., Zhou, Z., Wang, W., Zhang, Y., & Wang, W. (2011). Crossing behaviors of pedestrians at signalized intersections: Observational study and survey in China. Transportation Research Record, 2264(1), 65–73. https://doi.org/10.3141/2264-08
- Sakshaug, L., Lindström-Olsson, A.-L., Lundqvist, C., Graemer, S., Arvidsson, A., & Og Gudrun, Ö. (2013). Fotgängares fallolyckor. Tyréns AB, Alingsås.
- Sener, I. N., Eluru, N., & Bhat, C. R. (2009). An analysis of bicycle route choice preferences in Texas, US. Transportation, 36(5), 511–539. https://doi.org/10.1007/s11116-009-9201-4
- Seneviratne, P. N., & Morrall, J. F. (1985). Analysis of factors affecting the choice of route of pedestrians. Transportation Planning and Technology, 10(2), 147–159. https://doi.org/10.1080/03081068508717309
- Sevtsuk, A., Basu, R., Li, X., & Kalvo, R. (2021). A big data approach to understanding pedestrian route choice preferences: Evidence from San Francisco. Travel Behaviour and Society, 25 (2021), 41–51. https://doi.org/10.1016/j.tbs.2021.05.010
- Stinson, M. A., & Bhat, C. R. (2003). An Analysis of Commuter Bicyclist Route Choice Using Stated Preference Survey. Transportation Research Board).
- Verlander, N. Q., & Heydecker, B. G. (1997). Pedestrian route choice: An empirical study. PTRC Education and Research Services, Ltd.
- Wardman, M., Tight, M., & Page, M. (2007). Factors influencing the propensity to cycle to work. Transportation Research Part A: Policy and Practice, 41(4), 339–350. https://doi.org/10.1016/j.tra.2006.09.011
- Winters, M., Davidson, G., Kao, D., & Teschke, K. (2011). Motivators and deterrents of bicycling: Comparing influences on decisions to ride. Transportation, 38(1), 153–168. https://doi.org/10.1007/s11116-010-9284-y
- Zimmermann, M., Mai, T., & Frejinger, E. (2017). Bike route choice modeling using GPS data without choice sets of paths. Transportation Research Part C: Emerging Technologies, 75 (2017), 183–196. https://doi.org/10.1016/j.trc.2016.12.009