
 ?Mathematical formulae have been encoded as MathML and are displayed in this HTML version using MathJax in order to improve their display. Uncheck the box to turn MathJax off. This feature requires Javascript. Click on a formula to zoom.
ABSTRACT
The socio-economic characteristics of individual and group have been found to significantly have an impact on their mobility and travel behaviour. Hence, this study examined the influence of socio-economic characteristics of households in the Rural areas of Nigeria on trip making. The study adopted the multi-stage sampling technique method where 12, 365 registered buildings were systematically selected out of a total of 28,341 buildings. Systematic sampling technique was used to survey 4 percent of households, representing 495 household heads of a total 12,365 registered buildings by means of questionnaire administration. The study revealed that majority of the respondents were between the age of 60–69 years and utilized the non-motorized (walk & bicycle) means of transport. The result of the multiple regression analysis further revealed that Age and Income were the significant socio-economic variables influencing trip making of households. This study thus advocates the influence of demographic attributes on households’ travel behaviour. Therefore, rural communities should be given equal privilege as urban areas when formulating transport policies as a result of their unique and distinct socio-economic attributes.
Introduction
Transport is very pivotal to people’s daily activities, without which their mobility will be impaired. According to Madhuwanthi et al. (Citation2016), the movement of people is closely related to their socio-demographic characteristics, such as gender, age, marital status, occupation, education level, as well as the activities of the family members. The study further opined that activities are based on different purposes: working activities, educational activities, shopping, recreational activities, etc. Based on this, Travel behaviour research studies the physical movement (trip making) of persons outside their reference locations for any purpose. Lawrence and Enegeike (Citation2000) defined travel behaviour as a study of what people do over space and how they use transport. Hence, travel behaviour encompasses trip generation, mode choice, among other transport-related activities carried out in space. Among the four-step transport forecasting models, trip generation being one of the activities that defines an individual travel behaviour, is usually the first step utilised to predict future travel demands. The number of trips originating at or destined for a particular Traffic Analysis Zone (TAZ) is predicted in this process. The importance of trip generation lies in its capability to estimate the volume of trips made by individuals to work, shopping, school, and so forth, but not the flows between points within the whole system. Studies by Fei and Zhu (Citation2019) and Cubucku (Citation2001) asserted that travel behaviour is a function of the following fundamental factors: the socio-economic characteristics of the trip makers and the land-use pattern and developments in the study area (physical characteristics of the area). Socio-economic status is an economic and sociological factor that combines the total measure of a person’s work experience as well as an individual’s or family’s economic and social position based on income, level of education, and occupation (Marmot, Citation2004).
Lareau (Citation2003) observed that socio-economic status is typically broken into three categories: high, middle, and low. It was established that a family or an individual may fall into one of these categories, and factors such as income, education, and occupation are the significant determinants of the category they are placed. For instance, variation exist in the socio-economic characteristics of households in the urban and rural areas, these differences are seen in the age, income and occupation thus impacting their travel pattern. Oyeleye et al. (Citation2013) asserted that the population of old people (elderly) in the rural area is usually more than the urban areas. They attributed this to the migration of younger adults to urban areas in search of work, higher education, apprenticeship to a trade or other engagements for survival. Matalon (Citation1992) further confirmed that, the travel behaviour of individuals is not uniform, and he attributed this to differences in socio-economic characteristics such as gender, age to mention just a few. Additionally, low income and little education have shown to be strong predictors of a range of physical and mental health problems due to environmental conditions where individuals find themselves. This is no different from the experience of the rural dwellers as described by Anele (Citation2012), who opined that the condition of living in the rural area is mentally and physically degrading due to their rustic and inhuman lifestyle.
Historically, rural areas are small size with low population; relatively isolated as a result of inadequate infrastructures and development, where the dominant economic activity was agricultural production, and where the people were relatively homogenous in their values, attitudes and behaviour (Oyeleye et al., Citation2013). Rural inhabitants unlike their counterparts in the urban areas, often lack access and mobility to work, health, education, shopping, religious, cultural, and social activities. This often prevent them from carrying out their daily activities with ease as majority of them either walk or cycle, which are often perceived as daily burdens. Despite this, rural dweller constitute a large portion of developing countries’ populations and they have often been neglected in national transportation infrastructure and service development. To address citizen equality and equity, there is a need to address the travel behaviour of rural households in order to formulate policies that better addresses their mobility and also form an inclusive national development (Ali, Citation2001).
From the studies above, it can be posited that an area’s socio-economic and physical characteristics play a significant role in an individual’s and household’s travel behaviours, and it has been succinctly observed that: there is a realization that a dangerous gap exists in the development levels of both urban and rural areas. This seems to be threatening the political and social stability of the nation. Hence, this paper investigates the impact of socio-economic characteristics on the travel behaviour of households in the rural areas of Nigeria, communities perceived to be disadvantaged/ marginalized. It is believed that this study will provide an insight on the demographic attributes of households in the rural areas and their influence on their travel behavior. This will assist in making policy reforms that will enable their upward mobility thus improving their quality of life and enabling sustainable transport planning and development.
Literature review
Travel behavior is the study of what people do over space and how they use transport (Lawrence & Enegeike, Citation2000). Generally, it has been found that the socio-economic characteristics of households, level of transport infrastructure development, religion, culture, government policy, city structure, and location of households within a city affect travel behaviour (Pucher & Renne, Citation2005; Fujiwara et al., Citation2005). Land use pattern has been found to play important role in deciding the travel plans of the commuters, and city pattern/location determines its trip length and mode use, which invariably affects the travel behaviour of its inhabitants. The land use (residential, commercial, industrial, recreational) affect the choices of the people greatly. Sharma (Citation2020) further posited that socio demographic factors such as age, gender, income, etc., play a significant role in the determination of the trip planning, or choosing their mode of travel, their decisions of work, decisions of ownership of properties/vehicles or rentals, etc., in the study, it was discovered that overall explanatory factors for determining travel behaviour can be broadly categorized as: socio-economic and demographic characteristics, spatial development patterns, policies directly or indirectly affecting travel behaviour, as well as national cultures or individual preferences. Socio economic factors are more critical to analyse to determine any kind of relationships on travel patterns. Socioeconomic characteristics consists of age, income, household size, and car ownership, and socio-economic factors such as age, gender, ethnicity is included in travel because of its direct influence on travel behaviour. It is also pivotal to note that the better the land use planning is, for example, if it is designed in a compact manner, that all the amenities are in easy distances, then, research shows that, there is a greater possibility of using more sustainable forms of transport such as walking or cycling. Ryley (Citation2005) asserted that key stages within the household life cycle that impact travel behaviours include gaining employment, having children, and retirement; thus, households consisting of students and the unemployed are most likely to use non-motorized forms of transport. Conversely, families consisting of retirees and high-income earners are least likely to use non-motorized forms of transportation. O. Fadare and Alade (Citation2009) asserted that the higher the income, the higher the number of vehicles per household. This could significantly impact trip-making, as many people prefer to embark on journey when there is the availability of cars. The study further asserted that income and car ownership variables are significant in both the medium and low-density areas, thus expressing the status structure of people. It can be implied that trip making is a function of people’s socio-economic characteristics, location, and travel characteristics (travel time, distance, cost, and mode). These factors determine households’ trip-making behaviour, thus, causing varying travel behaviour.
Transport situation and travel behaviour in the rural areas of Nigeria
The word ‘rural’ connotes different meanings to different people, depending on their background; what is regarded in developed countries as rural may be considered as urban in developing countries. Laah et al. (Citation2013) noted that there is no exact definition of the term. Despite this, rural areas are ‘recognizable’, which implies that the physical attribute of an environment could indicate whether it is either rural or urban. The rural area constitutes the space where human settlement and infrastructure occupy only small landscape patches, dominated mainly by fields and pastures, woods and forest, water, mountain, and desert.
Given certain criteria, rural settlements in Nigeria are regarded as settlements with less than 20,000 people and predominantly engage in primary activities (Aderamo & Magaji, Citation2010). According to Akinola (Citation2007), the condition of rural areas of Nigeria is more pathetic since they are highly deprived of infrastructural facilities, especially when compared to the urban areas. Similarly, Adesanya (Citation1997) reported that only about 5 percent of rural roads in Nigeria are in good condition. From the study, it was discovered that the bad condition of these rural roads is compounded by the poor response to repairs and delays in rehabilitation by the government. According to Starkey et al. (Citation2002), rural road transport system consists of transport infrastructure, transport operations (services) and the transport users. Rural transport operations include the commercial services and those provided by private vehicles. Therefore, for any transport system to function effectively, there must exist the appropriate infrastructure, transport services, maintenance, and traffic management. The infrastructure includes the road network, tracks, paths and bridges and public transport system (Asian Development Bank, Citation2007). The travel behaviour of rural dwellers as described by scholars (Oyeleye et al. (Citation2013); Starkey et al. (Citation2002); Pucher & Renne, Citation2005) revealed that majority of households especially the elderly made fewer number of trips compared to those in the urban areas. Likewise, the use of non-motorized transport such as walking, and cycling is predominant with rural households. This was attributed to the poor condition of road networks in the area thus making it difficult to access public transport as a result of high transport cost for the available public transport.
Sustainable rural transport planning
According to United Nations Economic and Social Commission for Asia and the Pacific (UNESCAP, Citation2015), one of the main goals of sustainable transport is a system that integrates an international, integrated, intermodal transport, and logistic system irrespective of an individual’s status and location. This system is believed to incorporate factors such as economic, social and environmental in policy formulation and design. The economic factors consider the following: cost, speed, capacity, reliability, and flexibility while the social consist of Accessibility, Minimum accident and Congestion. Likewise, the environmental factors include Energy Intensity, emission, and pollution. From this, it can be said that policy formulation aimed at encouraging accessibility, reliability flexibility of transportation system whether in rural or urban areas should be given utmost attention. However, this is not the case in the rural areas as majority of them do not have access to basic amenities because of poor transportation system. This is seen in the poor road networks and poor public transport system. According to the World Bank (Citation2015), adequate transport infrastructures is unavailable for the world’s poorest and most vulnerable people, thus, making transportation one of their major challenges, because, affordable transport solutions are key for the poor to access opportunities and generate savings. A report by Veryard and Perkins (Citation2018) in the International Transport Forum (ITF) and Organisation for Economic Coperation and Development discussion stated that the adoption of non-motorized travel such as cycling to reduce over dependence and reliance on the road, as well as provision of an environment that supports same is one of the major ways of promoting sustainable transportation. Hence, there is a need to support the rural dwellers through the provision of adequate transport infrastructures, provision of affordable, convenient, and reliable public transport and provision of an environment that supports the use of non-motorized transport. To support and promote rural transport, there should be mobility choices that are accessible, equitable, affordable, and non-discriminatory.
Theoretical reviews
The theoretical link between transport and location is explained in this study from the perspective of three theories: Spatial Mismatch Theory, Social Exclusion Theory, and Social Justice Theory.
Spatial mismatch theory explores the relationship between transport and poverty from a geographical perspective. It was developed primarily in North America in 1960 by John F. Kain and it explains the relationship between location, accessibility, and poverty. The theory is mainly concerned with spatial barriers poorer people face to access jobs/services in the context of suburbanization and high car dependency (Jocoy & Del Calsino, Citation2010). As explained by the theory, cheaper, more affordable housing tend to be in areas with poor transport connectivity and poor service provision, thus, it becomes increasingly difficult for those on lower income and without a car to access jobs and quality services, thus, negatively impacting their quality of life. This can be likened to the situation in the rural areas, where majority of household are low-income earners who may not be able to afford the cost of living in urban areas with quality services in terms of transport and housing, thus, settling in environments with poorer transport connectivity which disconnects them from accessing good and quality services and transport infrastructures which may impact their wellbeing negatively. Hence location of an individual can be linked to its status in terms of its socio-economic characteristics such as income, level of education, occupation among others and these factors impacts one’s travel behaviour. Overall, this theory explains the relationship betweeen the locational pattern of people and their socio-economic status. It lays emphasis on the reason the poor resides in areas where there are poor services due to their inability to afford the luxury of urban living.
Social exclusion theory: This examines relationships between transport and poverty and contrary to the spatial mismatch theory; social exclusion literature focuses more on the consequences of transport deprivation than on the processes leading to it. The spatial mismatch theory is the process leading to the consequences being explained by the social exclusion theory. Mainly a theory from the social sciences, it is based on a term first developed in France by Red Lenoir in the early 1970s, which refers to the loss of the ability to connect with the services and facilities needed to fully participate in society. It explains the consequences or the impacts of poor transport facilities on the poor, who live in locations with poor transport connectivity; they become disadvantaged because of their socio-economic conditions and their location. Research on transport builds up on this general conceptualization to define transport-related social exclusion as the “process by which people are prevented from participating in the economic, political and social life of the community because of reduced accessibility to opportunities, services and social networks. This is typical of the experience in rural areas and Akure North Local Government Area dwellers may not escape these consequences as majority of them are deprived of accessibility to good transport infrastructures to enhance their mobility. The resultant effect can be seen in longer travel time and distance because majority of these rural dwellers utilized the non-motorized transport such as walking and cycling.
Social justice theory: This approach was developed by John Rawls; author of the seminal in the 1970s. Rawls’s thought centered on idea of fair distribution and equality of opportunity. It examines transport-related disadvantages and their relation to poverty from a perspective of inequality. This approach relates mainly to the underlying idea of equality of access, and thus, suggests that policies should focus on offering the greatest benefit to the least advantaged members of society (Fraser, Citation1998; Harvey, Citation1997). This approach allows equality in the distribution of infrastructures and facilities to the disadvantaged communities and populations to enhance their mobility. This is particularly relevant to those living in poor transport connectivity environment like the rural areas.
Conceptual framework
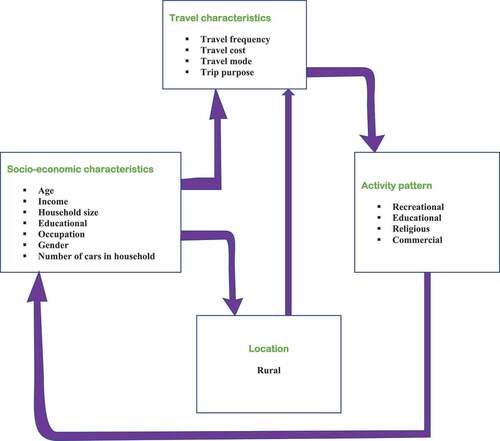
This conceptual framework explains the relationship which exist between location, demographic attributes and travel behaviour of people. As seen in , there is a relationship between one’s socio-economic characteristics, location and travel characteristics. The socio-economic attributes of an individual or household in terms of age, income, education among others may influence the location and trip making behaviour (O. Fadare & Alade, Citation2009). For instance, it has been widely researched that the elderly (aged) with low level of income, education among others tend to reside in the rural areas, while the educated young adult with average or high income reside in the urban centres. This also influences the travel characteristics interms of trip generation, transport mode among others. The Aged have been known to generate fewer trips compared to other age cohorts, likewise the state of transport infrastructure in the rural areas is poor compared to the urban centres, hence residents in the rural areas rely more on the use of non-motorized transport. Likewise, the activity pattern of people, travel characteristics and location also influence or have a relationship with one another. The activity of an individual determines the trip generation pattern, travel cost, and transport mode, which is also dependent on the location (urban/rural). This can be likened to the spatial mismatch theory which stipulates that lower-income people tend to reside in areas with cheaper, affordable housing with poor transportation connectivity, thus, reflects the impact of one’s socio-economic attributes in determining the location, which impacts on the trip making behaviour.
Figure 1. Relationship between socio-economic characteristics, locational pattern, and travel pattern.
Study area and methodology
Akure North Local Government came into existence on 1 October 1996 when it was carved out of the defunct Akure Local Government. It is located at the border area of Ondo and Ekiti States with Ikere Ekiti as its immediate neighbor. It is also bordered in the south by Idanre Local Government, in the east by Akure South Local Government while in the west with Owo local government area. The local government is blessed with fertile land, good for agriculture, thus, making farming the major occupation of the people. This typically depicts the area as rural as majority of the populace engage in agricultural activities. Information from the National Population Commission in the 2006 national housing and building census revealed that there are 130,765 people in the local government with males amounting to 66,526 and females 64,329. It will be noted that the local government is one of the least populated town in Ondo State, this is due to some of the rural attributes such as inadequate infrastructural development and poor road condition thus making it difficult for people to settle.
Methodology
Survey design
This study relied on primary data collected on socio-economic characteristics and travel characteristics of household.
Selection of respondents for sampling
The multi-stage procedure was adopted and a combination of both qualitative and quantitative data were utilized for the study. The primary data were obtained through reconnaissance survey and the administration of questionnaire.
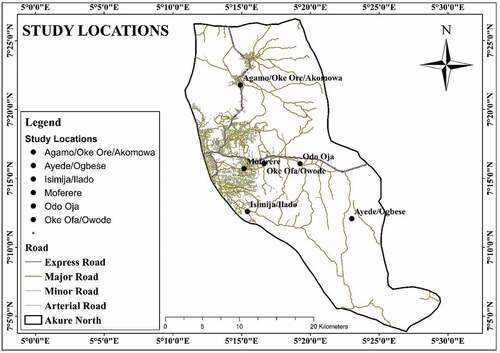
The first stage involved the stratification of residential areas in the study area into political wards, Information from the stratification of the area revealed that there are a total of 12 political wards in the study area. In total, 50% of the wards was randomly selected. Using this method, a total of six political wards was selected for sampling. The selected wards as seen in included Ayede/Ogbese, Agamo Oke Ore/Akomowa, Isimija/Ilado, OdoOja/Ijigbo,Oke Ofa/Owode, and Moferere.
Figure 2. Study locations.
In the second stage, buildings in the selected political wards were identified and this ranged from semidetached houses, hut structures made of traditional materials, among others. Information from the National population commission revealed a total of 28,341 buildings in the local government. However, there are a total of 12,365 buildings in the selected wards and 4% of the buildings was selected for questionnaire administration. The number of questionnaires administered in each settlement was based on a sample size of 4 percent of the listed households and the use of 4% sample size in this study is not new. For example, Olawole (Citation2013), in a study of rural mobile phone usage and travel behaviour in Nigeria, suggested a maximum of 10% sample of rural household heads on studies involving rural residents.
Sample size
The third and last stage involved the selection of respondents for questionnaire administration. In selecting the respondents, a systematic random sampling technique was adopted and the questionnaire was administered on an adult not below the age of 18 years on each floor of the selected buildings. 1 out of every 25th building was systematically selected, representing 4% of the total building. Using this procedure, a total of 495 respondents were surveyed.
K = N/n … … … … … … … … … … i
Where, K = sample size
N = Number of registered building/dwelling unit/household
n = represents 4% of all household per settlement.
The questionnaire designed for the research had three main sections. Section 1 comprised information relating to socio-economic characteristics of the respondents. They included gender, age, education, income, marital status, employment status, occupation, and car ownership. Section 2 focussed on the travel characteristics of the people, information such as trip frequency (average number of daily round trip), trip purpose, travel time, transport mode and travel cost were acquired. The last section provided answers to factors influencing the trip making of the respondents.
Data analaysis
The methods of the data analysis included simple descriptive statistics such as percentages and frequencies. Inferential statistics, such as multiple regression analysis, was employed as appropriate in the study. The data was analyzed using the Statistical Package for Social Scientist (SPSS) and a regression model was adopted for identifying the socio-economic variables influencing the trip making of respondents in the study area. It was used to generate a model as identified by (Ogunsanya, Citation2002).
Where Y represents the dependent variable. The dependent variables, in this case, represent
Y = average Trips.
x1,x2,x3… . ….xn represent the independent variables
a, b are constants
e is the error term
we employed a total of 7 predictors/independent variables (socio-economic characteristics) listed below; Age, Income of respondents, Gender, Education, Occupation, Household size and number of cars in the household. The stepwise regression analysis was employed for this study, this regression analysis was adopted due to its strength at removing insignificant variables, thus retaining only the significant ones during the data analysis. The variables which were employed in this study is presented and explained in .
Table 1. Variable description
Results
Many researchers (Giuliano, Citation2003; Newbold et al., Citation2005 & Fadare & Alade, Citation2010), studied the impact of socio-demographic variables on travel behaviour and found some significant relationships between travel behaviour and variables such as age, gender, household composition, income, among others. In view of this, it is pertinent to examine the socio-economic characteristics of respondents in the study area.
Socio-economic characteristics of household
The socioeconomic characteristics of respondents is presented in . As presented in the the table, the age distribution of respondents in the study area revealed that participants between the ages of 60–69 accounted for the largest (43.7%) proportion of the respondents. Next to this category were those below 30 years, with 20.8% of the population, while those between the ages of 30–39, 40–49, and 50–59 were 14.0%, 13.5%, and 8.0%, respectively. Furthermore, information on the household size of respondents revealed that households with 6–9 persons accounted for the largest (75.4%) proportion. This can be said to be an average size household compared to households with less than six persons who are relatively small with 20.4% of the total population. Information on the educational level of households showed that those with secondary education accounted for the largest percentage of the respondents with 54.4%, while those with tertiary education were next with 33.9%. 5.9% and 5.2% of the respondents had no formal education and primary education, respectively. In addition to this, a further investigation into the educational status revealed that residents had spent a different number of years pursuing formal education (tertiary/post-secondary education). This analysis is necessary to authenticate the formal education qualification claimed by residents in the town. The study revealed that 49% had spent not more than two years pursuing tertiary education; this implies that most of the respondents had a national diploma or technical education. This is followed by 30.1% of the respondents who had spent 3–5 years pursuing tertiary education, either a university education or a higher national diploma degree. Further results on the socio-economic characteristics of households were explained by their occupation, a higher proportion of the household heads (40.3%) engaged in farming. This could be related to the level of education as contained in the respondents’ information, where most of them had secondary education and relationship has been found to exist between one’s level of education and occupation (O. Fadare & Alade, Citation2009). Next to this category are the artisans and businessmen/women, being 18.5% and 14.9% of the respondent’s population. It was, however, noted from the study that only 10.9% of the household heads were civil/public servants (Government workers).
Table 2. Socio-economic characteristics of respondents
The income of residents is another important variable in the explanation of travel behaviour. To present this, the income group for federal tax rating was adopted to illustrate the income distribution of respondents; and it was discovered, in the study, that 34.8% of the respondents earned below N 20,000 (approved minimum wage), thus, constituting the most significant percentage in the income-earning rate of the respondents. Next to this are those who made between N 40,000- N 59,999, being 21.5% of the population. Only 5.9% of the respondents earned above N 100,000. It can be inferred from the study that the income-earning rate of respondents is low as majority earn below the minimum income adopted by the federal tax rating. The mean income for the study is N 35,215.9, while the minimum and maximum incomes are N 1,000 and N 120,000, respectively.
The result on car ownership of household that was undertaken showed that about half (49.6%) of the respondents in the rural area did not own a car; this could be a reflection of the income level, as seen in the information on the income distribution of household. Next to this are those with one car, which constituted 39.2% of the household. Then, 7.2%, 2.4%, and 0.8 of the respondents had two cars, three cars, four and five cars, respectively, in their households
Travel characteristics of respondents
Information on the travel characteristics of respondents is presented in . Analysis of respondent’s trip frequency, which is based on all round purpose trips, indicated that 71.9% of the respondents made, on average, one trip in a day which constitutes the largest in that category; this is closely followed by 22.9% of those who make two trips in a day. In summary, a larger percentage (94.8%) of the respondents make between 1–2 trips daily and the daily mean trip of household is 1.36. Findings from our study also established that 65.3% make more of work-related trips, which are non-discretionary trips. Examination of transport mode of respondents revealed that non-motorized mode of transport (walking/cycling) accounted for the largest proportion in this section with 43.2% of the total respondents in the study area. A total of 24.6% and 13.9% make use of public transport and private cars, respectively. The travel cost of household revealed that trip to school accounted for the largest amount as 43.3% averagely spend 4, 286 naira. The reason attributed to this is that respondents who are students do not attend schools within their districts, they claimed to travel outside their neighbourhood for educational purpose, and the reason for this was attributed to the quality of education within the neighbourhood. Next to this is trip to health facilities which accounted for about 2,743 naira contributing to 27.7% of the study population. The reason for this is not far-fetched from that of education. Respondents claimed to travel outside their neighbourhood to specialist hospitals in neighbouring towns such as Akure and Owo for quality health services. Trip to work cost 1,971 naira on average with about 19.9% of the respondents spending this amount, while trip to recreation had the least average amount of 900 naira and 9.1% of the respondents spending on this trip. This is because only a few of them make trips to recreational centres or facilities outside the neighbourhood and most of those who claimed to make work trips go by non-motorized transport (walk/cycling) since their primary activity is farming, which is oftentimes close to their homes.
Table 3. Travel characteristics of households
Influence of identified socio-economic indices on trip making of respondents in the rural area. The correlation summary resulting from a stepwise regression analysis as presented in the table below is an attempt to establish the relationship between the average number of trips and the socio-economic indices of respondents in the selected rural areas. Also, it shows the model multiple correlation coefficients, R, its coefficients of determination, R2, and an adjusted version of these coefficients as summary measures of model fit. The multiple correlation coefficient R = 0.394; predicts a positive correlation between trip making and the average monthly income of household heads. In contrast, model 2, with correlation coefficient R = 0.541, reflects a strong positive correlation between the average number of trips and the age of respondents. The fact that other independent variables such as gender, number of years spent in the pursuit of formal education, occupation, number of cars in the household, among others, were not captured by the outputs of the model indicates the strength of the stepwise regression at removing independent variables that were not significant at influencing the dependent variable (trip frequency).
The R2 values of 0.156 and 0.293 for models 1 and 2, respectively, indicate that the variables can explain 15.6% and 29.3% of the variance in the income of household heads and age of respondents at influencing the trip making of respondents in the rural areas. This implies that the combined influence of the two variables (age and income) accounts for 29.3% at influencing trip making of respondents in the rural areas. The value of the adjusted R square is a revised estimate, that 12.2% for model 1 and 23.4% for model 2 of the variance in the average trip making of respondents, can be explained by the influence of the income of household heads and the age of respondents.
In addition, the ANOVA result with F = 4.606 and 4.907 at P = 0.04 and 0.01 also concludes that there is a significant overall regression using all the variables in the model. The F result indicates that the R-Squared is not equal to zero, and the correlation between the model and the dependent variables used in the mode were significant.
The coefficient of the regression presented in provides the estimates of the regression coefficient, standard error of the estimates, t-tests that a coefficient takes the zero value. The estimated coefficients are given under the heading ‘Standardized (Beta) coefficients’; these explain the predicted change in the dependent variable when each explanatory variable is increased by one unit, conditional upon the fact that all other variables in the model remain constant.
Table 4. Multiple regression analysis of socio-economic characteristics and travel
For the model, the income of the household head and age of respondent were found to influence trip making with a standard coefficient of 0.379 and −0.371, significant at p < 0.05. This implies that for any additional increase by income of household, there will be a resultant increase in the trip frequency or number of trips generated. Conversely, the negative beta coefficient of −0.371 for age implies that a unit increase in the age of respondents will result to decrease in the household trip generation. The result of the regression model explains the implication of household income and age on trip generation rate of the households.
Therefore, the model equations for the analysis take; Model:
Thus
Discussion
The paper examined the impacts of the socio-economic characteristics of households at influencing travel behaviour. This study showed that households in the rural areas comprised more of the aged with an average household size of 6–9 people. Studies by World Bank (Citation2008); Badiora (Citation2012); Fadare and Oniya (Citation2013); Aderibigbe and Fadare (Citation2018) have also identified household with elderly people (60 years and above) to be predominant among the rural dwellers, thus, corroborating this study. Individual highest level of education attained to some degree determines one’s occupation and income level (Jayamala, Citation2008; Sanni et al., Citation2010). Findings from our study revealed that few of the household heads had tertiary education, and mostly engaged in farming activities. The finding on occupation of household is not surprising as Nwachukwu (Citation2016) asserted that farming is one of the dominant household activities in rural areas, thus, corroborating this finding. Income levels of respondents were also discovered to be low, as most of them earned below the approved and existing Federal Government minimum wage. While car ownership is seen as a form of the income level of individuals, and one of the socio-economic factors influencing travel behaviour, findings from this study generate similar result as only few household heads owned cars. The use of non-motorized travel (walk/cycling) for trip making was significant among respondents. The findings on car ownership rate of households in the study corroborates the findings of Goodman et al. (Citation2012) which asserted that cars were more affordable for the relatively affluent and more educated people in the society.
The travel characteristics of households showed fewer trip generation as more than half of the respondents made an average of just one single trip daily. The report of the Federal Highway Administration (Citation2019) also stated that rural dwellers make fewer trips than those in the urban centres. Travel is a derived demand, in that people do not travel for travel’s sake. Transportation occurs to facilitate community services, both socially and economically (Oyedepo & Makinde, Citation2009). The study asserted that each trip was made for a particular purpose and the information on trip purpose of respondents further established this fact. Majority of the households made more of non-discretionary trips with just few embarking on discretionary trips. The predominant use of the non-motorized transport (walking/cycling) reflects the socio-economic characteristics of the respondents. Starkey et al. (Citation2002) in a study of rural mobility, found the use of non-motorized transport as the dominant mode of transport for most rural dwellers; thus, this will call for need to develop a faster, reliable and convenient mode of transport, such as the public transport system to complement their active travel (walk/cycling) so as to improve their upward mobility and enhance their quality of life.
Overall, it has been discovered that rural areas, in both developed and developing countries of the world, exhibit similar traits in terms of age, occupation, trip frequency and transport mode use (World Bank, Citation2008; Popoola, Citation2011). The regression analysis showed the influence of two significant independent variables (income of household head and age) at influencing trip generation of household, thus, contradicting the findings of Popoola (Citation2011), and O. Fadare and Alade (Citation2009) who found the influence of other socio-economic variables such as gender, education as significant variables influencing households travel behaviour. The regression analysis further showed that an increase in income will increase trip generation for a household; conversely, a unit increase in age will lead to a resultant decrease in the trip generation pattern of individuals. Studies by Fadare and Oniya (Citation2013), and Aderibigbe and Fadare (Citation2018) found a similar result on the influence of age at reducing trip frequency of households. It is believed that as people grow older, there is every likelihood of reduction in movement, as ageing takes its toll on their health, thus, limiting their mobility.
Conclusion
The study concluded that households in rural areas have unique and distinct demographic attributes in terms of income level, education, and occupation type. Moreover, travel characteristics of rural dwellers show that fewer trips are generated and indicate the dominance of non-motorized transport (walk and bicycle) for most of their trips. It was established from the study that the socio-economic attributes of people have a significant influence on their travel behaviour. Thus, users’ socio-economic conditions and travel behaviour are vital for planning an effective and sustainable transportation system. Based on the above, the study proposed that priority should be given to the rural communities by stakeholders in the transport sector when making transport policies. As seen from the social justice approach on equality of opportunities and fairness, rural communities should be given equal privilege as urban areas when designing and formulating transport policies. Adequate considerations should be given to their socio-economic attributes; thus, designated transport facilities, such as provision of convenient, accessible, and affordable public transport should be provided at little or no cost to convey them to their respective designation or activities.
Another way of supporting and encouraging the use of non-motorized transport which is the dominant mode of transport in the rural areas is to provide an environment that supports active travel (walking/cycling). Based on this, sidewalks, bike lanes and pedestrian bridges, should be adequately considered and provided during urban design and land use planning. The approach of ‘Go for Green’, an environment that supports active travel should be encouraged by planting trees and preserving cultural heritage. This will not only influence their mobility pattern, but also improve healthy living.
Author’s Contributions
Conceptualization, O.A; methodology, O.A; validation, O.A. and T.G. formal analysis, O.A; investigation, O.A; resources, O.A and T.G.; data curation; O.A. writing—original draft preparation, O.A.; writing—review and editing, O.A and T.G.; visualization, O.A and T.G. supervision, T.G.; funding acquisition, T.G.
Acknowledgments
The authors wish to acknowledge the support of Management and staff of Akure North Local Government Authorities, National Population Commission, Ondo state, Ministry of Physical Planning and Urban Development, Federal University of Technology Akure, Ondo state Nigeria and University of Johannesburg South Africa, for providing relevant information and support for the successful completion of the work.
Disclosure statement
No potential conflict of interest was reported by the author(s).
Additional information
Funding
References
- Aderamo, A. J., & Magaji, S. A. (2010). Rural transportation and the distribution of public facilities in Nigeria: Case study of edu local government area of Kwara state. Journal of Human Ecology, 29(3), 171–179. https://doi.org/10.1080/09709274.2010.11906260
- Aderibigbe, O., & Fadare, S. O. (2018). Analysis of trip generation pattern of women in the different residential zones in Akure. Futa Journal of Management. And Technology, 3(1&2), 162–178.
- Adesanya, A. (1997). Transportation development. In A. O. Adedotun & S. J. Titilola (Eds.), Nigeria in 2010 (pp. 181–193). Nigerian Institute of Social and Economic Research (NISER).
- Akinola, S. R. (2007). Coping with infrastructural deprivation through collective action among rural people in Nigeria. Nordic Journal of African Studies, 16(1), 30–46.
- Ali, M. S. (2001). An accessibility-activity-based approach for rural travel demand in developing countries [Ph.D. thesis]. University of Birmingham, p. 272.
- Anele, D. A. (2012, January 29). Brief note on the condition of rural areas in Nigeria. Vanguard Sunday Perspectives. https://www.vanguardngr.com
- Asian Development Bank. (2007, January). Rural accessibility in the Asia and pacific region (ADB transport strategy final report). IT Transport Limited
- Badiora, O. (2012). Spatial pattern of crime and deliquency in ile-ife. An M.Sc thesis submitted to the department of urban and regional planning ile ife.
- Cubukcu, K. M. (2001). factors affecting shopping trip generation rates in metropolitan areas. Studies in Regional and Urban Planning, 9, 51–67. www.researchgate.net/publications
- Fadare, O., & Alade, W. (2009). Intra urban variation of household’s trip generation in Lagos metropolis. Journal of Nigeria Institute of Town Planners, 12(1), 78–87.
- Fadare, S. O., & Alade, W. (2010). Aging and households’ travel pattern: implications for wellness of the aged in lagos. Nigeria Lagos Journal of Environmental Studies, 7(2), 84–90.
- Fadare, S. O., & Oniya, O. B. (2013). Travel behaviour of the aged in akure south local government, area. An International Journal of Contemporary Urban and Regional Development from Multidisciplinary Perspective, 4 (1&2), 83–96. 2013
- Federal Highway Administration. (2019). 2017 National household travel survey. U.S. Department of Transportation.
- Fei, S., & Zhu, L. (2019). Analysis of trip generation rate in residential commuting based on mobile phone signalling data. Journal of Transport and Land Use, 12(1), 201–220. http://dx.doi.org/10.5198/jtlu.2019.1431
- Fraser, N. (1998). Social justice in the age of identity politics: Redistribution, recognition, participation, WZB Discussion Paper, No. FS I 98-108, Wissenschaftszentrum Berlin für Sozialforschung (WZB), Berlin. http://hdl.handle.net/10419/44061
- Giuliano, G. (2003). Travel, location and race/ethnicity. Transport Research. Part A: Policy and Practice, 37(4), 351–372.
- Goodman, A., Guell, C., Panter, J., Jones, N. R., & Ogilvie, D. (2012). Healthy travel and the socio-economic structure of car commutting in Cambridge, UK: A mixed - method analysis. Social Sciences and Medicine, 74(12), 1929–1938. https://doi.org/10.1016/j.socscimed.2012.01.042
- Harvey, D. (1997). Contested cities: Social process and spatial form. In N. Jewson & S. McGregor (Eds.), Transforming cities: Contested governance and new spatial divisions (pp. 19–27). Routledge.
- Jayamala, M. (2008). Trends and spatial patterns of crime in India: A case study of a district in India [A Doctoral dissertation in sociology]. Annamalai University.
- Jocoy, C., & Del Calsino, V. J. Homelessness, travel behaviour and the politics of transportation mobilities in long beach, California. (2010). Environment and Planning, 42(8), 1943–1963. 2010. https://doi.org/10.1068/a42341
- Laah, D. E., Abba, M., Ishaya, D. S., & Gana, J. N. (2013). The mirage of rural development in Nigeria. Journal of Social. Science. And Public Policy, 5, 13–26.
- Lareau, A. (2003). Unequal childhoods; class, race, and family life. University of California Pres. Government Printer.
- Lawrence, F., & Enegeike, P. (2000). How Land use and Transportation System Impact Public Health: A literature review of the relationship between physical activity and built form. ACES: Active Community Environments Initiative Working Paper #2. Centre for Disease Control and Prevention. https://www.cdc.gov/nccdphp/dnpa/pdf/aces-workingpaper2.pdf
- Madhuwanthi, R. A. M., Marasinghe, A., Rajapaske, R. P. C. A., Dharmawasa, A. D., & Nomura, S. (2016). Factors influencing to travel behaviour on transport mode choice- a case of Colombo metropolitan area in Sri Lanka. International Journal of Affective Engineering, 15(2), 63–72. https://doi.org/10.5057/ijae.IJAE-D-15-00044
- Marmot, M. (2004). Status syndrome. Royal Statis. Society, 1(4), 150–154. https://doi.org/10.1111/j.1740-9713.2004.00058.x
- Matalon, B. (1992). Mobility with regards to social groups and attitudes. Transport and Roads Research Laboratory Reports, 689, 130–151.
- Newbold, K. B., Scott, D. M., Spinney, J. E. L., Kanaroglou, P., & Páez, A. (2005). Travel behavior within Canada’s older population: A cohort analysis. Journal of Transport Geography, 13(4), 340–351. https://doi.org/10.1016/j.jtrangeo.2004.07.007
- Nwachukwu, L. C. (2016). Revitalizing sustainable agriculture in Nigeria: The Participatory Rural Appraisal (PRA) approach revisited. Global Journal of Appied. Management and Social Sciences, 12, 67–76.
- Ogunsanya, A. A. (2002). Maker and breaker of cities. 59th. Inaugural Lecture, University of Ilorin. Uni-Ilorin Press.
- Olawole, M. O. (2013). Exploring mobile phone uses and rural travel behaviour in Ijesaland, South Western Nigeria. Ife Research. Publication. In Geography, 12(1&2), 29–44.
- Oyedepo, O. J., & Makinde, O. (2009). Regression model of household trip generation of ado-ekiti township in Nigeria. European Journal of Scientific Research, 28(1), 132–140.
- Oyeleye, O. I., Toyobo, A. E., & Adetunji, M. A. (2013). Travel behaviour of rural people in developing countries. Civil and Environmental Research, 3(8), 25–31.
- Popoola, K. O. (2011). Effect of socio-economic status on households’ all-purpose travel pattern of men and women in Ibadan, Oyo state. 4th European conference in Africa studies-ECASA, Uppsala, Sweden. African Engagements on whose Terms 2011, 107–108.
- Pucher, J., & Renne, J. L. (2005). Rural mobility and mode choice: Evidence from the 2001 national household travel survey. Transportation, 32(2), 165–186. https://doi.org/10.1007/s11116-004-5508-3
- Ryley, T. (2005). Use of non-motorised modes and life stage in Edinburgh. Journal of Transport Geography, 14(5), 367–375.
- Sanni, K. B., Nsisong, U., Abayomi, A. O., & Modo, F. N. (2010). Leonard E. N. family types and juvenile delinquency issues among secondary school students in Akwa Ibom state, Nigeria: Counseling implications. International Journal of Social Sciences, 23(1), 21–28.
- Sharma, S. (2020). Factors influencing Travel Behaviour and Mode Choice. https://www.geospatialworld.net/blogs/factors-influencing-travel-behavior-and-mode-choice/
- Starkey, P., Ellis, S., Hine, J., & Ternell, A. (2002). Improving rural mobility. Options for developing motorized and non-motorised transport in rural areas (World Bank Technical Paper. WTP525).
- United Nations Economic and Social Commission for Asia and the Pacific. (2015, July 9-10). Concept of sustainable transport: Planning and designing for sustainable and inclusive transportation systems. National capacity building workshop on sustainable and inclusive transport development in Colombo, Sri-Lanka.
- Veryard, D , Perkins, S & Organisation for Economic Coperation and Development/ International Transport Forum. (2018). Integrating urban Public Transport Systems and Cycling, 166 (ITF/OECD).
- World Bank. (2008). Disability and poverty. A survey of world bank poverty assessment and implications. www.worldbank.org
- World Bank. (2015). For persons with disabilities, accessible transport provides pathways to opportunities. https://www.worldbank.org/en/news/feature/2015/12/03/for-persons-with-disabilities-accessible-transport-provides-pathways-to-opportunity
- Yamane , K., Fujiwara, A., & Zhank, J. (2005). Analysis of travel behaviourarray pattern from the perspective of transportation policies. Journal. Of the Eastern Asia Society for Transportation Studies, 6, 91–106.