
ABSTRACT
Our built environments offer distinct variables that impact behaviour – throughout the world, and equally within Western Australia. However, an in-depth analysis of extant literature indicates that influencing human behaviour is difficult in the absence of a ‘disruption’ event. Accordingly, this organization-level study examined the disruptive effects of relocating from a Subiaco office to a new office in Perth’s Central Business District on the commute habits of its built-environment professional employees. The relocation occurred during a ‘non-lockdown’ period between July and August 2021 (southern hemisphere winter). The study sought to determine if an office relocation constituted a sufficient ‘disruption’ to affect employees’ commute behaviours, and in contrast to state and national figures, to quantify how micro-communities revise and develop commuting habits in response to changing circumstances. It was expected that the shift would increase public transportation reliance, lengthen commute times, and increase expenditure. The study applied a two-part purposive survey using frequencies and a one-sample Chi-Square test at the 95% confidence level. The distance between the two locations and projected trip times through various modes was calculated using Google Maps. The findings indicate that both Subiaco and Perth had higher public transportation utilisation when compared to state and national numbers as a multi-modal means of commuting. Furthermore, car reliance decreased and general satisfaction with commuting choices increased for the Perth study. This suggests that multi-modal public transportation commute alternatives provided a cost-effective and efficient, alternative. The study identified social value and preference propositions beyond return-on-investment for improving existing idle city assets. Lastly, the study contributes to evolving contemporary cross-disciplinary discourse and body of knowledge in human geography, urban community development, and transportation, and sought to concomitantly determine the potential to further extend this research through concurrent collection of employee daily step count data.
1 Introduction and background
Globally, time spent commuting has been trending upwards.Footnote1 In Perth, city sprawl has negatively impacted (increased) time required for travel to and from work (Committee for Perth, Citation2014). Considering this impact and given that driving remains the main mode of work-related commuting in Australia, with train and a combination of train and bus travel the most utilised public transportation (Australian Bureau of Statistics, Citation2017), such passive modes continue to pose a significant risk to health due to their contribution to inactivity levels in an increasingly sedentary world.Footnote2
Commuting by car or public transport, both of which predominantly involve lengthy periods of sitting, typically produces negative health outcomes. From a health and wellbeing perspective, it is important to encourage active commuting, which involves physical activity while travelling to and from home. Jones and Ogilvie (Citation2012) note that ‘active commuting’ refers to ‘commuting solely by walking or cycling; or by walking or cycling in combination with motorised modes of travel’. For this purpose, the literature was analysed for single-methodFootnote3 modes of travel to work in Australia and then the national averages were compared with the Perth averages. Saelens and Handy (Citation2008), Frank et al. (Citation2006), Chatman (Citation2009), Cao et al. (Citation2009), and Jones and Ogilvie (Citation2012) suggest that due to associations and relationships that we develop with the built environment, relocation may be a potent precursor to changing travel behaviours. Accordingly, this research, a localised but scalable case study, assesses organisation-level employee commuting preferences, the factors that influence behaviour changes, and the experiences prior to and post relocation of Australian built environment design firm Hames Sharley, the purpose being to determine how this disruption event has influenced work-related travel habits and how the figures compare with the state and national figures. Hames Sharley’s Perth office, their largest, has moved from its long-term home in Subiaco to the centre of Perth city, representing an ambitious decarbonisation strategy, while also achieving democratisation of transportation and access to parking.
Based on the 2016 Australian Census of Population and Housing, Australians, on average, commute 16.5 kilometres (km) to reach their workplace; 73.8% rely on a motor vehicle (driver or passenger), 3.4% a bus, and 1.1% a bicycle, while 3.9% walk. Perth residents commute an average of 15.7 km, with 79.3% travelling by car, 3.8% walking or cycling (the country’s lowest percentage). Ma and Ye (Citation2019) point out that national average daily commute times have increased from approximately 49–60 minutes (from 2002 to 2017), and citing Household, Income and Labour Dynamics in Australia (2019) survey posit that people that commute from two hours per day or more have less overall work satisfaction resulting from negative impacts such as reduced opportunity for other activities, social connectedness, and family time. On census day in Perth, 83% drove to work and (Perth residents) were the most dissatisfied with their cycling infrastructure (Australian Bureau of Statistics, Citation2017). Foley et al. (Citation2015) highlight that ‘active commuting leads to healthy activity and positive mortality and cardiovascular outcomes’. This view is supported by Hamer and Chida (Citation2008), Kitchen et al. (Citation2011), and Oja et al. (Citation2011). Further to this, the research underscores a direct correlation between changing behaviours towards active commuting and recreational and total physical activity. However, to ascertain and develop initiatives that will encourage active commuting will require further research targeted at work-related modes of travel, which this research seeks to address.
Existing research in the field is broad. For example, Abrahamse et al. (Citation2009) and Lowe et al. (Citation2018) investigated the relationship between urbanisation and impact on transport and associated infrastructure development, while Chatterjee et al. (Citation2019) undertook a critical review of commuting and wellbeing, both during and immediately following the commute, and the benefits over the long term. Goodwin et al. (Citation2009) conducted research into individuals’ initial attitudes regarding the 2009 H1N1 influenza pandemic in Europe and Malaysia (Goodwin et al., Citation2009). More recently, Thomas et al. (Citation2021) suggested that prior pandemic studies focused predominantly on international travel, while Leggat et al. (Citation2010) and Thomas et al. (Citation2021) explored attitudes surrounding public transport in relation to the current COVID-19 pandemic.
Other research has predominantly focused on commuting habits and habit formation. Eriksson et al. (Citation2008) noted that commuting habits are established through repetitive practice in the absence of extenuating circumstances. In support of the current study, research by Verplanken et al. (Citation2008) and Wood et al. (Citation2005) alluded to the habit discontinuity hypothesis, which maintains that subtracting environmental markers from the behaviour-forming equation is likely to generate the necessary conditions for a change in behaviour and supports the development of new relationships in new contexts.
A fundamental understanding of behavioural rationale, established through research, offers additional intellectual tools with which to enhance existing conditions. Jonescu (Citation2013) argues that critical knowledge of the psychology of space and behavioural norms acts as a set of additional intellectual instruments informing more considered decisions. These tools could be used to complement and enhance existing knowledge, and provide an increased capacity for learned quality outcomes and discourse with the distinction of context and event-specific (urban) spatial, social, cultural, and behavioural nuances.Footnote4 This organization-level study examines the effects of relocating from a Subiaco office to a new office in Perth’s Central Business District on the commute habits of professional built-environment staff to determine if the office relocation event was a sufficient ‘disruption’ to significantly affect employees’ commute mode behaviours in contrast to established state and national norms deriving from Australian Bureau of Statistics (Citation2017) commute data preceding the existence of COVID-19. It must be noted that WA has had limited lockdown periods compared with the rest of Australia,Footnote5 and elsewhere. Perth lockdown dates include: 17/03/2020–27/04 2020 (restrictions only no lockdown), 31/01/2021–5/2/21 = 6 days, and 24/04/21–27/04/2021 = 5 days. This study was conducted in two phases, 15–29 July 2021, and 13–27 August 2021 (discussed further in the methodology section). The relocation was expected to affect the commuting behaviour of the participants. This research sought to understand how and to what degree. Moreover, in quantifying this, the study is positioned to better understand how micro-communities revise and develop commuting habits over time through a future follow-up study, contributing to the rapidly evolving contemporary cross-disciplinary discourse and body of knowledge at the nexus between human geography, urban community development, and transportation.
2 Methodology
This research was conducted in four stages:
Stage 1: Situational analysis – further informing the development of Stages 2 and 3
Stage 2: Survey, Part A (quantitative survey of Hames Sharley staff [SUBIACO])
Stage 3: Survey, Part B (quantitative survey of Hames Sharley staff [PERTH, CBD])
Stage 4: Statistical analysis and comparison of Stages 2–3 data
Stage 1: situational analysis and literature review
The literature review commenced with a comprehensive search for relevant research papers, practice-led research, and grey literature. Only sources published in the previous ten years were considered, though some older publications were also reviewed to inform the author’s background knowledge relating to historical threads, which allowed for a more in-depth analysis. The process consisted of exploring and reviewing scholarly articles and publications to establish the research questions and understand any gaps in the existing research.
This research applied purposive sampling, which enabled the researcher to base the research objectives on an in-depth analysis of the existing literature and a survey of an organisation’s employees. Participants were invited in two rounds, and recruitment continued until saturation was reached. The intention was not to represent the greater population but to better understand the inter-organisational behaviours by comparing them with published literature on findings that do represent the greater population.
Stage 2: survey (Part A) and Stage 3: survey (Part B)
The questionnaire was structured in two parts (Part A and Part B). Both parts consisted of the same seven closed-ended questions relating to commuter mode, frequency, time, distance, cost, and convenience, providing respondents with an efficient way to answer the questions (Hyman & Sierra, Citation2016). Each stage of the survey focused on travel habits to a specific office location. Part A of the survey was distributed to all 86 Perth employees at Hames Sharley for the two-week period 15–29 July 2021 with the focus on their existing commuting habits to and from work at the Subiaco office (round trip). Part B was distributed to the same respondents for the two-week period 13–27 August 2021 with the focus on their commuting habits to and from the new Perth central business district (CBD) office. Fifty-five respondents (n = 55) participated in Part A and 55 (n = 55) in Part B of the study a response rate of 63% and 66% respectively. With each survey question, the aim was to collect data related to the research objectives. Responses to the questions provided quantitative data, which was used to identify relationships between variables, and relationships between participants.
Data collection methods depend on the aims and objectives of the particular study, and an appropriate collection technique was required to strengthen the validity of the research. Given that primary data is typically time-consuming and that at times it can be difficult to obtain target respondents (Walliman, Citation2011), in order to maximise reach, this study used Microsoft Forms to develop and deploy an internal survey to collect the required data. The questionnaire was distributed to a purposive sample via a link through an internal email. Naoum (Citation2019) suggests that when conducting research, questionnaires provide a useful method for acquiring comprehensive and insightful information and provide a controlled method for gathering qualitative and quantitative data, this attestation is further supported by Levitan et al. (Citation2018). The completion of an exploratory survey among targeted participants enabled data to be collected and analysed, the intention being to understand employees’ past, and present commuting behaviours.
Measurement
Self-reported commuting behaviour
Commuting behaviour was assessed, both retrospective commuting (Subiaco) and current commuting (Perth CBD) between home and work. For both locations, participants were asked to estimate how far they travelled to work and home each day, and which forms of transport they most frequently relied on to do so. They could report multi-modal and single methods of travel in any direction. Estimates of active commuting time were derived from mobile devices and smart watches. Participants were also asked to report their estimated total commute time to and from work and the number of days per week they commuted in this way. The implications for weekly commute expenditure – that is, whether the positive aspect of flexible working would outweigh any negative aspects related to an increased expense associated with commuting was also of interest in this research. This knowledge was considered important to determine any net positive outcomes of and/or sentiments regarding commuting arrangements arising from any disruption to existing habits due to relocation of the employees’ office. Furthermore, we sought to determine whether the change precipitated by a disruption at a local organisation level reflected city or national trends.
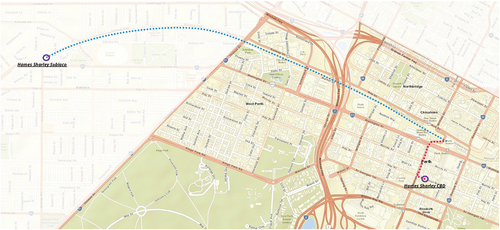
Google Maps was used to quantify the distance between the Subiaco and CBD studios by the fastest and most direct route (see ). Both the quickest route and alternative routes were assessed, resulting in the following estimations: 4.2 km by car with a 10–13-minute travel time; an estimated 3.6 km by train with an associate 16-minute travel time (including a 10-minute walk); 22–32 minutes for a combined bus journey and walk; 13–19 minutes if cycling (depending on route); and 46 minutes if walking the entire distance (Google, n.d.).
Figure 1. Hames sharley Subiaco and Perth CBD office locations. blue line denotes train route, red line indicating walking leg from Perth underground to CBD office. (Author 2022 adapted from ArcGIS, Citation2022.)
Self-reported step count
For the step count in this study, respondents’ average step counts were recorded over a two-month period as a pilot study during occupancy at (1) the Subiaco office (any two qualifying months between January and July) and (2) the new CBD office (July and August).Footnote6 Step counts were calculated over a full working day, including commuting to and from work. Step-count data was recorded via the participants’ wearable devices, such as Fitbit, Apple Watch, and Garmin as well as mobile phones, which were consistently carried on their person. The study involved 12 respondents from the Perth office only (n = 12); all were participants from the sample (n = 55) from Part A of the commute study.
Stage 3: statistical analysis
SPSS26 was used to manage and analyse data. The survey consisted of categorical variables except ‘general satisfaction of commuting (GSC)’. Thus, ‘frequencies’ were selected to describe sample data except for GSC. To compare the effect of office relocation towards employees’ preference of travel mode, the proportions (Yes: No = X: 100-X) were hypothesised for each travel mode and each location. Hypothesis testing was carried out at the 95% confidence level using one sample Chi-Square test. When the asymptotic significance was greater than p = 0.05, the hypothesised proportion were selected as employees’ preference of commuting for each location. Thereafter, the outcomes were compared between the locations to see the effect of relocation. To compare commuting preferences with ABS 2016, participant’s responses were coded under four categories: public transport only (public bus, train, ferry, tram or train); private vehicle only (trips using private vehicle as a driver or passenger), mixed of public and private transport, and active transport only (cycling or walking). The proportions of employees using these travel categories were hypothesised and tested using one sample Chi-Square test at the 95% confidence level.
3 Findings and discussion
General findings
Of the respondents, 28% estimated that on average they travelled 6–10 km to work at the Subiaco office, whereas 35% travelled this distance to the CBD office, and 94% of these two groups of respondents did so every day. The number of respondents who stated they travelled more than 20 km was 17% for Subiaco and 11% for the CBD. Of the participants travelling this distance to Subiaco, 67% stated they were neither satisfied nor dissatisfied with their general commuting arrangements. In the Subiaco study, 13% of respondents stated their commute distance was 15–20 km, and of these, 86% averaged a total commute time of 31–60 minutes; 9% had a total commute time of greater that 60 minutes, and this latter percentage remained unchanged for the CBD study (). For Subiaco, 33% of respondents spent 15–30 minutes travelling to work; this increased to 58% for the CBD office. For the Subiaco location, 35% spent 31–60 minutes travelling to work compared with 25% for the CBD location. Regarding those who travelled less than 15 minutes to work, 24% of Subiaco respondents and 9% of the CBD respondents did so. For both locations, the median category of commute time is the same (i.e. 15–30 minutes).
Table 1. Frequencies of commute time – CBD versus Subiaco
The survey responses indicate that 90% of all respondents estimated their total commute time (round trip) to and from Subiaco and the CBD to be on average less than 60 minutes. According to Ma and Ye (Citation2019) the Household, Income and Labour Dynamics in Australia (HILDA) survey suggests an average daily commute time for Perth as 59 minutes. This was calculated by dividing the time spent travelling to and from work in a typical week by the usual number of days worked per week. Overall, after the relocation to the CBD, there was a reduction in commute time for approximately 25% of participants. It must be noted that there were increases in individual travel times; this largely reflected those participants who shifted their transportation modality from passive to active (cycling and walking), which accounted for a marginal increase in travel time. However, this resulted in a higher satisfaction rating (and a healthier option).
There was a slight adjustment in the estimated cost of travel. For example, 31% of respondents stated they spent less than $10 on their weekly commute to Subiaco; however, this figure decreased to 23% for the CBD location. In the $11–$25 category, there was an increase from 25% of respondents (Subiaco) to 33% (CBD). Those who spent $26–$50 decreased from 33% to 28%, while those who spent $50–$100 per week increased from 11% to 16%. These figures are in keeping with the increase in dependence on public transport, whether used in isolation or in combination (i.e. public transport with other modes).
In general, 60% of all respondents were either satisfied or very satisfied with their commuting arrangements to Subiaco, while this number increased to 73% for those commuting to the CBD. Moreover, the respondents who were neither satisfied nor dissatisfied reduced from 31% to 21%. The figures for those who reported being very dissatisfied (4%) and dissatisfied (5%) changed to 5% for dissatisfied and nil for very dissatisfied.
Active modal findings
Overall, 82% of respondents in the Subiaco study, irrespective of mode of travel, used the same mode every day, and a further 9% did so four days per week, which suggests this was either habitual behaviour or few travel options were available. In the CBD study, 71% used the same mode of travel to commute every day, and 17% did so four times per week, which suggests more options were available and/or respondents used blended modes of travel. Jones and Ogilvie (Citation2012) mentioned that people do not necessarily simply adopt a preferred means of travel but continually deliberate, subject to several non-fixed variables.
One respondent listed walking as a single mode of travel to the CBD (and very satisfied); there were no respondents in this category for the Subiaco study. Only three respondents listed cycling as a single mode of daily transport, both to Subiaco and to the CBD, and in both instances, they listed their level of satisfaction with their general commuting arrangements to the workplace as satisfied to very satisfied. Cyclists spent less than $10.00 per week and travelled less than 5 km to work at Subiaco and a total daily commuting time of less than 15 minutes (this increased to 6–10 km and 15–30 minutes for the CBD), and the level of satisfaction remained satisfied to very satisfied. In contrast, 17 respondents listed car (alone) as their single mode of travel to Subiaco (70% of those respondents travelled by car every day). Six drove 11–15 km, and five drove 6–10 km. Most respondents who drove stated that their estimated total round trip commute time on average was 15–30 minutes. The satisfaction level was balanced across the respondents but varied from very satisfied to very dissatisfied.
Train (alone) was selected by eight respondents as a singular mode of travel to Subiaco. All of the respondents in this category travelled by train every day and were generally satisfied to very satisfied. Of the respondents in this category, 87% spent $26–$50 per week. Ten respondents used the train in combination with another form of transport, while three used the bus alone.
In keeping with Jones and Ogilvie (Citation2012), in this study, the respondents’ modes of commuting appeared to be motivated by opportunity, convenience, and expediency. As 23% of respondents stated they lived less than 5 km from work (CBD) but did not cycle or walk, this suggests that cost minimisation and increased physical activity (and potential for improved health outcomes) did not persuade participants to shift to more active modes of commuting. Notwithstanding this, the data indicated a notable average increase in step count of 31% for the participants measured (n = 12) in the CBD location. Participant feedback suggested that the increase in mobility was due to the need to attend external meetings, increased transitioning involved with public transport, increased interest in walking about the city during lunch breaks, and the CBD office layout. Mobility data requires further investigation to adequately elicit and quantify valid findings. While this does not directly relate to the work of Yang et al. (Citation2012), Sahlqvist et al. (Citation2012), and Sahlqvist et al. (Citation2013) on correlating active travel and physical activity, the current study highlights an increase in worker mobility in response to a shift in work location and affordance, though a key limitation of this research is that the data was collected in one season only: winter. Further research should explore commuting habits across other periods of the year, which may elicit season-related findings.
Since there were multiple modes of transport used by some participants, the responses were converted to ‘yes’ and ‘no’ answers for each transport mode for further analysis. Thus, ‘yes’ means an employee uses the specified transport mode to work at least sometimes. shows descriptive statistics for each travel mode, including the amount and percentage of increase for each transport mode because of relocation.
Table 2. Descriptive for travel mode
The table indicates that office relocation created an increasing tendency towards using sustainable transportation modes such as train (18.2%), bus (29.1%) and park and ride (3.6%). Carpooling was not subjected to change. In the sample, there was a reduction in driving cars alone (−27.2%). There was slight increase (3.6%) in using active transport also, but there must be a statistical comparison to support that these changes are significant at the 95% confidence level.
After converted to ‘yes’ and ‘no’ answers, the data distributions of travel modes were dichotomous. The Chi-square test is a robust test to evaluate dichotomous variables and as a non-parametric test, it does not require to satisfy the need for homoscedasticity in data (McHugh, Citation2013).
However, a participant must only contribute data to a single cell in the Chi-square. In contrast, some study subjects used multiple transport modes. Therefore, Chi-square tests were performed for each transport mode separately. Considering these needs, the following hypothesis was set and tested for each location:
H0: employees’ preference of using Transport Mode N is equal to [X:100-X], where X is the percentage of employees whose preference is ‘yes’.
Ha: employees’ preference of using Transport Mode N is not equal to [X:100-X], where X is the percentage of employees whose preference is ‘yes’.
The hypothesised proportions [i.e. (X:100-X)] were set heuristically by looking at the sample data and until the asymptotic significance was greater than p = 0.05. At this point, it was considered that the percentage of employees using (or not using) each transport mode was not significantly different from the hypothesised proportions.
The two categories – ‘Taxi or Uber’ and ‘Bikes’ – were not considered due to the minimum sample requisite (N ≥ 5). For the same reason, the ‘park and ride’ category was not considered in the Subiaco sample. shows the outcomes of the one sample Chi-Square tests for CBD and Subiaco for accepted proportions. For comparison, the table also illustrates the percentage of users from Australian Bureau of Statistics (Citation2017) for some travel modes for Greater Perth and whole of Australia. However, a limitation is, Australian Bureau of Statistics (Citation2017) considers travel preference only for the census day.
Table 3. One sample chi-square statistics for travel mode: CBD versus Subiaco
Comparing the outcomes between the two locations, it can be concluded that there is a 15% increase in the use of train due to office relocation (45% versus 60%). Only 15% of employees used buses to work in Subiaco; this has been increased up to 45% after moving to CBD. Employees who drive cars alone has reduced from 45% to 15% after moving the office. While carpooling is not subjected to change, there is no adequate evidence to support that use of active transport is significantly changed by office relocation.
Compared with the 2016 Australian and Perth averages,Footnote7 where Australian commuters averaged 16.5 km to reach their workplace and Perth commuters averaged 15.7 km, most commuters at an organisation level travelled 10.4–13 km to the Subiaco office and 9.5–12.3 km to the CBD office. Moreover, regarding reliance on the car for commuting purposes, the 2016 Australian average indicated 73.8% relied on a motor vehicle (driver or passenger) to commute to work, and the Perth average indicated 79.3%. The corresponding percentage for staff at Hames Sharley for the Subiaco commute was 33% (combined car [only] and car [pool]).Footnote8 On Census Day 2016 in City of Perth, 36.1% of people travelled to work in a private car, and 24.7% took public transport (.id Community Pty Ltd, Citation2021b), whereas for the greater Perth Metropolitan Area, 68.7% of people travelled to work in a private car, and 10.3% took public transport (.id Community Pty Ltd, Citation2021a).
While the figures for active transportation at all three levels – national, Perth, and organisation – remained very low (less than 5%), there was a disproportionate gap in commute by bus and train. The national average for commuting by bus was 3.4%, while the Subiaco study data suggest 5% (16% if multi-modal) and 19% for the CBD location as single mode only. The Australian average for train use was 5.1% in 2016, while for Perth the figures included train, bus, tram, or ferry use as a combined category figure. Even when measured in combination, usage numbered 8.1%, while train (only) use for Subiaco was 44% and 25% for the CBD. As a multi-modal commute, 63% of respondents relied on trains for at least part of their commuting to the CBD.
Of the 9.2 million commuters on the census day, ABS illustrates that 79% travelled to work by private vehicle, 14% took public transport and 5.2% used active transport mode. To facilitate a comparison, the survey responses on commuting preference were categorised under four groups: Group 1: public transport only (only using bus, train and taxi/uber); Group 2: private transport only (only using car alone and carpooling), Group 3: mixed of public and private transport (use a mix of public and private transport including park and ride); and Group 4: active transport only. Employees who use active transport along with private and public transport or mixed of them were included in Groups 1–3 accordingly. shows cross-tabulation of transport category versus location.
Table 4. Descriptive statistics for travel category
The following hypothesis was tested via one sample Chi-Square Test.
H0: employees’ preference of using Transport Groups 1–4 is equal to [X1: X2: X3:X4]
Ha: employees’ preference of using Transport Groups 1–4 is not equal to [X1: X2: X3:X4]
X1:% using public transport only; X2:% using private transport only; X3:% using mix of public and private; X4:% using other transport only
The hypothesised proportions [i.e. (X1: X2: X3:X4)] were set heuristically by looking at the sample data and until the asymptotic significance was greater than p = 0.05. At this point, it was considered that the percentages of employees using transport categories were not significantly different from the hypothesised proportions. illustrates the test outcomes along with Australian Bureau of Statistics (Citation2017) data for comparison.
The proportions of X1:X2:X3:X4 = 35:35:18:12 for Subiaco
The proportions of X1:X2:X3:X4 = 70:0:25:05 for CBD
Table 5. One Sample Chi-Square Statistics for Travel Group
With compared to 79% who travelled to work by private vehicles in ABS Census, employees relied much less on private transport in both locations: for Subiaco, 35% of employees relied on private transport only while another 18% use private transport at least sometimes. After moving to CBD, the sole dependence of private transport fell to ‘zero’ while the use of mixed transport remains at 25%. This indicates that there is a clear reduction in the use of private cars. Being next to a train station and frequent bus routes, public transport users are significantly higher than 14% who took public transport on the Census Day. It could be concluded that the employees who travelled to work by public transport got doubled after office relocation. This may be due to congestion and parking limitations in the city for private cars with compared to Subiaco. Employees who relied on active transport only fell by 7%: this could be due to lack of cycling infrastructures and increase of travel distance for walkers who resided closer to Subiaco Office.
According to the National Transportation Commission (Citation2019), the average annual carbon dioxide (CO2) emissions of a typical passenger vehicle (new light vehicle sold in Australia at 2018) was 182 grams per km (g/km). Based on this figure and accounting for the 17 respondents who stated their mode of commuting was by car (only) from Survey Part A, the estimated total km travelled based on their responses to the question ‘How far do you estimate you travelled to get to work (Subiaco) from home each day?’ (round-trip total distance) was 490 km. At 182 g/km, this equated to 89,180 grams per day for these staff. On the assumption of 260 working days per year, this equated to 23.1868 tonnes of CO2 emitted into the atmosphere over the course of a year (mass divided by 1e+6). The weight of this CO2 is equivalent to that of 17.8 average cars. A further 11 respondents used multi-modal forms of transportation that included driving; however, this was not included in the calculation. Their combined trip data would have been required to account for separable portions.
4 Conclusion
This research explored Australian commuting preferences at both a national level and a state capital city level through census data to better understand the general preferences of Australian commuters ahead of undertaking a two-part organisation-level survey. This research contributes to interdisciplinary knowledge in planning, urban development policy, economics, public health, and public transportation, and suggests several additional areas for follow-up research.
The study sought to determine how staff’s commuting habits have changed in response to a change in work location compared with state and national figures. Specifically, the study examined the commuting behaviours of employees at Hames Sharley (built-environment industry professionals) at an organisation level and the factors influencing behaviours and experiences prior to and post transitioning from an existing office in Subiaco to a new office situated in Perth’s CBD. At the outset, it was anticipated that the shift to the CBD would lead to increased dependence on public transport, purely from the perspective of the cost and difficulty associated with parking; while this did occur, the findings provided an additional depth of understanding regarding how this manifested in real terms.
While office relocation influenced commuting attributes – such as travel time, distance and weekly spending – slightly, there is a significant shift in travel mode preferences.
Both locations had access to good public transportation including bus routes and train stations. When compared with greater Perth and national figures, research participants indicated a much greater reliance on public transport even prior to office relocation, and was well utilised as a multi-modal means of travel. In Subiaco, 35% of the study participants solely relied on public transportation and this is nearly 04 times the preferences for Greater Perth (8.1%) and whole of Australia (9.2%).
After relocation to the CBD, sole public transport users doubled (70%). This suggests that employees’ commuting preference was largely governed by externalities such as the prospect if increased parking cost, sharper parking restrictions in CBD. To discourage heavy private car dependence elsewhere, other councils who share good access to public transportation options could also evaluate the possibility to revising their parking regulations.
Regardless of the availability of bus services in Subiaco, 85% of the employees did not commute by bus. This could be due to indirect routes, poor transport planning, and that buses are subject to the same congestion as vehicles, where trains have priority in transportation hierarchy. Although there are many offices in Subiaco, most Perth suburbs do not directly connect by bus to Subiaco. Because of this, employees require to travel to CBD first to interchange to either a bus or train to Subiaco. Inconvenience and long transit times could discourage people from using bust transportation for commuting–it also increases transportation costs. In conjunction with availability and access to relatively affordable parking spaces employees may be persuaded to use drive their motor vehicle. After moving to CBD, there were no transit requirements for bus commuters, and bus use increased threefold (to 45%).
Car dependence decreased, and the overall level of satisfaction with commuting options was higher in the CBD study than in the Subiaco study. Although public transport use increased significantly, there was no significant reduction in transportation cost overall. This suggests that public transport journey options provided a relatively affordable, efficient, and quality alternative. However, further reduction in bus and train fares could encourage more people to use public transport, in particular with increasing petrol prices. These findings have several implications for industry practice in terms of the understanding of commuter habits associated with a disruption event. Specific to this study, in relocating to the CBD, there exists preconceived or ‘perceived’ notions (of a heavily car-centric population) of an impact to cost, expediency, satisfaction, and public transportation capability in meeting commuter needs.
This research found that Hames Sharley employees’ active commute habits were consistent with both the national and Perth data in that it was significantly lower than other modes of commuting. Given the distance of travel for several respondents was well within walking or cycling distance, however, active commute habits could have been higher (than the 20% reported), and encouraging active commuting (weather conditions and extended responsibilities beyond work permitting) has potential for further research and initiatives relating to general wellbeing and public health outcomes beyond the scope of this study. A longitudinal study expanding on this research is also recommended to understand commute preference over time. Considering the health benefits of active transport, City of Perth could invest in improved cycling infrastructures and incentivisation, while the Department of Health would be well placed to invest in advertisement campaigns.
Concurrently, 12 participants (of the Part A respondent cohort) were involved in the average step-count pilot study. Anecdotally, it was thought that walking to external meetings and to community and other engagements would positively influence step count (a viable option due to the CBD location). The pilot was conducted over a two-month period and consisted of recorded data prior to and post occupancy in the new CBD workplace location. The pilot study data highlighted strong potential for future comparative analysis research between Subiaco and the CBD regarding performance alignment to agile hybrid work settings, reduced dependence on vehicular modes of travel, active transportation for the purpose of meeting attendance, and other events. It incumbent for designers to consider quality end-of-trip facilities in new, and adaptive re-use design facilities to entice, make practical, and comfortable the notion, and experience of actively commuting into the CBD for the vast most commuters.
Future research could consider studies comparing WA commute behaviours against that of other states in Australia during the COVID-19 pandemic, which would make for an interesting future study to better understand comparative public transportation use arising from the pandemic in light of variability in lockdown and restriction measures.
Disclosure statement
No potential conflict of interest was reported by the authors.
Notes
1. This research acknowledges that COVID-19 has caused inconsistencies in periods of instability at state and local levels, and this has initiated disparate influences on established attitudes towards public modes of transportation.
2. Step count was conducted as a pilot study to determine the potential for future research on the effect that a change in office location could have on total employee step count, including examining spatial relationships and any associated influence on movement, and researching increased mobility and perceived/actual wellbeing.
3. Single-method travel figures exclude ‘Worked from home,’ ‘Not stated,’ ‘Did not go to work,’ and all multi-response categories (Australian Bureau of Statistics, Citation2017).
4. Despite the significance of the study for land use planning, it is considered an early stage of land-use adjustment because of the COVID pandemic. To inform planning policies, the issues of workplace relocation requires a further comprehensive review that considers public transit and work-from-home options.
5. Comparing WA commute behaviours against other places in Australia during the COVID-19 pandemic would make for an interesting future study to better understand comparative public transportation use, however, this is not the main thrust of this research.
6. Qualifying months excludes work from home and any ‘lockdown’ periods, which are excluded from the study.
7. Figures for Australian and Perth averages is sourced from ABS, 2017.
8. This excluded the car as part of a multi-modal commute journey.
References
- Abrahamse, W., Steg, L., Gifford, R., & Vlek, C. (2009). Factors Influencing Car Use for Commuting and the Intention to Reduce it: A Question of self-interest or morality? Transportation Research Part F: Traffic Psychology and Behaviour, 12(4), 317–324. https://doi.org/10.1016/j.trf.2009.04.004
- ArcGIS (2022). ArcGIS Online Mapping. Retrived Feb, 16 2022, from, https://perth.maps.arcgis.com/apps/webappviewer/index.html?id=dc4d2cd6bd1344c3bfa8130a5635cf69
- Australian Bureau of Statistics (2017). Media Release: More than Two in Three Drive to work, Census Reveals (Media Release). https://www.abs.gov.au/AUSSTATS/[email protected]/mediareleasesbyReleaseDate/7DD5DC715B608612CA2581BF001F8404?OpenDocument
- Cao, X. (Jason), Mokhtarian, P. L., & Handy, S. L. (2009). Examining the impacts of residential self‐selection on travel behaviour: A focus on empirical findings. Transport Reviews, 29(3), 359–395. https://doi.org/10.1080/01441640802539195
- Chatman, D. G. (2009). Residential choice, the built environment, and nonwork travel: Evidence using new data and methods. Environment and Planning A: Economy and Space, 41(5), 1072–1089. https://doi.org/10.1068/a4114
- Chatterjee, K., Chng, S., Clark, B., Davis, A., De Vos, J., Ettema, D., Handy, S., Martin, A., & Reardon, L. (2019). Commuting and wellbeing: A critical overview of the literature with implications for policy and future research. Transport Reviews, 40(1), 5–34. https://doi.org/10.1080/01441647.2019.1649317
- Committee for Perth (2014). Can Commuting Impact on Your health? Retrieved Aug, 5 2021, from, https://www.committeeforperth.com.au/assets/documents/cost-of-living/Cost-Of-Living-7-Commuting-Health-costs.pdf
- Eriksson, L., Garvill, J., & Nordlund, A. M. (2008). Interrupting habitual car use: The importance of car habit strength and moral motivation for personal car use reduction. Transportation Research Part F: Traffic Psychology and Behaviour, 11(1), 10–23. https://doi.org/10.1016/j.trf.2007.05.004
- Foley, L., Panter, J., Heinen, E., Prins, R., & Ogilvie, D. (2015). Changes in active commuting and changes in physical activity in adults: A cohort study. International Journal of Behavioral Nutrition and Physical Activity, 12(1), 1-12. https://doi.org/10.1186/s12966-015-0323-0
- Frank, L. D., Sallis, J. F., Conway, T. L., Chapman, J. E., Saelens, B. E., & Bachman, W. (2006). Many pathways from land use to health: associations between neighborhood walkability and active transportation, body mass Index, and Air quality. Journal of the American Planning Association, [Online], [ Accessed. 72(1), 75–87. http://actrees.org/files/Research/JAPAFrank06.pdf
- Goodwin, R., Haque, S., Neto, F., & Myers, L. B. (2009). Initial psychological responses to influenza A, H1N1 (“Swine flu”). BMC Infectious Diseases, 9(1), 1–6.https://doi.org/10.1186/1471-2334-9-166
- Hamer, M., & Chida, Y. (2008). Active commuting and cardiovascular risk: A meta-analytic review. Preventive Medicine, 46(1), 9–13. https://doi.org/10.1016/j.ypmed.2007.03.006
- Hyman, M., & Sierra, J. (2016). Open versus close-ended survey questions. NMSU Business Outlook, 12(2), 1–5. https://www.academia.edu/15400478/Different_types_of_marketing_research_surveys_Part_1_
- .id Community Pty Ltd (2021a). City of Perth: Method of Travel to Work. https://profile.id.com.au/perth/travel-to-work
- .id Community Pty Ltd (2021b). Perth metropolitan area: method of travel to work. Retrieved Dec, 17 2021, from, https://profile.id.com.au/perth/travel-to-work?WebID=230
- Jones, C. H., & Ogilvie, D. (2012). Motivations for active commuting: A qualitative investigation of the period of home or work relocation. International Journal of Behavioral Nutrition and Physical Activity, 9(1), 109. https://doi.org/10.1186/1479-5868-9-109
- Jonescu, E. E. (2013). Strategic and tactical architecture: An intellectual instrument of law enforcement. S. Doran & L. Bouttell, Eds. Reframing punishment: Silencing, dehuminisation and the way forward. Inter-Disciplinary Press. 261–276.
- Kitchen, P., Williams, A., & Chowhan, J. (2011). Walking to work in Canada: Health benefits, socio-economic characteristics and urban-regional variations. BMC Public Health, 11(1), 1–12.https://doi.org/10.1186/1471-2458-11-212
- Leggat, P. A., Brown, L. H., Aitken, P., & Speare, R. (2010). Level of concern and precaution taking among Australians regarding travel during pandemic (H1N1) 2009: Results from the 2009 queensland social survey. Journal of Travel Medicine, 17(5), 291–295. https://doi.org/10.1111/j.1708-8305.2010.00445.x
- Levitan, J., Mahfouz, J., & Schussler, D. (2018). Pragmatic identity analysis as a qualitative interview technique. Forum Qualitative Sozialforschung, 19(3), 1–22. https://doi.org/10.17169/fqs-19.3.3032
- Lowe, C., Stanley, J., & Stanley, J. (2018). A broader perspective on social outcomes in transport. Research in Transportation Economics, 69, 482–488. ISSN 0739-8859. https://doi.org/10.1016/j.retrec.2018.03.006
- Ma, L., & Ye, R. (2019). Australian City workers’ Average Commute Has Blown out to 66 Minutes a day. How Does Yours compare? The Conversation. Retrieved Dec, 17 2021, from, https://theconversation.com/australian-city-workers-average-commute-has-blown-out-to-66-minutes-a-day-how-does-yours-compare-120598
- McHugh, M. L. (2013). The Chi-square test of Independence. Biochemia Medica, 23(2), 143–149. https://doi.org/10.11613/bm.2013.018
- Naoum, S. (2019). Dissertation research and writing for built environment students. Routledge.
- National Transportation Commission (2019). Carbon Dioxide Emissions Intensity for New Australian Light Vehicles 2018. National Transport Commission (NTC). https://www.ntc.gov.au/sites/default/files/assets/files/Carbon%20dioxide%20emissions%20intensity%20for%20new%20Australian%20light%20vehicles%202018.pdf
- Oja, P., Titze, S., Bauman, A., de Geus, B., Krenn, P., Reger-Nash, B., & Kohlberger, T. (2011). Health benefits of cycling: A systematic review. Scandinavian Journal of Medicine & Science in Sports, 21(4), 496–509. https://doi.org/10.1111/j.1600-0838.2011.01299.x
- Saelens, B. E., & Handy, S. L. (2008). Built environment correlates of walking. Medicine & Science in Sports & Exercise, [Online], 40 (Supplement), S550–S566. https://www.ncbi.nlm.nih.gov/pmc/articles/PMC2921187/
- Sahlqvist, S., Song, Y., & Ogilvie, D. (2012). Is active travel associated with greater physical activity? the contribution of commuting and non-commuting active travel to total physical activity in adults. Preventive Medicine, 55(3), 206–211. https://doi.org/10.1016/j.ypmed.2012.06.028
- Sahlqvist, S., Goodman, A., Cooper, A. R., & Ogilvie, D. (2013). Change in active travel and changes in recreational and total physical activity in adults: Longitudinal findings from the iConnect study. International Journal of Behavioral Nutrition and Physical Activity, 10(1), 28. https://doi.org/10.1186/1479-5868-10-28
- Thomas, F. M. F., Charlton, S. G., Lewis, I., & Nandavar, S. (2021). Commuting before and after COVID-19. Transportation Research Interdisciplinary Perspectives, 11, 100423. ISSN 2590-1982. https://doi.org/10.1016/j.trip.2021.100423
- Verplanken, B., Walker, I., Davis, A., & Jurasek, M. (2008). Context change and travel mode choice: Combining the habit discontinuity and self-activation hypotheses. Journal of Environmental Psychology, 28(2), 121–127. https://doi.org/10.1016/j.jenvp.2007.10.005
- Walliman, N. (2011). Research Methods: The Basics. Taylor and Francis. https://edisciplinas.usp.br/pluginfile.php/2317618/mod_resource/content/1/BLOCO%202_Research%20Methods%20The%20Basics.pdf
- Wood, W., Tam, L., & Witt, M. G. (2005). Changing circumstances, disrupting habits. Journal of Personality and Social Psychology, 88(6), 918–933. https://doi.org/10.1037/0022-3514.88.6.918
- Yang, L., Panter, J., Griffin, S. J., & Ogilvie, D. (2012). Associations between active commuting and physical activity in working adults: cross-sectional results from the commuting and health in Cambridge study. Preventive Medicine, 55(5), 453–457. https://doi.org/10.1016/j.ypmed.2012.08.019