
 ?Mathematical formulae have been encoded as MathML and are displayed in this HTML version using MathJax in order to improve their display. Uncheck the box to turn MathJax off. This feature requires Javascript. Click on a formula to zoom.
ABSTRACT
Public bus transport service operators play a significant role in delivering residents’ mass transit services in cities. Thus, measuring their service performance is very important to know their strengths and weaknesses; meet residents’ rapidly growing mobility needs, and provide quality services. This study aims to assess the service quality of public buses in Addis Ababa, emphasizing on Importance-Performance Analysis model. A questionnaire consisting of thirty-one service quality attributes was used using a seven-point Likert scale. A face-to-face survey was conducted with 500 conveniently selected respondents to grasp passengers’ expectations and perceptions of public buses’ service quality in the city. Hence, based on Importance Performance Analysis, Customer Satisfaction Index, and level of Conformity analysis, 58.1% of the attributes are found under concentrate here and low priority quadrant. Therefore, the study suggests transit service operators and concerned stakeholders should provide urgent attention and allocate their resources to these attributes to improve the quality of service and enhance customer satisfaction with delivered services.
1. Introduction
The transport sector plays a significant role in the country’s overall development (Agarwal, Citation2016). The movement of people and goods mainly depends on transport, and it is also an expressive factor for a government to maintain a robust economy (Iles, Citation2005). Because of its low running and initial cost, route flexibility, and permeability into town and city centers, a conventional bus is the dominant public transport mode in most cities of developing countries (Iles, Citation2005; Verma & Ramanayya, Citation2014). Hence, adequate and proper public bus transit services are vital components for the well-being of growing and expanding urban areas (Murray et al., Citation1998).
However, cities in developing countries face simultaneous urban population growth, urban expansion, and growth in the level of car ownership, which are joined with resource limitations and create a challenging situation for their urban transportation system (Henning et al., Citation2011; Norouzian-Maleki et al., Citation2020). Notably, recently a rapid increase in private vehicles set pressure on most cities of the developing world’s urban transportation system. The growth of using personal cars also aggravated congestion, traffic noise, and air pollution in cities. Besides, it harms public transport operations and the efficiency of transit service agencies (Greene & Wegener, Citation1997). Hence, in such a situation, Government should encourage people to use public transportation by designing various policies (Hafezi et al., Citation2013; Hwe et al., Citation2006). Multiple Governments worldwide have used numerous approaches to promote changing private car users by public transit, such as buses or subways. Promoting public transport is also an effective option to minimize the problems associated with the urban transport system of developing countries. Besides, it significantly contributes to reducing traffic congestion, and air pollution, providing an alternative means of travel, and contributing highly to urban lives worth (Estrada et al., Citation2020). Therefore, policymakers in such cities should quickly design and implement an action emphasizing enhancing the performance of their urban public transport systems commensurate with the problems they faced. It entails the capacity to conduct performance assessments, learn from good practice elsewhere, and identify the areas and scale of potential improvement (Henning et al., Citation2011).
Similarly, due to the above reasons, the urban transport system of Addis Ababa is suffered from various problems, like traffic congestion, traffic jam, and road accidents. Studies have been conducted on the city’s public transport system (Abreha, Citation2007; Berhan, Citation2013; Berhan et al., Citation2013; Gebeyehu & Takano, Citation2007a, Citation2007b; Mihretie, Citation2013); however, most of the studies were focused on measuring the performance of public transport in the city, emphasizing only the Anbessa city bus service in the city. In addition, IPA methodological approach is not yet employed in the above studies and other studies of the city’s public transport system. Therefore, this study is conducted to evaluate the service performance of public transport and determine the strength and weaknesses of the service in the city using the IPA model. The IPA is a strategic tool employed in this study to provide the Government and other transport stakeholders the guideline that rapidly empowers them to comprehend users’ desires and evaluate users’ satisfaction instead of only on performance attributes. Also, understanding users’ satisfaction is vital for local government and transit service enterprises in their planning effort to improve service performance to keep current customers satisfied and to attract more potential customers to the service in the city.
2. Literature review
In literature, scholars prefer to define service quality from an individual customer’s perspective, also known as user-based (Ojo, Citation2019). Service quality is a system to manage business processes to guarantee total satisfaction to the client at all stages (internal and external; Gržinić, Citation2007). It is a method that leads to increased competitiveness, effectiveness, and flexibility of the whole company (Gržinić, Citation2007). Service quality measures how well the service level provided matches customer expectations and delivers quality service means conforming to customer expectations consistently (Parasuraman et al., Citation1985). It also defines the difference between the customers’ expectations about the service performance and their perceptions about the service performed (Mercangöz et al., Citation2012). Thus, knowing the quality of the delivered service is essential for all businesses to guarantee survival and maintain their competitiveness in the market (Allen et al., Citation2020). Besides, various benefits are obtained by investing in the quality of the service by the sectors, such as enhanced customer satisfaction, loyalty, repeat purchase, and long-run profit through positive word of mouth (Muhamad Noor & Nasirun, Citation2013). The quality of bus transit service also depends on numerous factors, such as regular travel time and its consistency, transit waiting time, financial costs, comfort in riding, information, and personal security (Cassetta & Cartenì, Citation2014). There is continuing debate regarding the scientific society’s best quality definition and its measure. It is mainly acknowledged that service quality is intrinsically connected to the user (Cassetta & Cartenì, Citation2014; Parasuraman et al., Citation1994).
In doing so, the quality of the services provided should be measured beforehand to identify their strengths and weaknesses. Works of literature show various approaches to measuring service quality and customer satisfaction. For instance, the Service Quality Index (SQI) was used to measure quality based on customers’ judgments rating the service’s quality attributes (Eboli & Mazzulla, Citation2009). The Customer Satisfaction Index (CSI) is also employed to measure customer satisfaction with the quality of services based on customers’ judgments conveyed through a numeric (Eboli & Mazzulla, Citation2009; Putra et al., Citation2014). SERVQUAL, also developed by (Parasuraman et al., Citation1985), is another common and widely used approach to measure the actual or perceived service quality and the customer perceptions of the service delivered (Parasuraman et al., Citation1985; Randheer et al., Citation2011; Sam et al., Citation2018). TRANSQUAL and SERVPERF are also used to measure service quality in public transport services related to SERVQUAL (Haron et al., Citation2013; Yuda Bakti & Sumaedi, Citation2015). IPA is also one of the marketing research techniques that investigate customers’ perception of product or service quality attributes. It is employed to examine clients’ satisfaction with a product or service by comparing expectations and performance level of service quality attributes. Several practitioners and researchers have used IPA to identify the most vital performance factors in customer satisfaction surveys (Allen et al., Citation2020; Grujičić et al., Citation2014; Haron et al., Citation2015; John & John, Citation1977).
3. Materials and method
3.1. Study area
Addis Ababa is the capital city of Ethiopia. Geographically it is located at the country’s center at the height of 2,400 m above mean sea level with rolling hilly topography. The city is spread over an area of 527 sq. km. Further, the city is divided into ten sub-cities and 116 woredas levels. Public transit service is offered by state-owned buses, such as Anbessa city bus, Sheger city bus, Public Service Employees Transport bus, and Light Rail Transport. Besides privately owned Minibus taxis, various types of small taxis, and Higher buses are also operated to provide public transport services in the city. But the focus of this study is road-based public bus transport to the city (i.e. Anbessa bus, Sheger bus, and PSETSE).
3.2. Data collection method
The study has used a multistage sampling method to reach actual respondents for the study. First, stratified sampling was employed to select terminals, and then systematic sampling was used to choose the route lines from terminals chosen for the study. Last, using the convenience sampling method data was collected from 500 passengers while traveling on the selected bus route line. The survey was conducted from December 2019 to January 2020. A questionnaire was used to collect data from bus passengers. The first section of the questionnaire included questions about passengers’ socio-economic and travel behavior, such as gender, age, travel purpose, usage frequency, etc. The second section contains 31 attributes concerning passengers’ expectations and perceptions of public bus service quality using a seven-point Likert scale ().
Table 1. Service quality attributes used for the study.
3.3. Data analysis method
3.3.1 Level of conformity analysis (LoC)
The level of conformity is an assessment of the relationship between the rate of performance and the importance score of variables, which aids in determining which variables require immediate attention to improve service quality (Santoso et al., Citation2011). It is calculated by combining the attribute performance score with the importance value of each variable based on user feedback.
The conformity level indicates how well an attribute’s performance meets the user’s expectations. Thus, LoC of 1(100%) indicates that the performance level of the attributes could satisfy users’ expectations; LoC of less than 1(100%) indicates that the performance level of the attributes must meet users’ expectations. In comparison, if the LoC is more than 1 (100 percent), the attribute performance level has exceeded the users’ expectations. Therefore, this study conducts a conformity analysis between the importance and performance attributes of service quality.
3.3.2 Customer satisfaction analysis
The Customer Satisfaction Index (CSI) is a method for determining customer satisfaction with a service. Supranto came up with the idea (1997). It can use the average level of expectation and performance of each service item to calculate CSI. It allows for a clear and systematic estimate of service in terms of customer satisfaction using the score provided by the customer.
Consequently, this study used CSI to compute the level of users’ satisfaction with the city’s public bus service, calculated using the satisfaction rates expressed by users, weighted based on the importance rates, using the following formula:
in which:
is the mean of the satisfaction rates expressed by users on the service quality k attribute
(Importance weight) is a weight of the k attribute, calculated based on the importance rates conveyed by users. Precisely, it is the ratio between the mean of the importance rates expressed by users on the k attribute and the sum of the average importance rates of all the service quality attributes (Eboli & Mazzulla, Citation2009). Finally, the value of CSI can be inferred from the categories proposed by (Supranto, Citation1997) ().
Table 2. CSI categories.
3.3.3. Importance performance analysis
IPA is a method for determining the importance and performance of attributes and applying the results to management decisions, including product development and positioning. Martilla and James proposed it in a 1977 Journal of Marketing article, and it has subsequently been used in a variety of scenarios. The IPA technique’s fundamental idea is to examine the importance of a feature and the degree to which customers are satisfied. Therefore, as a tool for evaluation, IPA visually depicts the relationship between the importance and performance of service quality attributes.
Importance and performance statistics are represented on a couple of coordinate axes, as illustrated visually, with ‘importance’ on the Y-axis and ‘performance’ on the X-axis (John & John, Citation1977). The information is then divided into four quadrants, as seen in . Every quadrant depicts the importance and performance of a service component that customers have assigned to it. Finally, the graphical results aid Government authorities/agencies in identifying priority areas for service quality improvement ().
Figure 1. The IPA map.
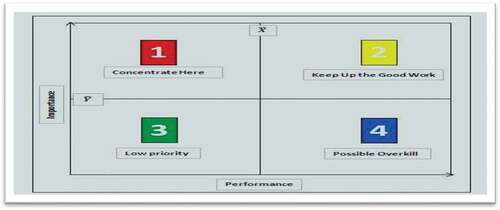
Table 3. The Quadrant’s Interpretation.
The following is a list of the stages involved in IPA analysis:
Stage 1. Compute the average level of importance for each element i
and performance for each element i
Where n is the number of respondents
Stage 2. Compute the average level of importance for the whole items
and performance for the whole items
Where P is the number of items i
4. Results and discussion
4.1. Reliability test
The reliability test of Cronbach’s Alpha is used to evaluate the internal consistency of the questionnaire. Thus, the Cronbach’s Alpha for satisfaction and importance attributes are 0.859 and 0.939; receptively, both are (> 0.7), which shows that all statements are exceeding the α value of 0.7 (i.e. all attributes are reliable) ().
Table 4. Reliability statistics.
4.2. Demographic characteristics of sample
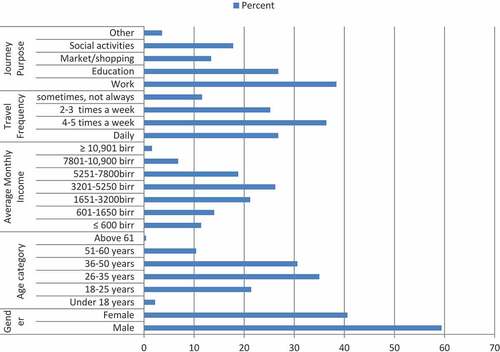
The sample group was 59.4% male and 40.6% female. A significant proportion of the participants (35.0%) were under the age category of 26 until 35 years old, and 30.6% were between 36 to 50 years old. Concerning employment status, the majority (38.8%) was work under private institutions, and 28.8% were engaged in their business activities. Summary statistics for other variables are presented in .
Figure 2. Socio-demographic profile of the sample.
4.3. Level of conformity analysis
Hence, in this study, a conformity analysis between the importance and performance attributes of service quality has been conducted and shown in .
Table 5. Conformity assessment of importance and performance level of attributes.
As shown above, LoC was the highest for the cleanliness of the bus exterior with 102.4% and the lowest for the availability of services at night 58.1%. Besides, out of 31 quality attributes used to assess the conformity level,13 attributes have the highest conformity score (i.e. LoC > 80%), which means these attributes meet users’ expectations very well, and one attribute (i.e. cleanliness of buses exterior) was beyond the expectation of users. The other 17 attributes are found between LoC 60–80%, which is good; while one attribute (i.e. availability of service at night) was less than 60% which is not good enough to meet users’ expectations.
Overall, the average LoC of the service quality attributes was 76% (< 100%), which means that public transport users in the city have not been fully serviced per their expectations. Furthermore, it can be concluded that based on conformity analysis; the overall attributes are entered in the category of ‘reasonably satisfactory’ (LoC<100%).
4.4. Customer satisfaction analysis
Next, the study could provide the result for passengers’ satisfaction levels towards public transport service of the city from CSI analysis. Based on the analysis, the overall CSI score for public transport service in Addis Ababa is 0.542 (54.2%). Therefore, it has been concluded that passengers of public buses are quietly satisfied with the public bus transport service in the city ().
Table 6. CSI analysis results.
4.5. Importance performance analysis
Lastly, the IPA analysis was carried out by calculating each service quality attribute’s value of importance and performance level. Based on the result, the IPA matrix intersection is made available using the mean level of performance at (3.8) and the mean level of importance (5). shows the results of the IPA analysis.
Figure 3. IPA result.
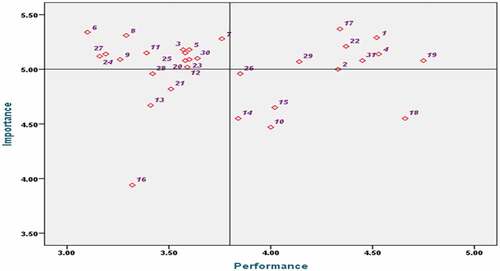
As shown above, the first quadrant contains 14 service attributes such as;
service frequency
availability of service on weekends/holidays
availability of services at night
convenient of the bus for people including the elderly, disabled, pregnant
punctuality of bus(runs on schedule)
waiting time at the bus stop
bus crowding level
comfort while riding the service
availability of timetable/map on bus/ bus stop
security against crime on a bus
security against crime at bus stops and station
staff behavior (driver and conductors)
easiness to buy the ticket
accessibility of buses for people with disability in need of improvements because they have high importance but relatively low performance.
On the other hand, eight services attribute such as;
◦ service coverage
◦availability of bus stops and their proximity
◦total hour of service
◦cleanliness of bus interior, seats, and windows
◦ticket cost/fare
◦safety and competence of drivers
◦ease of service use and image of the company was found under the second quadrant.
The attributes in the second quadrant represent the service’s strength; therefore, the operators should maintain a high level of quality for these attributes for achieving a competitive advantage. Last, the other service attributes, included in the last two quadrants, can be considered service aspects with a low priority and possible overkill. So, the enterprise should not focus its efforts on these attributes. Notably, transit service providers in developing countries like Addis Ababa identified the areas where policy-based actions will likely result in the most significant improvement in such aspects linked to variables under quadrant one.
To sum up, the contribution lies in this study by comparing results for CSI with the IPA method and Conformity analysis of the attributes. Hence, CSI and IPA model uniformly identifies the primary quality attributes that need the main priority for improvement under the first quadrant and attributes the second priority in the third quadrant. Similarly, conformity analysis for the whole attributes is found between 60–80%, which shows users did not get their expectations of the city’s quality of public transport service. Therefore, the result for CSI, IPA, and CR confirmed that the following attributes () are the significant attributes that need urgent attention by the service providers and the concerned stakeholders to improve public bus transport service in the city ().
Table 7. Comparison of IPA and CSI results.
5. Conclusion
Specifying the strength and weaknesses of the city bus service has made an essential contribution to the government authorities. Therefore, in this study, a survey was made to know travelers’ expectations and perceptions of the quality of public bus transit service in the city and strategically prioritize the area for improvement, resulting from 500 respondents.
The study used the IPA, CR, and CSI methods to analyze the data and results to provide the Government authorities the guideline that rapidly empowers them to comprehend users’ demands and evaluate user satisfaction instead of only on performance attributes. Thus, 58.1% of the attributes are found under quadrants one and three based on the outcomes. They need immediate attention by managers of the enterprise and concerned stakeholders to improve the quality of delivered service and enhance customer satisfaction with public transport service provision.
Moreover, IPA is the strategic tool for the Government authorities or researchers to evaluate the service quality by providing guidelines to prioritize the focus area for improvement. Even though obtaining good responses from 500 participants, it would be better for research to make it more generalized to further the entire population. Given the above, the study suggests that managers and decision-makers use the IPA findings to prioritize their resources, manage costs related to qualities in quadrants three and four, and reassess their resources.
6. Contribution of the study
It is widely acknowledged that service quality is a multi-dimensional concept; nevertheless, there is no clear agreement on the number and types of service quality dimensions (Brady & Cronin, Citation2001). Service quality characteristics should be determined from the perspectives of culture, service, and country, according to recent advances in the service management literature(Micuda & Cruceru, Citation2010; Van Duong et al., Citation2004). As a result, this occurrence emphasizes the importance of adopting a service quality model that is well-suited to the public transportation systems of developing countries such as Ethiopia’s Addis Ababa.
Therefore, after proving the service quality model based on the context of public transportation services in Addis Ababa, i.e. linking the Customer Satisfaction Index, level of Conformity Analysis to the Importance Performance Analysis model, the findings of this study offered the theoretical and methodological contribution. Furthermore, other researchers can utilize this model to investigate the quality of service and customer satisfaction in various modes of public transportation as well as other service sectors that are relevant to the city’s setting, such as banks, hospitals, and schools.
Furthermore, this research has organizational ramifications. Public transportation companies must stress the aspects of performance and expectation data set based on the IPA model to improve service quality. Various public transportation companies can also utilize the IPA model to assess customer satisfaction and identify essential service characteristics. The outcome can also be used by the management, decision-makers, and concerned stakeholders to monitor service performance and progress upgrading programs.
7. Limitations of the study
Even though this study has confirmed the IPA model in the city’s public transportation system, the author is aware that it has some limitations. To begin, the research used cross-sectional data to determine the model’s stability, which couldn’t see at a later time. As a result, the study’s author proposed that longitudinal data be used in future studies. Another drawback of this research was that it was based on the city’s only road-based public bus system. There are, however, many types of public transportation companies. To reduce this constraint in the future, the IPA model should be evaluated on the city’s various public transportation systems, such as LRT, private, and public transportation, among others.
Informed consent
The research involved human participants, who were informed about the purpose of the study and that their participation is voluntary.
Disclosure statement
No potential conflict of interest was reported by the author(s).
Data availability statement
Some or all data, models, and/or codes that support the findings of this study are available from the corresponding author upon reasonable request.
Additional information
Funding
References
- Abreha, D. A. (2007). Analyzing public transport performance using efficiency measures and spatial analysis; the case of Addis Ababa, Ethiopia. International Institute for Geo-Information Science and Earth Observation.
- Agarwal, S. (2016). Measuring the efficiency of public transport sector in India. An Application of Data Envelopment Analysis. https://doi.org/10.21648/arthavij/2009/v51/i2/115392
- Allen, J., Bellizzi, M. G., Eboli, L., Forciniti, C., & Mazzulla, G. (2020). Identifying strategies for improving airport services: Introduction of the Gap-IPA to an Italian airport case study. Transportation Letters, 1–11. https://doi.org/10.1080/19427867.2020.1861506
- Berhan, E. (2013). Performance analysis and route design of Addis Ababa public bus transport. Addis Ababa, Ethiopia. AAiT.
- Berhan, E., Beshah, B., & Kitaw, D. (2013). Performance analysis on public bus transport of the city of Addis Ababa. International Journal of Computer Information Systems and Industrial Management Applications, 5, 2150–7988. www.mirlabs.net/ijcisim/index.html
- Brady, M. K., & Cronin, J. J. (2001). Some new thoughts on conceptualizing perceived service quality: A hierarchical approach. The Journal of Marketing, 65(3), 34–49. https://doi.org/10.1509/jmkg.65.3.34.18334
- Cassetta, E., & Cartenì, A. (2014). A quality-based approach to public transportation planning: theory and a case study. International Journal of Sustainable Transportation, 8(1), 84–106. https://doi.org/10.1080/15568318.2012.758532
- Eboli, L. A., & Mazzulla, G. (2009). A new customer satisfaction index for evaluating transit service quality. Journal of Public Transportation, 12(3), 21–37. https://doi.org/10.5038/2375-0901.12.3.2
- Estrada, M., Salanova, J. M., Medina-Tapia, M., & Robusté, F. (2020). Operational cost and user performance analysis of on-demand bus and taxi systems. Transportation Letters, 1–14. https://doi.org/10.1080/19427867.2020.1861507
- Gebeyehu, M. A., & Takano, S. (2007a). Diagnostic Evaluation of Public Transportation Mode Choice in Addis Ababa. Journal of Public Transportation, 10(4), 27–50. https://doi.org/10.1021/ic50162a028
- Gebeyehu, M. A., & Takano, S. (2007b). Evaluation of bus routes performance in the city of Addis Ababa Using Stochastic Frontier model. Infrastructure Planning Review, 24(3), 447–457. https://doi.org/10.2208/journalip.24.447
- Greene, D. L., & Wegener, M. (1997). Sustainable transport. Journal of Transport Geography, 5(3), 177–190. https://doi.org/10.1016/S0966-6923(97)00013-6
- Grujičić, D., Ivanović, I., Jović, J., & Dorić, V. (2014). Customer perception of service quality in public transport. Transport, 29(3), 285–295. https://doi.org/10.3846/16484142.2014.951685
- Gržinić, J. (2007). Concepts of service quality measurement in hotel industry. Economic Thought and Practice-University of Dubrovnik, 1(110), 81–89.
- Hafezi, M. H., Shokri, F., & Falamarzi, A. (2013). A novel method for travel system patterns. International Journal of Transportation Engineering, 1(2), 93–100.
- Haron, S., Noor, S. M., Farhan, A., & Sadullah, M. Proceedings of International Conference on Advances in Computing. Advances in Intelligent Systems and Computing 2013, 174 AISC(July).
- Haron, S., Noor, S., & Sadullah, F., “New dimension of bus service quality performance measure,” In Proceedings of International Conference on Advances in Civil and Environmental Engineering (ACEE 2015) 2015, no. July, p. F–54.
- Henning, T., Essakali, M. D., & Oh, J. E. (2011). A framework for Urban transport benchmarking. International Bank for Reconstruction and Development/The World Bank, 78, 12–18. https://openknowledge.worldbank.org/handle/10986/12847
- Hwe, S. K., Cheung, R. K., & Wan, Y. W. (2006). Merging bus routes in Hong Kong’s central business district: Analysis and models. Transportation Research Part A: Policy and Practice, 40(10), 918–935. https://doi.org/10.1016/j.tra.2006.03.005
- Iles, R. (2005). Public transport in developing countries. Elsevier Ltd.
- John, A. M., & John, C. J. (1977). Importance-performance analysis. Journal of Marketing, 41(1), 77–79. https://doi.org/10.1177/002224297704100112
- Mercangöz, B. A., Paksoy, M., & Karagülle, A. Ö. (2012). Analyzing the service quality of a fast ferry company by using servqual scores: A case study in Turkey. International Journal of Business and Social Science, 3(24), 84–89. www.ijbssnet.com
- Micuda, D., & Cruceru, G. H. E. O. R. G. H. E. (2010). Testing SERVQUAL dimensions on the Romanian banking sector. In Proceedings of the International Conference on RISK MANAGEMENT, ASSESSMENT and MITIGATION, (pp. 329–334).
- Mihretie, M. (2013). Urban public bus transport service quality in the city of Addis Ababa case study: Anbessa City Bus Enterprise (ACBE). Addis Ababa University. http://files/48/Mihretie-Urban-Public-Bus-Transport-Service-Quality-in-the-pdf
- Muhamad Noor, S., & Nasirun, N. (2013). Service quality and customer satisfaction in a natural monopoly company. Tidsskrift for den Norske laegeforening, 83, 61–68. https://doi.org/10.1007/978-981-4585-45-3
- Murray, A. T., Davis, R., Stimson, R. J., & Ferreira, L. (1998). Public transportation access. Transportation Research Part D: Transport and Environment, 3(5), 319–328. https://doi.org/10.1016/S1361-9209(98)00010-8
- Norouzian-Maleki, P., Izadbakhsh, H., Saberi, M., Hussain, O., Jahangoshai Rezaee, M., & GhanbarTehrani, N. (2020). An integrated approach to system dynamics and data envelopment analysis for determining efficient policies and forecasting travel demand in an urban transport system. Transportation Letters, 1–17. https://doi.org/10.1080/19427867.2020.1839716
- Ojo, T. K. (2019). Quality of public transport service: An integrative review and research agenda. Transportation Letters, 11(2), 104–116. https://doi.org/10.1080/19427867.2017.1283835
- Parasuraman, A., Zeithaml, V. A., & Berry, L. L. (1985). A conceptual model of service quality and its implications for future research. Journal of Marketing, 49(4), 41. https://doi.org/10.2307/1251430
- Parasuraman, A., Zeithaml, V. A., & Berry, L. L. (1994). Alternative scales for measuring service quality: A comparative assessment based on psychometric and diagnostic criteria. Journal of Retailing, 70(3), 201–230. https://doi.org/10.1016/0022-4359(94)90033-7
- Putra, A., Jinca, M. Y., Bambang, R., & Agus, T. M. (2014). The satisfaction analysis for the performance of public transport Urban areas. International Refereed Journal of Engineering and Science, 3(8), 38–44. www.irjes.com
- Randheer, K., AL-Motawa, A. A., & Vijay, J. P. (2011). Measuring commuters’ perception on service quality using SERVQUAL in public transportation. International Journal of Marketing Studies, 3(1), 21–34. https://doi.org/10.5539/ijms.v3n1p21
- Sam, E. F., Hamidu, O., & Daniels, S. (2018). SERVQUAL analysis of public bus transport services in Kumasi metropolis, Ghana: Core user perspectives. Case Studies on Transport Policy, 6(1), 25–31. https://doi.org/10.1016/j.cstp.2017.12.004
- Santoso, I., Mulyarto, A. R., & Dan Maharani, S. (2011). Persepsi Konsumen Terhadap Kualitas Bakpao Telo dengan Metode Importance performance analysis. Jurnal Teknologi Pertanian, 12(1), 23–30.
- Supranto, J. (1997). Measurement of customer satisfaction. PT, Rineka Cipta.
- Van Duong, D., Binns, C. W., Lee, A. H., & Hipgrave, D. B. (2004). Measuring client-perceived quality of maternity services in rural Vietnam. International Journal for Quality in Health Care, 16(6), 447–452. https://doi.org/10.1093/intqhc/mzh073
- Verma, A., & Ramanayya, T. V. (2014). Public transport planning and management in developing countries. CRC press. Taylor & Francies Group.
- Yuda Bakti, I. G. M., & Sumaedi, S. (2015). Quality paper P-TRANSQUAL: A service quality model of public land transport services. International Journal of Quality and Reliability Management, 32(6), 534–558. https://doi.org/10.1108/IJQRM-06-2013-0094