
 ?Mathematical formulae have been encoded as MathML and are displayed in this HTML version using MathJax in order to improve their display. Uncheck the box to turn MathJax off. This feature requires Javascript. Click on a formula to zoom.
ABSTRACT
As contemporary colleges and universities continue to undergo unprecedented growth, more and more students commuting to campus face parking and physical infrastructural connectivity problems. Using the case of a US college campus, this paper identifies areas in which physical infrastructural connectivity limits students’ ability to commute to campus, either due to gaps in the network or lack of awareness of the network. Graph theory application was used to gauge the overall connectivity of the sidewalk, bike lane, and bus route networks available to students at the university. Through GIS mapping, relationships between these networks were identified, as well as gaps in these networks. In addition, a survey of students’ commuting patterns was performed to identify how students travel to campus and their overall familiarity with the alternative transportation networks. Insights from this study could enhance planning for inter-modal connectivity and make student commuting safer, more accessible, more eco-friendly, and more convenient even as the student population continues to increase.
Introduction
Around the United States, built-up areas, called college towns, often exist around higher education institutions. These “college towns’ cause seasonal population surges and environmental impacts, and thus, they necessitate balancing the needs of the colleges and host towns. In addition, students create a large influx of bodies, money, and ideas into the city each year. However, as the populations within these cities increase, authorities often struggle with effective mobility systems. Residents’ transportation needs may also change, necessitating infrastructure and facilities planning to ensure city and college officials meet the mobility needs of the growing population. In the case of colleges, six types of basic infrastructure are affected by population increases: physical infrastructure, digital infrastructure, emotional infrastructure, innovative academic infrastructure, intellectual property infrastructure, and networked industry infrastructure (Aithal & Shubhrajyotsna Aithal, Citation2019). First, physical infrastructure refers to the long-term physical structures that create a campus. It includes buildings, classrooms, offices, roads, sidewalks, bike lanes, residential areas, shops, recreation centers, and more. In other words, these are the physical things that make a college function as an institute of higher education that attracts and retains students. On the other hand, digital infrastructure speeds up the learning processes and administrative work. It includes the internet, a web page, WIFI, and the ability for those who need to communicate to do so. Emotional infrastructure on college campuses pertains to having strong leadership, communication, and cherished traditions. It creates a sense of place or emotional connection to a place for those that experience it. Fourth, innovative academic infrastructure is the purpose of higher education - learning. It encompasses the course work, subject matter, planning, and education, which are at the heart of higher education. This infrastructure creates a curriculum where students and faculty can thrive and achieve excellence. Fifth, intellectual property infrastructure often includes targeted research goals universities set for themselves and their faculties. Often, research impact and intellectual property linked to them form vital parts of ranking universities. Research achievements are highly revered and can enhance the value of a university as it attempts to achieve excellence. Lastly, network infrastructure ensures that a university connects with other educational institutions, businesses, alumni, and other groups that foster collaborative success. It allows the additional infrastructure to succeed, enabling connections between emotional and academic infrastructure.
This study looks only at the physical infrastructure that facilitates students’ commute, to and from campus, including bike lanes, sidewalks, roads, and bus routes (Colorado, Citation2020). As colleges continue to grow, the ability for students to travel without personal vehicles becomes increasingly important. Using a case study approach, students’ commuting patterns to campus and their overall familiarity with alternative transportation networks were surveyed. By analyzing the collected data, the study identified areas in which connectivity is limiting students’ ability to commute to campus, either due to gaps in the network or lack of awareness of the network. In addition, existing multimodal network infrastructure within the campus was evaluated by using graph theory applications to gauge the comprehensive connectivity of the sidewalk, bike lane, and bus route networks available to students. Finally, GIS mapping was used to identify relationships and gaps within these networks and recommendations made to improve mobility and connectivity metrics for students on campus. The outcome helps reduce the demand for parking around campus and promotes environmentally-friendly commuting practices.
A case study from the US
Tuscaloosa, Alabama, home to the University of Alabama, USA, and its student body, has, in recent times, experienced unprecedented growth. In 2010, 30,232 students enrolled at the University (OIRA (Office of Institutional Research and Assessment), Citation2021), while the city had 90,468 residents (U.S. Census Bureau, Citation2021). These numbers have increased rapidly as the University’s student population grew from 26,449 in 2008 to 37,946 in 2018 (Enoch, Citation2018). The rising population witnessed over the last decade necessitated additional staff positions, on-campus resources, and off-campus housing. For example, over 6,045 new units were built between 2011 and 2018 in Tuscaloosa, making housing a significant developmental issue (Tuscaloosa, Citation2018). Simultaneously, the demand for on-campus parking facilities has grown in conjunction with these new housing developments as more and more students need to reach campus.
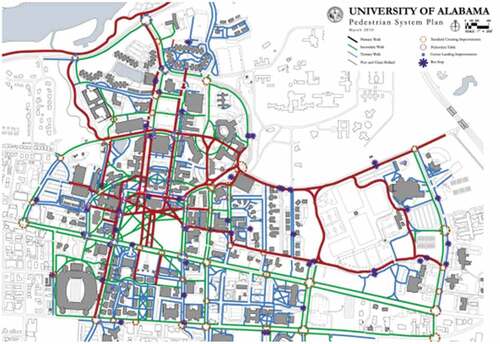
The University of Alabama Pedestrian System Plan, published in 2010, outlines the structure of multimodal transportation networks on campus (UAPSP (University of Alabama Pedestrian System Plan), Citation2018). It also classifies tiers of ‘walks’ and prioritizes future sidewalk connections. These tiers are based on the most-used corridors by students and the highest priority connections. This method of visually demonstrating connectivity is depicted in below, in which critical connectors are shown in red and denominated as Primary Walks. These bring pedestrians through significant parts of campus and presumably through foot traffic. The green paths, named Secondary Walks, denote vital connections between primary walks and areas of interest. Lastly, tertiary walks fill in the gaps of the other two levels of walks and may not see as much traffic as the rest. From this map, it can be noted that the University of Alabama campus is relatively well connected using sidewalks. There are sidewalks, or plans for sidewalks, along major roads and near areas of interest; this provides students a safe way for mobility around campus. However, once the sidewalks reach the end of campus, they lose some of that connectivity.
Figure 1. Pedestrian System Plan, Modified (UAPSP (University of Alabama Pedestrian System Plan), Citation2018).
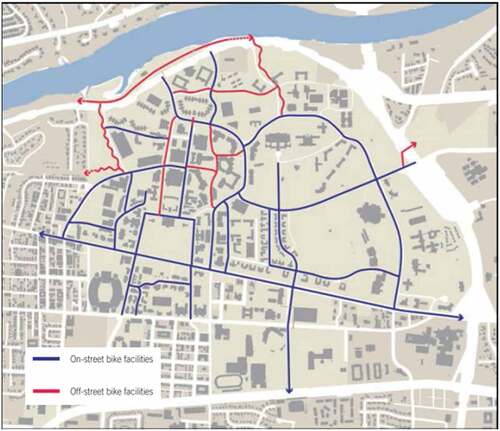
In below, one can also see the University of Alabama bicycle network plan consisting of primarily on-road bike lanes, stretching near major campus attractions and providing students with mobility via bicycle. Still, there is very little connectivity for bicycles within the city once riders leave campus. Although there are no maps that demonstrate these networks and connections via bicycle or sidewalk, this does not mean the city has zero bike or pedestrian lanes.
Figure 2. University of Alabama bicycle network plan (ECA (Existing Conditions Assessment: Transportation and Mobility), Citation2019).
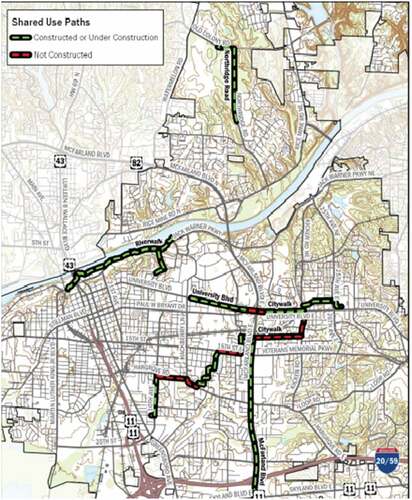
The University of Alabama bicycle network plan was published as part of the more extensive comprehensive planning process in the city of Tuscaloosa’s most recently revised draft of its Existing Conditions Assessment document of February 2019. This document includes the current bicycle network, sidewalk, transportation connectivity, and inherent gaps. However, although the University’s area of the plan shows higher levels of connectivity and mobility with many sidewalks, bike lanes, and bus routes, the city remains less connected. In addition, below shows shared-use paths that the city has either constructed or plans to construct. It also shows a largely disconnected network that could pose challenges to the mobility of residents. The Existing Conditions Assessment document also includes a sidewalk inventory created in 2015 and a short description of the public transportation system.
Figure 3. Shared Used Paths in Tuscaloosa (ECA (Existing Conditions Assessment: Transportation and Mobility), Citation2019).
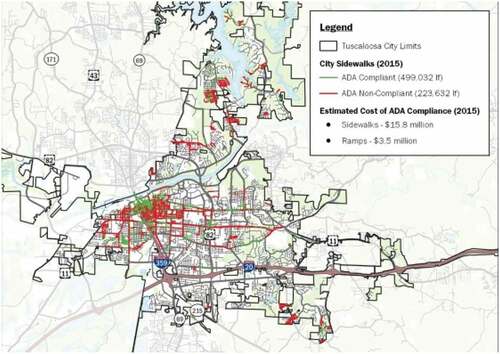
depicts the extent of the city’s sidewalk inventory, yet it does not include most parts of the University of Alabama’s campus. The public transportation system portion references the city’s Trolley and its services which offers only two bus routes (the University Shuttle Route and the V.A./University Route). Altogether, the University of Alabama and the surrounding Tuscaloosa area are responsible for many commuters to and from campus every day. These commuters require safe, connected infrastructure such as sidewalks, bike lanes, and bus routes to make their commutes. The lack of connectivity creates commuting problems and establish disinterest or inability to commute to and from the university campus. One of the critical points of the Bicycle and Pedestrian Plan section of the document was a need to increase connectivity of the multimodal transportation network.
Figure 4. Sidewalk Inventory from the (ECA (Existing Conditions Assessment: Transportation and Mobility), Citation2019).
This study sought to determine if, and how, multimodal transportation infrastructure, such as sidewalks, bike lanes, and bus routes, limits students’ access to the University of Alabama’s campus. Specifically, it explores how infrastructure connectivity on campus impacts mobility, and discusses the policy implications and a way forward.
Methods
The study area is the University of Alabama campus and the immediate surrounding area within Tuscaloosa (). The University area is bordered to the west by Lurleen Wallace Boulevard, which contains six lanes of traffic, and to the east by McFarland Boulevard, also with six lanes. The lanes present challenging barriers to walking and biking as they are high-traffic and high-speed areas. The University area is also bound to the north by the Black Warrior River; for that reason the study utilized only census tracts on the south of the river. Using the census tracts near the University area, the study confined the focus area to places where biking, walking, and transit routes were the most feasible. Infrastructural networks around the University of Alabama, like sidewalks, bike lanes, and bus routes, often change following the development of new housing units. The University’s Off Campus Resources, an online student housing resource (University of Alabama Off Campus Resources, Citation2022), was used to identify off-campus housing locations. Details on housing information, together with newly mapped sidewalks, bike lanes, and transit networks, helped identify places where students may live in high numbers and where network connectivity may be more required.
Figure 5. A map of the study area.

Using a data-driven approach, which allowed investigating the impacts of connections in real-time, network connectivity metrics were used to identify the degree of connectivity within the networks and identify any critical gaps. The metrics and the resulting map aided the identification of places where connections would have the most impact. The final part of this study involved a survey of students at the University to identify their commuting patterns within and around campus. The survey covered many aspects of a student’s commute, including traveling time, methods used, and knowledge of the existing infrastructure. The study results provided insights to corroborate the areas of interest identified by the mapping procedure and the connectivity metrics, providing a data-driven and holistic approach to the overall connectivity of the multimodal transportation network.
Data collection involved two approaches: First, a computer mapping software with aerial imagery, Google Earth, was used to identify bus stops, sidewalks, and bike lanes. This step was in conjunction with the above maps of the current networks. For sidewalks, the Tuscaloosa Transit Plan sidewalk map was the primary reference point. The Google Earth aerial imagery was used to identify for any additional sidewalks that were not on the map from the City of Tuscaloosa. After that, the latitude and longitude of the beginning and end of each sidewalk segment were measured and recorded using Excel. These were subsequently transferred to the ArcGIS software. A similar process was used to map the bus routes using the University's transit website (Crimson Ride, Citation2021) and the City of Tuscaloosa Transportation department website (Tuscaloosa (Transit Authority), Citation2021). These websites also provided mobile apps, Pasio GO! for the Crimson Ride and TransLoc for the Tuscaloosa Trolley, that were used as reference material. The bus stops’ latitude and longitude were also recorded and placed into an Excel document for later analysis in ArcGIS. The above figures from the Tuscaloosa Framework Plan served as references for locating each lane’s starting and ending point for bike lanes.
The bike lanes were verified by using aerial imaging; as per previous steps, the lanes’ latitude and longitude were also recorded and placed into an Excel document for later analysis in ArcGIS. Next, a column denoting on-street or off-street facilities was added to help differentiate the varying levels of safety that the methods provide for bike lanes. Finally, any locations that were not immediately apparent from the aerial imagery were field verified to ensure that the infrastructure existed. The GIS data was collected from the United States Census Bureau – this included files for the street network in Tuscaloosa and the demographics within the chosen census tracts from the most recent years available. However, due to the late arrival of the 2020 census numbers, this study utilized 2010 numbers. After compiling the census tracts, the apartment complexes’ location on the University's off-campus housing website was found using Google Earth and recorded in an Excel sheet. Finally, a base map in ArcGIS was used to visualize locations on the map.
Connectivity analysis
Each data type had a layer; this involved using ArcMap’s network analyst functions to create routes and provide an analytical basis. From these networks, the study identified the location of missing sidewalks and bike lane connections, along with crosswalk and condition information, to see if and where access to transit stops is being prevented. Thereafter, the graph theory was used to determine the degree of centrality for nodes in the networks and the connectivity of the multimodal transportation network (Mishra et al., Citation2012). Bike lanes, sidewalks, and bus routes were considered as independent and continuous networks. The degree, beta, gamma, degree, and alpha values associated with each network were calculated using graph theory applications.
Graph theory applications in connectivity analysis
There are different approaches for defining the connectivity of transportation networks. One such method involves using graph theory to measure the connectivity of varying transportation networks via a series of equations focusing on nodes, links, and loops. The graph theory also recognizes and describes the geometric nature of the phenomenon in a myriad of fields such as mathematics, science, social sciences, and more. Originally stemming from Leonhard Euler’s attempt to solve a transportation problem, graph theory identifies the number of edges or links, vertices or nodes, and loops in a network. The following equations and values demonstrate this theory.
The above equation identified the number of cycles in a network, where µ is the cyclomatic number, e represents edges (links), p, sub-graphs, and v, the vertices (nodes). Focusing on the number of cycles or loops a network forms could help identify the degree of connectedness. This idea could also apply to urban planning and transportation network systems (Derrible & Kennedy, Citation2011).
When using graph theory to define connectivity, using links to represent terminals and intersections as nodes and the ‘in-betweens’ visually becomes increasingly essential. A few indices can help measure the connectivity displayed by the graphic representation from those connectivity levels. While there are indices for measuring the network’s cost or spatial efficiency, one of the most detailed indices to measure connectivity alone is alpha, beta, gamma, and degree. While only using links, nodes, and loops, these simple yet effective measures can efficiently identify general connectivity in planar transportation networks. The alpha index measures the ratio of loops currently in a network to the number of loops that are possible in that network. The range of possible alpha values ranges from 0 to 1, with 1 being complete connectivity. EquationEquation 2(2)
(2) shows the formula for calculating alpha:
The beta index is calculated similarly and finds the level of connectivity by finding the ratio of links (e) to nodes(v) in the network. The higher the resulting value for the beta coefficient, the higher the degree of connectivity is. In this, a value of one or greater indicates there is at least one loop in the network, while a value less than one does not. The equation for calculating the beta coefficient can be seen below:
The gamma index measures the ratio of links to possible links, with a value of 1 being completely connected and 0 means ‘not connected’. EquationEquation 4(4)
(4) shows the formula for calculating the gamma index:
Lastly, the degree coefficient measures the number of links connected to a node and can help to represent the importance or ‘centrality’ of a node. This coefficient can help identify hubs or other areas of importance within transit systems. The higher the degree of a node, the more central it is to the network. However, this would be in contrast to terminal nodes, at the end of links or end of a network, which would have a low degree due to the lack of links connected to it. In conjunction with the alpha, beta, and gamma coefficient, this number is a valuable way to measure the connectivity and efficiency of a planar network, such as a sidewalk, bus, or bike lane network (Rodrigue et al., Citation2013; Weber, Citation2016).
Like any scientific study, certain areas require extra attention to ensure the results are accurate and up to date. For example, this study prioritized employing up-to-date data to analyze road and sidewalk, population (for the on-campus residences and more short-term rental options near campus), and housing areas metrics. Although data from the 2020 census was not available, the analysis used subsequent most recent census data from 2010. Confusing infrastructure location data were verified on the field; this helped to address issues around the ages of the aerial imagery and graphics from both the University and the City of Tuscaloosa,
Finally, we conducted a Qualtrics survey to assess opinions of students who regularly commute to the University's campus area. The survey, distributed via online campus student groups, social media posting, and anonymous links sent via email, sought to identify broad patterns in students’ commuting habits by asking them their level of familiarity with the multimodal transportation system and preferred commuting method. Other topics surveyed included students purchases of parking pass for the year, what influenced that decision, and estimates of how much time they spent commuting via each of the networks.
Results
Results of graph theory analysis
shows the results of graph theory applications, which describe the network’s connectivity. The calculation was done using Equationequations 1(1)
(1) –Equation4
(4)
(4) earlier noted in the methods. The three bus networks were evaluated separately, and show that the Crimson Ride system has the highest connectivity, followed by busses serving large apartment complexes. Grouping all bus networks together produces a network with good connectivity, though reflecting the large number of nodes and links of the Tuscaloosa Trolley. Although the sidewalk network contained the greatest number of nodes and links, it was not a single network, but also contained many unconnected subnetworks. For that reason Alpha could not be calculated and Beta and Gamma values are deflated. Three separate bicycle systems were evaluated, with the city bikepath system having the highest connectivity and the UA system the lowest. Despite this, the city systems have relatively few nodes and links and their values reflect the problem of applying these measures to small networks (Weber, Citation2016).
Table 1. Network Connectivity Measures.
The use of the degree measure allows discussion of individual nodes. The most connected node was the bus hub in the U.A. Crimson Ride system (ten connections) and the apartment shuttles (seven connections). However, in the Tuscaloosa Trolley, the downtown bus hub had the highest degree with seven connections. Meanwhile, most nodes in the University campus sidewalk system had four links, particularly near the Quad area and the Shelby Quad Area; this is linked to the geometric nature of the network. In addition, the area near the Ferguson Student Center had four degrees at the corners nearest it. Overall, the sidewalk network was challenging to analyze; most had 4 degrees from each node in the downtown area. However, the degrees vary from 1 to 4 around the rest of the city. The study also observed that the bike lane networks, both within the City of Tuscaloosa and the University's networks, were the least connected.
Survey results
The survey was administered through the University's Qualtrics system from November 2020 to January 2021. Students’ participation rate was low because of the outbreak of the Covid-19 pandemic and the college had closed down unexpectedly. Also, the College’s Institutional Review Board approved the survey questionnaire on condition that participants’ background information be left out.
The first section of the survey focused on commuting methods. The majority of students live off campus. The primary method for traveling to campus is driving, with walking being the second most common method. 12.5% of the responding students utilized apartment shuttles to get to campus. The city's Trolley was not a commuting method utilized by any of the survey takers, but the Crimson Ride was utilized by 3.1% as their primary method. 43.7% of the students had a parking pass, with the locations and quantity of those passes being mapped on the image below. These locations were chosen for proximity to classes, and in-ability to choose other options most commonly.
The demonstrates students’ responses to how much of their commute is spent on each mode of transportation. The most time spent walking during commuting is between 10 and 15 minutes, while the most time spent biking during the commute varied, hovering between 10 and 25 minutes. 6.3% of the students indicated bicycle commute time of fewer than 10 minutes while the most time spent on transit during commute was less than 10 minutes. Lastly, the commute home tended to take the most time, often because buses were late or off schedule. The last section of the survey asked respondents to rate their knowledge of the sidewalks, bike lanes, and public transit systems on the University campus and the surrounding area. Fifty-six percent of respondents could identify the nearest bus stop to their residence. All the students surveyed indicated that time and distance from campus were the most significant determinants of their commute method to campus.
Figure 6. Commuting Times by Method.
Discussion
A deeper look at the survey results and graph theory analysis shows some interesting patterns. Areas near the University and downtown Tuscaloosa are relatively well-connected with sidewalks and bus routes, the University is connected with bike lanes, but connectivity between the University and downtown is low and thus getting to places is often difficult.
Level of infrastructure connectivity on campus
The Graph Theory results from the Alpha, Beta, Gamma, and Degree connectivity metrics provide insight into the efficiency or redundancy of each route or method. The higher the score for the connectivity metric, the more connected it is. However, very high connectivity values could indicate excessive redundancy, meaning that there may be a wasteful level of redundancy. A lower score that may initially seem disconnected may be necessary to ensure the extent or efficiency of the network is as high as possible. The balance between these two extremes provides an easy-to-navigate and efficient network while keeping commuting times low and allowing people to travel more places. We see this phenomenon in the bus network.
For example, the Tuscaloosa Trolley network covers most of the city, including many areas further from the bus hub located downtown. These routes, mostly can take up to an entire hour to complete a loop. These routes should be placed into the larger context of the entire Tuscaloosa Trolley system, which has an alpha of 0.03 indicating a relatively low level of connectivity. The other connectivity metrics perform a little better, with a beta score of 1.05 and a gamma score of 0.35. Overall, the Tuscaloosa Trolley values agree more with efficiency-based, larger service area scores than higher connectivity scores.
The Crimson Ride Network has higher values than the Tuscaloosa Trolley. Its also Ride has a higher ratio of loops to nodes in its system, meaning it capitalizes on the connectivity of those nodes. Furthermore, unlike the Tuscaloosa Trolley, the Crimson Ride utilizes shared stops; once members of the public board the bus at the Bus Hub, they can easily switch routes at many stops due to overlapping routes, often leading to higher connectivity and redundancy. The values for the apartment shuttles conceals that each each route in this network has only 2 or 3 stops and 2 or 3 links and creates just a single loop.
The bike lane network is the most connected network of any method in Tuscaloosa, though there are many gaps and abrupt endings; this complicates commuting by bicycle. However, most of the University campus area has bike lanes with low-speed limits, thus, encouraging safe on-road cycling. Other areas, such as downtown Tuscaloosa with its pull-in/back-out parking and along 15th Street or McFarland with their high speeds, could pose severe threats to bicyclists. One serious issue is that the streets near the campus, such as behind Bryant Denny Stadium and University, do not offer bicycle infrastructure even though those areas are within the bicycling range. The only loops in the system are on the campus with their in-road bicycle facilities; the other routes do not loop or connect, lowering the bike system’s overall connectivity level, except for the on-campus road network. However, the network has a high beta value, indicating it is ‘connected’, with a good gamma value; this observation reflects well on the University campus, and it dominates other routes within the network on a broader view (Table 1).
As most metrics showed, the sidewalk network, including the City and Campus portions, was the most connected route, with few no-dead-ends or abrupt changes. There are crosswalks at most intersections. However, surprisingly, walking was the most popular on-campus travel means, and the area is pedestrian-oriented with many benches and marked intersections. However, the connectivity metrics around Tuscaloosa city are a little lower, and the beta and gamma values suggest that some nodes are not connected or have dead endings. For example, in some neighborhoods with sidewalks that tie into nothing or the Forest Lake area, where some houses or streets have sidewalks, while others do not. As more development occurs, the sidewalk network erodes, hence, the gaps in the network. The last portion of the graph theory analysis was degree calculations. Although some of these might have been obvious initially, it was helpful to identify places that currently have the most connections, such that future connections may be placed with these high-degree nodes. These nodes are essential because they can connect to possible locations. The bus hubs being high degree and common junctures in the Riverwalk bike network will serve as starting points for recommendations.
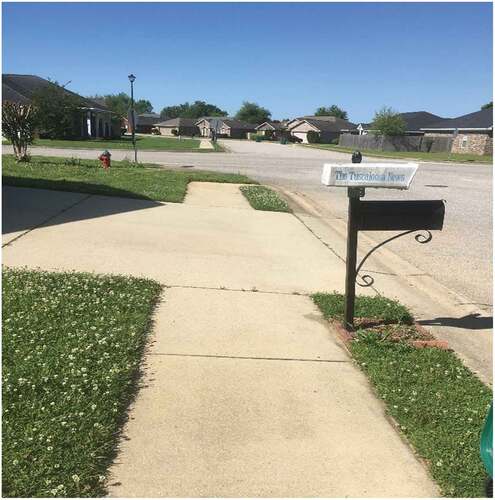
The study showed that resources tend to focus heavily on major thoroughfares like Jack Warner Parkway, McFarland Boulevard, Skyland Boulevard, University Boulevard, and Lurleen Wallace; however, most students, do not live along these roads. Instead, most live in adjacent neighborhoods that may not have the infrastructure necessary to get them safely to campus. Specifically, areas near Skyland and 15th Street, with high concentrations of students, have no sidewalks, bike lanes, or limited commuting methods. Also, some bus stops, especially for the Tuscaloosa Trolley, are in areas with no sidewalks or safe places of refuge for pedestrians to wait. The mapping effort also demonstrates the impact of development on Tuscaloosa’s transit network. For example, newer developments, such as some apartment complexes have sidewalks while adjacent houses do not. Lastly, new sidewalks are a welcomed addition (Bise et al., Citation2018). The absence of sidewalks highlights the network’s dis-connectedness due to the new wave of development the city has experienced due to increased enrollment at the University of Alabama. While these networks will continue to grow, the ‘sidewalks to nowhere’ currently serve no purpose when convincing students to bike to campus ().
Figure 7. Example of abrupt end to a sidewalk.
Mobility on campus
The survey also identified areas of interest based on students’ feedback. While it is important to remember that these results were collected during the COVID-19 outbreak when many students were no longer on campus, the responses help put the results of the mapping and metrics in context. Overall, students in the survey mainly chose to drive to school, with walking being the most popular (Figure 6). In addition, students who drive to campus often utilize the bus system to get to class from on-campus parking lots. The most time spent on buses was below 10 minutes. Biking is not a popular commuting option; and, commuting by biking took about 20 minutes. The biggest issue noticed in the survey was that many students linked the bus system to their being late for classes, suggesting that the bus system often runs behind schedule or there are connectivity issues.
Finally, most respondents unfamiliar with most networks besides the sidewalk network; this raises concerns for the lack of awareness and difficulties in accessing the correct information. Many students indicated that ‘asking a friend’ was critical in deciding how to commute to campus or avoid bad weather or traffic.
Policy implications
The downtown and campus areas have an extensive sidewalk network, making walking to campus simple. There is not an extended biking infrastructure, mainly to get to campus. Students must traverse roads with dangerous high-speed limits. Remarkably, the areas adjacent to 15th Street require more attention. These areas are home to an increased number of students; however, there is not much existing infrastructure to assist these students in getting to campus. This area is prime bicycle commuting distance with good set backs for bike lanes. Students require more awareness of the transit network and more flexibility with using the network. While the network covers a large extent of land, it does not provide much flexibility. A student could not switch routes, make unplanned stops, or change methods too quickly with the current network.
We propose three recommendations that could enhance planning for inter-modal connectivity. First, the City of Tuscaloosa should add a new bus hub, for example, around McFarland, to open up more bus routes and increase connectivity. This step would reduce travel routes, allow route overlaps, add more links with fewer nodes, enable quick transfers, and increase connectivity metrics.
Second, reduce the inherent gaps in the sidewalk and bicycle lanes closest to the campus. Alternatively, rather than new bicycle lanes, shared road markings could be harnessed to announce the presence of cyclists. For example, while Tuscaloosa’s downtown and campus area are the most walkable, the existing gaps in other areas, often caused by new developments, limit students’ commute to campus. New or better-marked sidewalks and bicycle lanes would create and integrate more loops, raise the connectivity metrics, increase safety, and encourage more students to walk or bike to campus. Third, the University and the city could collaborate on a transit mapping to integrate all transportation networks and routes. This map would raise students’ awareness and accessibility of available multimodal transportation methods within the city and University. This approach could improve usage, road safety, and environmental benefits. The map could also be adapted into an app to allow students plan their routes to better and fro the campus. An ideal transportation network maximizes connectivity while remaining efficient, accessible, and reliable.
Conclusion
This study adds to the existing literature on graph theory as a measure of connectivity in campus transportation networks by utilizing graph theory and GIS techniques to analyze multimodal transit networks in Tuscaloosa and the University of Alabama. It identified where infrastructure limits people’s ability to commute to campus, how those infrastructure limitations impact the network’s overall connectivity and provided recommendations for improving connectivity within this network. Insights from this study could enhance planning for inter-modal connectivity and make student commuting safer, more accessible, more eco-friendly, and more convenient even as the student population continues to increase.
A major limitation of the study is the omission of participants’ background information due to IRB approval restrictions. Another limitation is the low response rate to the survey conducted through the college’s Qualtrics system from November 2020 to January 2021 during the height of the Covid-19 epidemic in the US. A future research under different scenarios could strengthen the findings.
Disclosure statement
No potential conflict of interest was reported by the author(s).
Data availability statement
All data, models, and code generated or used during the study appear in the submitted article.
References
- Aithal, P. S., & Shubhrajyotsna Aithal, S. (2019). Implementation strategies of higher education part of national education policy 2020 of India towards achieving its objectives. International Journal of Management, Technology, and Social Sciences (IJMTS), 5(2), 283–325.
- Bise, R. D., Rodgers, I. I. I. J. C., Maguigan, M. A., Beaulieu, B., Keith, W., & Maguigan, C. L. 2018. Sidewalks as measures of infrastructure inequities. Southeastern Geographer. https://link.galegroup.com/apps/doc/A536929279/AONE?sid=lms
- Colorado. 2020. FACE: Hazards technical report. https://dnrftp.state.co.us/CWCB/Climate/FACE_Hazards_Data/FACE_Hazards_TechnicalReport.pdf
- Crimson Ride. 2021. Transportation Services. https://crimsonride.ua.edu/
- Derrible, S., & Kennedy, C. (2011). Applications of graph theory and network science to transit network design. Transport Reviews, 31(4), 495–519. https://doi.org/10.1080/01441647.2010.543709
- ECA. 2019. https://framework.tuscaloosa.com/existing-conditions-reports-available-for-review/
- Enoch, E. 2018. Grappling with growth trend. https://www.tuscaloosanews.com/story/news/education/campus/2018/09/16/ua-has-plan-to-deal-if-flat-enrollment-continues/10060135007/.
- Mishra, S., Welch, T. F., & Jha, M. K. (2012). Performance indicators for public transit connectivity in multimodal transportation networks. Transportation Research Part A: Policy and Practice, 46(7), 1066–1085. https://doi.org/10.1016/j.tra.2012.04.006
- OIRA. 2021. The university of Alabama total student enrollment: 1831 to 2021. https://oira.ua.edu/factbook/reports/student-enrollment/historical/total-student-enrollment-1831-to-present/
- Rodrigue, J.-P., Comtois, C., & Slack, B. (2013). The geography of transport systems (Third ed.). Routledge.
- Tuscaloosa. 2018. Comprehensive five-year affordable housing study. https://framework.tuscaloosa.com/wp-content/uploads/2018/10/Tusc_HSG_Study_10252018.pdf
- Tuscaloosa (Transit Authority). 2021. Home page. http://tuscaloosatransit.com/.
- U.S. Census Bureau. 2021. Tuscaloosa City, Alabama. https://www.census.gov/quickfacts/tuscaloosacityalabama
- UAPSP (University of Alabama Pedestrian System Plan). 2018. https://constructionpublicinfo.ua.edu/wp-content/uploads/Design-Guidelines/Section-I/12-Pedestrian-System-Plan.pdf
- University of Alabama Off Campus Resources. 2022. https://offcampushousing.sa.ua.edu
- Weber, J. (2016). The properties of topological network connectivity measures and their application to U.S. urban freeway networks. The Professional Geographer, 68(3), 485–495. https://doi.org/10.1080/00330124.2015.1106324