
 ?Mathematical formulae have been encoded as MathML and are displayed in this HTML version using MathJax in order to improve their display. Uncheck the box to turn MathJax off. This feature requires Javascript. Click on a formula to zoom.
ABSTRACT
Efficient management of temporary infrastructure is pivotal for the success and sustainability of periodic fairs and festivals. Coordination among stakeholders involved in procurement, supply, and timely delivery is essential. The involvement of multiple stakeholders results in varying cost engagements at different levels. This study proposes a centralised operational framework for infrastructure distribution, potentially reducing overall costs. Focusing on West Midnapore district, India, the research aims to introduce a sustainable and cost-effective strategy for temporary infrastructure management. Recognising the significance of transportation in managing temporary infrastructures, the study emphasises reducing travel distances and minimising site occupancy time to enhance cost efficiency. Using a linear regression model, the required infrastructural goods for fairs in the district are quantified. A delivery schedule is devised, employing vehicle route planning techniques to determine reduced truck travel distances. Comparing different distribution frameworks, the study finds that a centralised approach utilising three trucks is the most sustainable and cost-effective solution. Moreover, it examines and quantifies the social cost incurred when infrastructure items exceed the allowed fair duration in the current system. Implementing this proposed approach enables stakeholders to balance sustainability cost-effectiveness and build an efficient infrastructure supply chain management.
1. Introduction
India is a land of a multitude of fairs and festivals, with every region having specific fairs (Dutta & Durgamohan, Citation2016). They can be regional or local, depending upon the scale and importance of the event. Events like Gangasagar Mela and Pushkar Fair involve the participation of people across the nation, whereas Lohri, Pongal and Bihu are a few examples of locally organised religious fairs. Every month is characterised by some unique fair or a festival which is an opportunity to create higher economic returns and simultaneously a way of contributing to the local economy (Jauhari et al., Citation2015). Fairs are periodic and generally showcase their cultural identity through their exhibits. Stalls display items from state cooperative societies, cottage, handloom and handicraft industries. Fairs and festivals create economic opportunities for the communities involved in such organisations. Usually, the large-scale fairs are organised by the local authorities with aid from Central and State Governments. On the other hand, local authorities like the Department of Self-Help Groups (SHGs), District Industries Centre, Labour and Library organise local-level fairs with the support of the State Government. West Midnapore, a southernmost district in West Bengal, witness 25 fairs in a six-month span that repeats every calendar year. Some infrastructures like stalls, shops, dais (for cultural events) movable toilets are some facilities that are built temporarily to facilitate the incoming visitors. The materials with which these facilities are built are termed as ‘temporary infrastructures’ in this paper. The temporary facilities required to set up any fair depend upon factors like expected footfall, area of fairground, road connectivity to the fair location, and duration of the fair. For organising such events of various scales, the current system involves individual planning by the local authority with different stakeholders. Series of tasks like issuing tenders, work orders, allocating manpower, monitoring infrastructure delivery and maintaining of accounts are involved in setting and dismantling individual fairs. Fairs are considered as a single event and multiple stakeholders are associated. Furthermore, the supply chain from different stakeholders becomes a complex process to host a timely event.
Current practice has an implication on the overall cost incurred to the authority for setting up individual fairs. Estimating individual costs is a daunting task. Costs include procurement and delivery cost of transporting infrastructures and material storage costs for setting and dismantling an event. In most cases, it has been observed that the event organisers or contractors responsible for setting up and dismantling an event often leave the infrastructure items within the event ground itself until those are booked for the next event. The duration of occupying the place of the event is also uncertain. It bears a social cost due to the loss of opportunities. For example, the economic livelihood of small vendors and hawkers would have benefitted if the fair was held during this idle time, toddlers and children could have played in the fairground free from infrastructure lying idle thus enhancing their physical and mental health. All these costs add indirectly to the societal cost. This paper proposes a centralised system for the timely supply of temporary infrastructure to various locations. Contrary to the prevailing system, a sustainable method where a schedule is followed enables the reuse of such infrastructure, thereby reducing the overall costs, including the social cost. A vehicle routing problem with a single supply node acting as the origin is considered where fair locations act as different demand nodes. A brief of literature on various cost estimations and applications of vehicle routing problems follows the next section. The rest of the paper is organised as follows. Section 3 discusses the approach and methods adopted, followed by the justification for the study area selection. Section 4 elaborates on the outcomes of this study obtained through analysis estimation and illustrates them. Finally, we conclude in Section 5 and briefly discuss the future scope of this work.
2. Literature review
This paper focuses on two aspects. One is the supply and procurement by transportation of temporary infrastructure, and the other is the quantification of the associated costs incurred directly or indirectly in this infrastructure supply mechanism. Since this study focuses on the transportation process of temporary infrastructure intended for organising pre-determined fairs in a sequence, timely delivery of infrastructure to these fairs becomes crucial. Hence, literature on vehicle routing has also been discussed. Therefore, this study discusses different methods of estimating social costs and domain-specific applications for estimating vehicle routing problem.
2.1. Studies on cost estimation
In economics, the total cost to society is called the social cost. It can be further subdivided into private costs and any external costs. For instance, if one goes to work by driving, then the person is using petrol as a private cost and incurring congestion, and pollution to society as an external cost. Altogether, these costs are combined and are termed social costs. Another significant term that is often associated with social costs is opportunity costs. Simply put, opportunity cost is defined as the next best alternative foregone. It is based on the principle of scarcity. Buchanan (Citation1991) said that if no object or activity valued by anyone is scarce, all demands for all persons and periods can be satisfied. It is generally seen that we are forced to make choices whenever there is scarcity. Opportunity cost is thus an evaluation done on the highest-valued rejected alternatives.
Odeck (Citation2006) assessed the subsidy that could be provided to the Norwegian Bus industry by considering the bus service’s operating characteristics. Congestion, region of operation and the spread of the service were looked at as the main factors. The result showed a scope for reducing input costs by 21%, thereby transferring some of the saved costs to subsidise the system. On the contrary, congestion contributed to the rising input cost. The authors Horner and Groves (Citation2007) used the concept of modal split to identify facility locations for park-and-ride in the rail transit system. With accurate modelling of the Past Traffic flow and synthetic road network data, an optimal position of the facility was found using hypothetical placement scenarios for passing the benefits that occurred due to congestion. Bersani et al. (Citation2009) explored a futuristic approach to assess the location of hydrogen gas-based service stations. They investigated the possible location points of such service stations vis-à-vis the existing petrol pump stations. The two scenarios were compared: converting all petrol stations to hydrogen stations; finding location points for the new hydrogen-based stations nearby existing stations to understand the benefits for the consumers.
Existing social cost–benefit analyses are crucial for calculating profit for any sector. De Langhe (Citation2017) proposed a robust social cost–benefit framework by accurately assessing the external cost elements of using trains and trams. Maximum and minimum values were determined for each external cost that acted as an input for a generic social cost–benefit model. In another study, the positive utility of bicycling was assessed by Krizek (Citation2018) by studying intrinsic factors like social cohesion and stress relief. He incorporated these factors into travel analysis by measuring the accessibility aspect to different destinations. A cost–benefit analysis was explored by the authors Akbulut and Seçilmiş (Citation2019) in deciding what the appropriate social discount rate for Turkey could be. The social discount rate is an important parameter by which social benefits and costs are compared over a period. They used two methods, namely the personal tax method and the food demand method, to estimate the marginal utility rate of consumption. Results showed that the personal tax method was a better approach since there were many tax evasions in the country. Social cost–benefit analysis has also been explored in the domain of Public Distribution systems by Biswal et al. (Citation2020). The authors tried to minimise the government-sponsored subsidies by comparing equivalent subsidies per consumption with and without the use of RFID. The underlying issue was that a major part of the subsidy was wasted due to product misplacement and shrinkage. The results showed that the RFID method requires a minimum donor subsidy to target the expected consumption. Social cost–benefit analysis has also been explored in the domain of renewable energy. To reduce the ticket prices of High-Speed Rail in Taiwan, the authors Chou et al. (Citation2020) proposed an evolutionary optimisation model for maximizing profits. Using a bi-level planning approach, they considered optimally balancing passenger satisfaction with profitability. Results categorised fare rates into short, medium and long-distance travel to achieve cost efficiency. One such study was conducted by Anderson et al. (Citation2022) in which the authors explored how much energy can be saved through utility bills and transferred to the renewable existing microgrid. Parameters like public health costs, social cost of carbon and savings generated in utility bills were considered for quantifying the costs. They applied this methodology to three case study sites using REopt mixed integer programming software. Results suggested optimal mix use of renewable, conventional and storage energies. The savings were found by taking the difference in energy consumption by the business-as-usual scenario and the optimised one. The effect of congestion costs to society was estimated by Struyf et al. (Citation2022). The costs were broken down into direct, indirect, private and societal. Costs for each vehicle mode such as trucks, vans and privately owned cars were further estimated. The trade-offs between the generalised and calculated congestion costs were used as a tool for transparent location-wise charging of congestion surcharges.
2.2. Studies based on vehicle routing
Vehicle Routing problem with the help of GIS has been extensively used by the authors starting from the early 21st century. The authors de Silva and Eglese (Citation2000) tried to develop a prototype known as Spatial Decision Support System (SDSS) by integrating GIS with Simulation Modelling. Over the next decade, Akay et al. (Citation2012) also applied a Decision Support System (DSS) to determine the fastest, safest and most reliable routes from firefighting headquarters to fire areas in Turkey. Their main aim was to aid in the evacuation planning process.
Derekenaris et al. Citation(2001) tried to address the problem of emergency incident handling and management of ambulances using GIS and GPS technologies. Stepanov and James MacGregor (Citation2009) used the shortest path algorithm to compute an optimal routing policy for evacuees from a set of pre-defined routes. Stepanov and James MacGregor (Citation2009) used the shortest path algorithm to compute an optimal routing policy for evacuees from a set of pre-defined routes. They focused on the optimal routing problems, whereby addressing the issues of routing evacuees through an existing transportation network considering congestion and delays as key factors.
GIS applications have also been used in the sector of waste management. Malakahmad et al. (Citation2014) adopted a methodology to reduce costs associated with waste collection by reducing travel distance and time using ArcView. Results showed an increase in efficiency of the waste collection mechanism as the truck traveled route length decreased. In another study, Nowakowski et al. (Citation2018) provided a solution for effectively managing E-waste collection. They used different algorithms coupled with GIS and time-windowed VRP to increase the efficiency of waste collection. Results showed that the number of collection vehicles and collection points were reduced. Mohsenizadeh et al. (Citation2020) designed a network for managing solid waste and formulated a bi-objective mixed integer linear programming model to minimize cost and emission. They studied the effect of emissions with respect to vehicle speed.
The use of GIS has also been extensively used in the domain of the food industry. The authors Caramia and Francesca (Citation2010) considered a real-life problem faced by an Italian-based dairy company to solve the Milk Collection Problem. They formulated truck and trailer routing problems for minimising collection vehicles and their traveled distances from a single warehouse. In another study by Abousaeidi et al. (Citation2016) GIS was used to determine quick delivery routes for the transportation of fresh vegetables. A spatial map showing less driving time was reported as the final output.
Hence, from the above studies, GIS has been notably useful for determining solutions and approaches to problems in different fields.
2.3. Research gap
This study aims to bridge the gap in managing cultural events by assimilating both attendees for a particular event and the amount of infrastructure required that can be re-used to manage events of similar scale. Studies relating to organising local fairs in an Indian context are limited. Only large-scale, similar events feature in existing literature. The application of these in the area of temporary infrastructure deliveries and using them repeatedly for setting up fairs is limited in the works of literature. In this study, since the time of occurrence and the location of the fairs are predetermined, the timely delivery of temporary infrastructure becomes a crucial factor in the optimisation process apart from travel time and transportation costs. Furthermore, these fairs do not require pick-ups/deliveries on all days of the planning period unlike other studies observed in the various existing literatures. In this study of route optimisation, the delivery of reusable infrastructure, with a limited number of vehicles, for setting up events by transporting it to specified locations is the purpose.
3. Material and methods
Initially, an exhaustive fair checklist was retrieved from the records entitled ‘Fairs and Festivals of West Bengal’ by Mitra (Citation1953). The fairs in the list were categorized based on their name, place of occurrence, duration of days and the footfall experienced. The list being very old, ground verification became mandatory. Necessary updating was done by visiting different blocks. The authors also conducted a primary survey to gather current status and infrastructural needs. The data were collected from block-level offices and State Government Departments like Self-Help Groups, Labour, District Industries, District Library and different municipalities. Some unstructured interviews were conducted with different contractors to have details about the truck operation characteristics, material-holding costs and area of operation. In this study, a government-owned vacant available land is considered the source to hold temporary infrastructures and forms the origin of supply to different destinations. Fair locations, generally public open spaces, are considered nodes in this study. The roads (mainly expressways, highways, and arterial roads) connecting these nodes would act as the links through which the temporary infrastructures would be moved throughout the network. Another set of nodes would be the places of occurrence of the fairs. These fair locations would act as the destination nodes, where the temporary infrastructures must be delivered. Depending upon the schedule, event duration and scale of the fairs, the temporary infrastructures would be transported based on reducing the distance and cost associated with them. Costs include Depot holding cost, procurement and delivery cost of the infrastructures and cost borne by the stall owners for renting the stalls in the event. The idea is to reuse the same limited amount of temporary infrastructures for the different sets of events. Furthermore, the schedule of pickup and delivery of temporary infrastructures from one event to another has been given equal weightage as this incurs costs to the different stakeholders. With the end of one event, the infrastructure materials are either stored at some known places of the contractors or kept idle in the event ground until the next event commences, which leads to societal costs.
3.1. Study area
West Midnapore is the southernmost district in the state of West Bengal bounded by four different districts, namely, Jhargram on the West, Bankura and Hooghly in the North and Purba Midnapore on the East. It is further subdivided into three divisions, namely, Midnapore Sadar, Kharagpur and Ghatal, and comprises 21 community development (CD) blocks, respectively. National Highway (NH) 14 and NH 16 divide the district into two-halves running from Bankura to Balasore (in Odisha) in the North–South direction. This district has a hierarchy of road networks varying from highways (national and state) to local level roads. They also have varying widths, which limit different transportation modes for operating on different road categories. For this study, NH (National Highway), SH (State Highway) and Arterial Roads have been selected for transportation purposes. The Arterial roads constitute the highest percentage share of about 55.95% in the district, followed by NH, which constitutes about 26.31%, and the share of SH is about 17.74%.
The district of West Midnapore in the state of West Bengal has been selected as the study area is the fourth largest district in terms of population and the third-largest (6308 sq. km) in terms of its geographical spread. Cultural events such as fairs and festivals occur on calendar dates at different CD blocks almost throughout the year. These cultural fairs are important and are well recognised by people all over the district and beyond in various locations. As a result, there is a continuous requirement for transportation of temporary infrastructure for setting up fairs. Hence, given such simultaneous fair events and tight delivery schedules, transportation of the temporary infrastructures could be challenging. Hence the justification selection of the district of West Midnapore.
3.2. Methodology
The very first step was to prepare a list of fairs that were happening within the study area. The following parameters, namely (i) fair name, (ii) fair duration, (iii) fair venue, (iv) time of the year, (v) footfall experienced by the fair and (vi) stall area. Current footfall experience was calculated by studying fair date listed against each fair as projected footfall. Also, areas of stalls were calculated. Considering a single stall of size (3.048 m × 3.048 m), volume calculations were made from the unit level considering a standard layout of the fair and the material type required for quantification of the infrastructural demands. Infrastructure materials such as steel tubes, wooden ply-boards, tarpaulin, cloth rolls and corrugated galvanized iron (CGI) sheets were the temporary infrastructures assembled to build the entire fairground stalls. The total volumetric sum of all the infrastructural items was taken as a demand for a particular fair concerned and was transported using an identical light platform truck (LPT) of 5.49 m in length and capacity of 26.56 m3. This type of truck has been selected to allow movement through the lowest order of road (arterial) considered in this study. In this study, the two-truck system indicates that two trucks start from Depot on a given day, reach the fair location (nodes), unload the infrastructure and return to the Depot on the same day. Similarly, the three-truck and four-truck system indicates that three trucks and four trucks are assigned to do the same job, respectively. The node servicing time of each truck system is also considered. Node service time here refers to loading time at depot, unloading time and break time at destination. Each truck is associated with one driver and two laborers to aid in infrastructure loading and unloading. Each event consists of three components, namely fair setup time (ST), fair duration, and fair dismantling time (DT). ST and DT depend on the number of stalls. The total number of days including all the three components is termed as Site Occupancy time. The delivery of temporary infrastructure will happen either on the ST or DT. The values of ST and DT for each fair have been given in .
Moving forward, the next step was to quantify the infrastructural needs for the fair regarding truck volume. An equation was developed using linear regression to calculate the total area of the stalls for a given fair. Appropriate unit conversions were done for further calculation. It is assumed that the grounds exceed their capacity to hold the fairs. Since all the infrastructural goods are to be transported by trucks to the site, it is evident that each fairground has good road connectivity. Hence, footfall, fair duration and stall area data were used to form the equation. Statistical tests such as R-square, Durbin-Watson (DW values) and Variance Inflation Factor (VIF values) were performed to measure the accuracy of the equation.
For total footfall calculation, the population for each block was projected to the year 2021 using Logistic Curve (Saturation Method). The reason for using this method is that the Census dataFootnote1 (District Census Handbook) showed a sharp decline in the population percentage for the entire district over four decades, i.e. from the year 1971 (30.59%) to 2011 (14.14%). Finally, it reached 10.27% (projected) for the year 2021. With the two inputs, i.e. the footfall per day and duration of the fairs, the entire stall area for each fair was calculated and the total number of stalls required for each fair was found. The infrastructural demands of all the fairs were based on Truck Volume Equivalent (TVE), i.e. the total number of trucks required to cater for each fair. By simply entering the number of stalls required for a particular fair, the infrastructure demand of each fair based on truck volume will be calculated. It has been found that a single truck can hold infrastructural volume equivalent to 15 stalls.
Month-wise truck demand for each of the fairs was calculated considering the calendar of events in a year. It was found that there is a continuous requirement for trucks for 6 months (November 2018–April 2019) and an intermittent demand is observed in the remaining months. Therefore, a six-month tenure was considered in this study to create a fair timeline in chronological order. Using the Network Analyst extension in ArcGIS, a vehicle routing problem was solved between the existing Depot and the fair location nodes. Different input parameters like the truck start and end time, service time at each node and break time were fed as input in the Network Analyst extension. The output gave the truck’s total distance and time required to meet the infrastructure for that day. The same method was employed to determine the truck’s total travelled distances and the time required for 6 months. The operational cost per km of a truck was calculated (as shown in ).
For this study, delivery cost and social cost have been estimated and compared for the two scenarios: The existing scenario and the proposed scenario. The costs were subdivided into two: cost incurred to the government/authority and cost incurred to the fair organising stakeholders. In the existing situation, multiple contractors/stakeholders are involved in a fair’s procurement of different infrastructure items, delivery of different items, setting, and dismantling time. The contractors store necessary infrastructure materials at some identified known locations or on the fairgrounds until carried to the next fair. This restricts the residents’ use of public spaces and social activities in and around the fairgrounds for an indefinite period. This impacts society in a negative way both mentally and physically and hence it bears a social cost. The fair organisers receive the rent daily from individual stalls during the fair duration. The social cost has been quantified as the total rent the fair would have generated if the fair had continued in the exact location. It means that with each passing day, what cost would have been incurred if the infrastructure items were lying idle, blocking the fairground for an indefinite period. A cost–benefit analysis of the existing and proposed scenario has been illustrated.
5. Results and discussions
As discussed in the methodology, from the conducted surveys visiting various government departments in the West Midnapore district, a list of 23 fairs occurring within a stretch of 6 months was prepared along with their duration (). To calculate the TVE of each fair, a linear regression model was developed using different variables. The assumptions on connectivity and sufficient ground size hold good for all the cases. The ‘stall area’ was regressed with a combination of three independent variables ‘total footfall’, ‘footfall per day’ and ‘fair duration’, and the results are illustrated in . The equations were further tested on R-square, DW and VIF to ensure their validation.
Table 1. Combinations used with different individual dependent variables for model validation.
The R-square value of the model was found to be 0.665; the adjusted R-square value was 0.553; The DW value was 1.886, and the VIF was 1.368. The validation of this model is done as follows.
R-square values can be graded in the range (0.19-0.25) as weak, (0.33-0.5) as moderate and (0.67-0.75) as substantial by Chin (Citation1998) and Hair et al. (Citation2013). Also, Ozili (Citation2023) stated that R-square values between 0.51 and 0.99 are acceptable in social science research provided the model has been checked for multicollinearity. Hence, the above can be said to be in the substantial range.
The DW values can vary from 1.5 to 2.5. Field (Citation2009) suggests that values under 1 or more than 3 are a definite cause for concern. The value of 1.886 is well in the range and thus safely concluded that residuals do not show autocorrelation.
The VIF factor should be less than 10 to eliminate the factor of multicollinearity suggested by O’Brien (Citation2007). Since the VIF value of 1.368 is well below the 10-mark level, it can be safely concluded that no multicollinearity is observed.
After the analysis, it was found that variables named ‘footfall per day’ and ‘fair duration’ and R square, DW and VIF were found in each case Combination number 5 was found to be a favourable model that satisfied all three test parameters and the equation can be expressed as
where X1 = Footfall per day; X2 = Duration of the particular fair (in days); Y = Total area of the stalls of a fair;
The total area of stalls for each fair was then computed with the help of EquationEquation (1)(1)
(1) , and the number of stalls was calculated. The number of stalls was then fed into the volume calculator and the respective TVE was found for each fair. An additional truck has been considered in each case to carry mobile sanitary infrastructure. The total number of trucks required is calculated in . A number of fairs requiring the same number of trucks are summarised in . The schedule for a particular fair was subdivided into three parts: Fair setup time (ST), fair duration and fair dismantling time (DT). This information was collected from different contractors during the survey. The values of ST and DT are based on the number of stalls set up in a particular fair (), and ST is assumed to be the same as DT. Different truck systems have been adopted to arrive at the optimum number of trucks required to serve during the planning period. These are, namely, two-truck, three-truck and four-truck systems, respectively. The number represents that there will be the same number of equal-sized trucks available to do the job. The number of stalls for every fair and TVE for each category was calculated. Fairs having a duration of less than 3 days and/or TVE of less than one are not considered. The distribution of the number of trucks required and the number of stalls that are calculated are summarised in the following .
Table 2. ST/DT values and truck distribution for different stall categories.
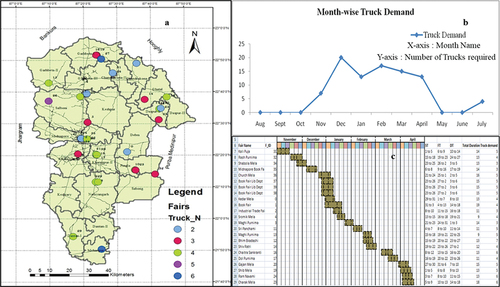
presents the spatial locations of 23 fairs with truck demands. It may be noted that multiple fairs occur in the exact locations where the fair location nodes overlap with each other. shows the monthly distribution of the truck demand during the study period, starting in November and ending in April with a peak demand in December. shows the spread of all the fairs during the study period. Each fair is labelled with a fair identification number (FID). A timeline chart has been stitched to identify the overlaps of multiple infrastructure demands of fairs during different time periods.
Figure 1. (a) Clockwise from left: Spatial distribution of month-wise truck demand; (b) Determining the planning period based on truck demand; (c) Fair timeline schedule of all the fairs within the planning period.
After calculating the inputs required to solve the vehicle-routing problem, the Network Analyst extension in ArcGIS software was used. The main input required for this extension was to create an Origin-Destination matrix for different fair locations. This was created using the O-D Matrix solver (), taking distance as the impedance. This was required to get the node-to-node distance of all the fair location nodes (destinations) and the Depot (origin). From the survey of workers engaged in loading and unloading, a node servicing time of 40 min, 60 min and 80 min has been adopted for two-truck, three-truck and four-truck systems, respectively. When only one truck is required to deliver the infrastructure, the node servicing time is also 40 minutes. A break time of 15 minutes for the driver and labourers at the end of each trip is assumed. These inputs such as the node service time (loading/unloading time), break time, travelling time between the nodes, and truck demand at each node were fed into the Network Analyst to solve the vehicle routing problem. After performing the routing analysis, maps were generated which showed two important outputs: the total duration of the entire operation and the total distance covered. Iterations were done for the same study period using different truck systems. A few samples of VRP output maps for specific days from Depot have been illustrated in .
Figure 2. OD pairs in terms of distances of all the fair location nodes.
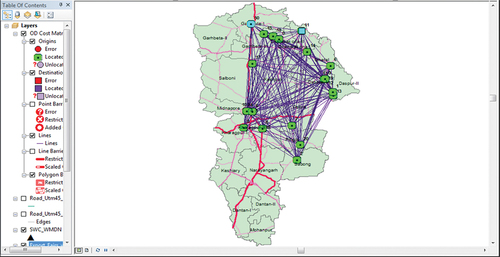
Figure 3. Clockwise from left (a) VRP output map for one origin and three destination fairs on day 53. Three routes are generated for the given day that require delivery to 3 distinct locations. (b) VRP output map for single-origin and single destination on day 107. A single route is generated for the given day. (c) The output table shows the total distance and time for the entire operation within the day. (d) VRP output map for a single origin and single destination on day 167.
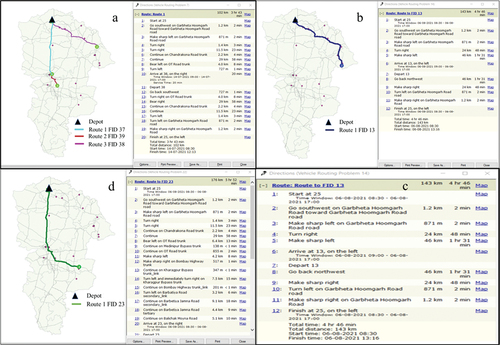
The VRP solver generated single-day routing for different truck systems for 180 days. The trucks’ route lengths and time for each day are obtained. Day 53 shows three different truck routes that originate from Depot and visit FID 37 (route 1), FID 38 (Route 3) and FID 39 (Route 2) and return on the same day for different truck systems. Route 1 and Route 2 are overlapping with each other. The total optimised distance, the time involvement and the site occupancy duration generated from the VRP solver under different truck systems have been summarised in . If the trucks were given a free run, i.e. with no restrictions to serve each fair from the same depot, then the total distance covered would be more (23308 km) than different truck systems. The term free-run represents an idealistic scenario where the source Depot is available with sufficient resources like materials, manpower and delivery vehicle. With the decrease in distance, the truck number increases. Further, month-wise results reveal that the number of trucks does not affect travel distance. On average, manpower engagement (hours/day) for two-truck, three-truck and four-truck systems are 4.58, 4.79 and 5.20, respectively. The average manpower engagement is the total hours the trucks were engaged divided by the number of days the trucks were used in the operation. For the two-truck system, the trucks were used for 135 days. The number was reduced to 89 days for the three-truck system, and the trucks operated for 75 days for the four-truck system. The values were obtained for truck demand matrix generated with the help of fair timeline schedule shown in . With the increase in the number of trucks, movement of the same infrastructures requires fewer days for different truck systems. Although the time total engagement time of trucks is reduced, there is an increase in the average manpower engagement as one move from two-truck to the four-truck system. The site occupancy, i.e. the number of days for which the infrastructures are kept idle in the fair location grounds, shows a decrease of 18 days when two-truck and three-truck systems are compared. It shows a minimal change for the three- and four-truck systems.
Table 3. Parameter comparison under different truck systems.
Cost calculations presented here are for Business as usual (BAU) and proposed scenarios. Two players are involved in each case, namely the Government/local authorities, and the stakeholders responsible for organising the fairs. Both scenarios were categorised under two heads, namely expenses and income. In the BAU scenario, the responsibility of setting up different fairs was taken up by several contractors or event organisers with the involvement of multiple sub-level contractors. In the proposed scenario, there is only one contractor who is outsourced by the authority and is solely responsible for the timely transportation of temporary infrastructure for all the fairs in the given study period. The contractor rented out a government-owned land (Depot) where all the infrastructure items required for setting up all the fairs are stored. Moreover, in the BAU scenario, different-sized trucks and different types of non-motorised vehicles are used to pick up or deliver infrastructure materials. Different-sized trucks are made available as and when required, depending on the fair schedule. In the proposed scenario, two, three, or four standard LPTs follow a definite timeline for pickup and delivery schedules. illustrates the income and expenses of the stakeholders involved in both scenarios.
Table 4. Income and expenses incurred under different scenarios.
Broadly, the cost of any fair event can be divided into civil and electrical infrastructure (lighting and sound). As per tender documents, civil constitutes about 85% of the total cost of the fair event and includes different components like stalls, dais, and wooden platforms with a temporary main gate with collapsible attachments. The other cost is transportation, which adds to the cost of organising the fair. The expenses incurred for the transportation of infrastructures are calculated in terms of cost per unit distance. The parameters considered to calculate an LPT’s cost per km run. The cost of fuel was as per actual data of 2019, and driver and labour costs were as per the Indian Labour Code, 2019. However, parameters like national permits, government taxes and maintenance costs were obtained from the Indian automotive forum as shown in . The data were obtained from the year 2017 and hence adjusted to include inflation from 2017 to 2019. The cost per km was estimated at Rs. 35 in 2019 for an LPT.
Table 5. Cost of operating a 5.49 m LPT truck per kilometre under different parameters.
illustrates the breakdown of costs for different entities such as fuel rates, labour charges, material storage costs, and vehicle parking costs required for calculating transportation expenses related to setting up a fair. Furthermore, additional costs are imposed for storing materials in open, semi-covered or covered states.
Table 6. Cost break-up of all the items used to calculate the procurement, delivery and operational cost of trucks. Storage Tariff circular of WBSWC.
As different contractors and sub-contractors get involved in organising a single fair, it was necessary to estimate the cost of organising a single fair and hence calculate the total cost for organising all the fairs within 6 months. Temporary infrastructure items like steel props, wooden plyboards, tarpaulin cloths, HDPE sheets and carpets are brought to the site by different suppliers either in trucks, matadors, or even by handcart or cycle vans, depending on the range of operation (). During the survey, it was found that these individual contractors operate within a region of 30 Km from their material storage nodes. If the range of operation is less than 3 km, the supply of materials happens with the help of hand carts or by cycle vans with transport costs ranging from Rs. 300 to 500 per trip. Truck types range from light, intermediate, and medium commercial vehicles, where cost per km varies from Rs.45 to Rs. 50 depending on the infrastructure material transported. lists all the parameters used for infrastructure transportation cost calculation from initiation to completion for BAU, Proposed or both scenarios. The salaries of government officials involved in the tendering process were gathered from the West Bengal Pay Commission website.
Figure 4. Cost calculation methodology adopted for the existing system for all the stalls.
Table 7. Parameters that are considered for calculation of the cost incurred in each system. Systems denote existing and proposed scenarios. Some parameters were used in either one of the systems, whereas some parameters were used in both systems as shown [Source: Primary survey 2018–2019].
The income and expenses under different scenarios for infrastructure transportation cost of various stakeholders are consolidated in . The net gain achieved using different truck systems is illustrated. As the operating costs vary directly with the increase in the number of trucks, net gains show a minute decrease. Nonetheless, a significant gain of 35% is achieved when the alternative system is for transportation of temporary infrastructure.
Table 8. Transportation cost comparison under BAU and proposed scenario.
Due to the occurrence of fairs for a temporary period, different hidden costs affect the society which are not accounted. These costs are in terms of the economy, health of the immediate community and environment of the surroundings where the fair is organised. Hence, the social costs can be expressed as the sum of health costs, economic costs and the different environmental costs associated with organising a fair. However, under limitations, the health and environmental costs have been excluded, and only opportunity cost is explored. The number of days the site remains blocked by the infrastructure materials is explained as the site occupancy time associated with different fairs. Thus, this is the idle time where the social activities on the site are restricted. If the fair would have continued during that idle time, the organisers would have benefitted from the rent of the stalls received. Also, the economic livelihood of small vendors and hawkers would have benefitted if the fair was held during the days during which the fairground was blocked. This lost amount is considered as the opportunity lost to the contractors and small vendors which is equated to the social cost. Cost to society can be attributed to individual’s physical and mental health which can be achieved by regular usage of the fairground through various physical and social activities. Damages caused due to dumped infrastructure may be varied which also incurs a social cost. Hence, the combination of these costs is equated to the opportunity cost lost as shown by Eq. 2.
where,
SC = Social cost per day in million INR; STr = Stall rent per sq. m;
TD = Total duration, STar = Area of single stall in sq. m;
STn = Total Number of stalls for a particular fair.
The estimated social cost varies from 0.06 to 0.22 million INR per day, depending on the total number of stalls in each fair (), which implies an average of 0.14 million (INR) is incurred for a single-day delay in removing temporary infrastructure from the fairgrounds.
Figure 5. Estimated social cost incurred for each fair occurring in a sequence.
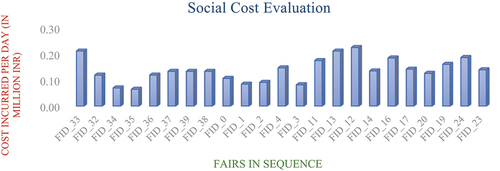
These would have been the benefits the organisers would have earned if the fair was held during those days for which the infrastructure items were lying idle. This loss of benefit has been equated with the cost incurred to the society.
It can be observed that adopting the proposed framework a centralised distribution of infrastructure in a disciplined manner is possible. The uncertainty in removing infrastructure by different stakeholders of the current scenario is avoided. This saves the social cost other than operational expenses. On comparing the different truck systems, a three-truck alternative truck system proved economical for this study.
6. Conclusion
This study initially learns the existing management of setting up individual fairs at a district level. Alternatively, it proposes a centralised distribution framework functioning from a single depot to serve the entire district. A three-truck supply system proved most efficient over the two- and four-truck systems with respect to distance and cost. Compared with the existing system, the operational costs were found to be lower in all the cases. The social cost borne due to the uncertainty of removal of infrastructure from the site in the existing scenario has to be further accounted for under cost. The expected monetary gains earned through the proposed scenario may be utilised for the welfare and development of the participating cooperative societies.
Organising fairs individually proved to be expensive. Further, it bears the social cost related to uncertainty in removing infrastructure lying idle indefinitely. The underlying reason is no proper warehousing by individual stakeholders to store these items and use them in the next event. Results showed that if the delivery procedure was adopted for the alternative system, infrastructure management became more efficient and properly stored in the Depot. The idle time of infrastructure lying at the fairgrounds decreased. Ideally, an average societal cost equivalent to 0.14 million INR per day is saved if the alternative mechanism is adopted.
Several drawbacks of the existing system are highlighted in the research gap which involves managing multiple contractors in the procurement, delivery, setting and dismantling of fairs. The small-scale fairs not included in this study’s scope may continue the existing practice using their own process and supply chain networks. However, larger fairs may adopt the proposed system for greater efficiency. In the proposed scenario, there is a single point of contact between the authority and the contractor responsible for the centralised supply and return of the infrastructure related to setting up fairs. The alternative system is a win–win situation for all three stakeholders involved in the process: the authority, the different contractors/sub-contractors and the society. The small contractors and vendors involved in this alternative process as their economic livelihoods remain intact and they can function as usual.
There are certain prerequisites on which the centralised supply framework depends for its successful implementation. The scale and duration of the fair. This study found that fairs requiring two TVEs of infrastructure and occurring for 3 days are attractive for the contractors. There needs to be good road network connectivity from the depot to the fair location. Also, the width of the road should be adequate to fit a standard-size truck. It is also essential that in any region the fair schedule has to be continuous and overlapping such that trucks can be utilized to their full running capacities. Also, the depot location and its infrastructure-holding capacity should be looked into for the successful implementation of the centralised framework.
6.1. Future scope and limitations
The advantage of the centralised supply is that it could be augmented to cater to adjoining districts and build up a greater supply chain providing sufficient resources. Alternatively, scenarios of simultaneous supply from multiple depots can be explored in case of constraints. However, like most studies, this paper has limitations. The Social Cost estimation has been worked out considering economic loss on livelihood only. Other externalities, such as the impact on health and environment, are not included. Also, the impact on different parameters such as physical and mental health, reduction of carbon footprints and management of material wastes incurred while organising these fairs can be further looked into. This study could also cater more number of fairs if contiguous districts are selected. Simultaneous transportation from multiple depots can be incorporated to manage and transport temporary infrastructures efficiently. This study demonstrates a significant cost reduction using the proposed scenario within the district boundary, thereby proving it as efficient and sustainable in the logistical sector of transportation of infrastructure goods.
CRediT author statement
Sourav Sur: Conceptualization, Methodology, Software, Writing – Original draft preparation, Writing – Reviewing and Editing. Sumana Gupta: Conceptualization, Supervision, Writing – Reviewing and Editing.
Acknowledgments
The authors are thankful to the Ministry of Education (MoE), Government of India, for funding this research, which is a part of an ongoing doctoral thesis. The authors would also like to acknowledge the reviewers for putting their valuable time and effort into refining this paper and also appreciate the constructive and insightful comments received from the reviewers. The authors acknowledge the Central Library, IIT Kharagpur for funding the Article Publishing Charge for this Open Access Journal with the Transaction ID ‘163978’.
Disclosure statement
No potential conflict of interest was reported by the author(s).
Data availability statement
There is no data set associated with this paper.
Additional information
Funding
Notes
References
- Abousaeidi, M., Fauzi, R. & Muhamad, R. (2016). Geographic information system (GIS) modelling approach to determine the fastest delivery routes. Saudi Journal of Biological Sciences, 23(5), 555–20. https://doi.org/10.1016/j.sjbs.2015.06.004
- Akay, A. E., Michael, G. W., Sivrikaya, F., & Dursun, S. (2012). A GIS-based decision support system for determining the shortest and safest route to forest fires: A case study in Mediterranean region of Turkey. Environmental Monitoring and Assessment, 184(3), 1391–1407. https://doi.org/10.1007/s10661-011-2049-z
- Akbulut, H., & Seçilmiş, E. (2019). Estimation of a social discount rate for Turkey. Socio-Economic Planning Sciences, 67, 78–85. https://doi.org/10.1016/j.seps.2018.10.001
- Anderson, K., Farthing, A., Elgqvist, E., & Warren, A. (2022). Looking beyond bill savings to equity in renewable energy microgrid deployment. Renewable Energy Focus, 41, 15–32. https://doi.org/10.1016/j.ref.2022.02.001
- Bersani, C., Minciardi, R., Sacile, R., & Trasforini, E. (2009). Network planning of fuelling service stations in a near-term competitive scenario of the hydrogen economy. Socio-Economic Planning Sciences, 43(1), 55–71. https://doi.org/10.1016/j.seps.2008.02.001
- Biswal, A. K., Jenamani, M., & Kumar, S. K. (2020). The impact of RFID adoption on donor subsidy through for-profit and not-for-profit newsvendor: Implications for Indian public distribution system. Socio-Economic Planning Sciences, 69, 100687. https://doi.org/10.1016/j.seps.2019.02.002
- Buchanan, J. M. (1991). Opportunity cost. In J. Eatwell, M. Milgate, & P. Newman (Eds.), The world of economics (pp. 520–525). Palgrave Macmillan UK. https://doi.org/10.1007/978-1-349-21315-3_69
- Caramia, M., & Francesca, G. (2010). A milk collection problem with incompatibility constraints. Interfaces, 40(2), 130–143. https://doi.org/10.1287/inte.1090.0475
- Chin, W. W. (1998). The partial least squares approach to structural equation modeling. In G. A. Marcoulides (Ed.), Modern methods for business research (pp. 294–336). Lawrence Erlbaum Associates.
- Chou, J.-S., Ongkowijoyo, C. S., Ngo, N.-T., & Chen, S.-Y. (2020). Evolutionary bi-level model for optimising ticket fares and operations profit of Taiwan high-speed rail. Research in Transportation Business & Management, 37, 100548. https://doi.org/10.1016/j.rtbm.2020.100548
- De Langhe, K. (2017). The importance of external costs for assessing the potential of trams and trains for urban freight distribution. Research in Transportation Business & Management, 24, 114–122. https://doi.org/10.1016/j.rtbm.2017.07.002
- Derekenaris, G., Garofalakis, J., Makris, C., Prentzas, J., Sioutas, S., & Tsakalidis, A. (2001). ‘Integrating GIS, GPS and GSM technologies for the effective management of ambulances’. Computers, Environment and Urban Systems, 25(3), 267–278. https://doi.org/10.1016/S0198-9715(00)00025-9
- de Silva, F. N., & Eglese, R. W. (2000). Integrating simulation modelling and GIS: Spatial decision support systems for evacuation planning. The Journal of the Operational Research Society, 51(4), 423. https://doi.org/10.2307/254169
- Dutta, K., & Durgamohan, M. (2016). Theory of planned behaviour: fairs, festivals and indian youth. ABS International Journal of Management, 4(2), 17–24.
- Field, A. P. (2009). Discovering statistics using SPSS (3rd ed.). SAGE Publications Ltd. https://pdfroom.com/books/discovering-statistics-using-spss/or5WWypK5qD
- Hair, J. F., Ringle, C. M., & Sarstedt, M. (2013). Partial least squares structural equation modeling: Rigorous applications, better results and higher acceptance. Long Range Planning, 46(1–2), 1–12. https://doi.org/10.1016/j.lrp.2013.01.001
- Horner, M. W., & Groves, S. (2007). Network flow-based strategies for identifying rail park-and-ride facility locations. Socio-Economic Planning Sciences, 41(3), 255–268. https://doi.org/10.1016/j.seps.2006.04.001
- Jauhari, V., Munjal, S., & Dr Vinnie Jauhari, P. (2015). Fairs and festivals in India: The cultural and economic potential. Worldwide Hospitality & Tourism Themes, 7(4), 324–330. https://doi.org/10.1108/WHATT-03-2015-0012
- Krizek, K. J. (2018). Measuring the wind through your hair? Unravelling the positive utility of bicycle travel. Research in Transportation Business & Management, 29, 71–76. https://doi.org/10.1016/j.rtbm.2019.01.001
- Malakahmad, A., Md Bakri, P., Radin Md Mokhtar, M., & Noordiana, K. (2014). Solid waste collection routes optimization via GIS techniques in Ipoh City, Malaysia. Procedia Engineering, 77, 20–27. https://doi.org/10.1016/j.proeng.2014.07.023
- Mitra, A. (1953). Fairs and festivals in West Bengal. West Bengal Government Press. https://censusindia.gov.in/nada/index.php/catalog/28589/download/31771/24251_1951_FRI.pdf
- Mohsenizadeh, M., Tural, M. K., & Kentel, E. (2020). Municipal solid waste management with cost minimization and emission control objectives: A case study of Ankara. Sustainable Cities and Society, 52, 101807. https://doi.org/10.1016/j.scs.2019.101807
- Nowakowski, P., Szwarc, K., & Boryczka, U. (2018). Vehicle route planning in e-waste mobile collection on demand supported by artificial intelligence algorithms. Transportation Research Part D: Transport & Environment, 63, 1–22. https://doi.org/10.1016/j.trd.2018.04.007
- O’Brien, R. M. (2007). A caution regarding rules of thumb for variance inflation factors. Quality & Quantity, 41(5), 673–690. https://doi.org/10.1007/s11135-006-9018-6
- Odeck, J. (2006). Congestion, ownership, region of operation, and scale: Their impact on bus operator performance in Norway. Socio-Economic Planning Sciences, 40(1), 52–69. https://doi.org/10.1016/j.seps.2004.05.001
- Ozili, P. K. (2023). The acceptable R-square in empirical modelling for social science research. Munich Personal RePEc Archive. https://mpra.ub.uni-muenchen.de/115769/1/MPRA_paper_115769.pdf
- Stepanov, A., & James MacGregor, S. (2009). Multi-objective evacuation routing in transportation networks. European Journal of Operational Research, 198(2), 435–446. https://doi.org/10.1016/j.ejor.2008.08.025
- Struyf, E., Sys, C., Van de Voorde, E., & Vanelslander, T. (2022). Calculating the cost of congestion to society: A case study application to Flanders. Research in Transportation Business & Management, 44, 100573. https://doi.org/10.1016/j.rtbm.2020.100573