
Abstract
Novelty is an important characteristic of a creative idea, forming a core component of creativity. Measurement of novelty is therefore essential to assess creativity. We found deficiencies in a frequently cited method of novelty assessment found in the literature. We refine this method by proposing four modifications, supported by drawing on examples of products and ideas. The refined method and the original method are evaluated by benchmarking them against the collective, intuitive assessment of product novelty by experienced designers. The overall achievement of the refined method as presented in this paper is its contribution to a better assessment of product novelty.
1. Introduction
Creativity, a fundamental aspect of human intelligence, is important in designing products (Cross, Citation2011; Gerber & Martin, Citation2012; Verhaegen, Vandevenne, Peeters, & Duflou, Citation2013) and supporting companies to capture large market share (Eisentraut & Badke-Schaub, Citation1995). It is highly related to the commercial performance of businesses (Childs & Fountain, Citation2011). As a consequence, considerable research efforts have been directed towards understanding and assessing creativity (Amabile, Citation1996; Casakin, Citation2007; Sternberg & Lubart, Citation1999). Assessment of creativity is essential to select innovative products, to evaluate the degree of innovation taking place in companies, and to identify better inventors and designers (Sarkar & Chakrabarti, Citation2008). ‘Novelty’ is a key characteristic of a creative idea, and is therefore considered as one of the core components of creativity (Sarkar & Chakrabarti, Citation2008). For example, to Davis Citation(1992), ‘creativity appears simply to be a special class of psychological activity characterized by novelty.’ As novelty is a key component of creativity, its measurement is essential to assess creativity of products (Sarkar & Chakrabarti, Citation2008).
Novelty is also an important metric used to evaluate idea generation methods in engineering design (Jagtap, Larsson, Hiort, Olander, & Warell, Citation2015; Sadler, Shluzas, & Blikstein, Citation2016). Idea generation methods can be evaluated through process-based and/or outcome-based approaches (Shah, Smith, & Vargas-Hernandez, Citation2003). Since process-based approaches are time consuming and difficult due to the inherent complexity of examining cognitive processes responsible for creative thought, outcome-based approaches are frequently used. In outcome-based approaches, the designs/outcomes produced by designers are evaluated by using some metrics, including the metric ‘novelty’ (Shah et al., Citation2003).
Sarkar and Chakrabarti (Citation2011) developed a method to assess novelty of products and ideas. They argue that their method overcomes the inadequacies found in the novelty assessment methods developed by Shah et al. (Citation2003), Saunder (Citation2002), and Lopez-Mesa and Vidal Citation(2006). Their method has received attention in design research, as indicated by a number of studies referring to or using their method (e.g. Borgianni, Cascini, & Rotini, Citation2012; Fuge, Stroud, & Agogino, Citation2013; Snider, Culley, & Dekoninck, Citation2013).
Previous studies have proposed refinements to ideation metrics, in particular the metric ‘variety’ (e.g. Nelson, Wilson, Rosen, & Yen, Citation2009; Verhaegen et al., Citation2013). However, such refinements have not yet been proposed to Sarkar and Chakrabarti’s novelty assessment method despite deficiencies in it. It is the purpose of this article to address the deficiencies in the novelty assessment method of Sarkar and Chakrabarti (Citation2011). In total, four modifications have been proposed to their method, and are supported by drawing on examples of products and ideas. The refined method and Sarkar and Chakrabarti’s method are evaluated by comparing their results with the results of the novelty assessment by experienced designers. The results of this evaluation indicate that as compared to Sarkar and Chakrabarti’s method, the refined method better reflects the novelty assessment by experienced designers.
2. Background
Creativity is often considered as a fundamental aspect of human intelligence (Cross, Citation2011). It is an important factor in creating novel and useful products and processes, and affects a variety of businesses (Chakrabarti & Bligh, Citation1994; Liu, Chakrabarti, & Bligh, Citation2000). Creativity plays a crucial role in initiating innovations, solving problems, and capturing a large market share (Sarkar & Chakrabarti, Citation2011). Consumers typically buy more creative products when they have an option of selecting between a routine product and a product embodying creativity (Elizondo, Yang, et al., Citation2010). Creativity is highly related to the commercial performance of businesses (Childs & Fountain, Citation2011; Jagtap, Warell, Hiort, Motte, & Larsson, Citation2014), for example, a study by Cox (Citation2005) revealed that a major proportion of the profits of the most innovative companies in the UK was generated from products that were not in existence five years ago.
Creativity is a subject of research in many disciplines, and researchers generate both descriptive and prescriptive knowledge to understand, assess and support creativity (e.g. Jagtap et al., Citation2015; Oman, Tumer, Wood, & Seepersad, Citation2013; Sternberg & Lubart, Citation1999). Assessing creativity is essential to select the most creative product, to identify better inventors and designers, and to evaluate the degree of innovation happening in a firm since creativity is a prerequisite for innovation (Sarkar & Chakrabarti, Citation2011). Further, assessment of creativity helps to evaluate aspects of idea generation methods (e.g. Jagtap et al., Citation2015; Shah et al., Citation2003). Creativity assessment warrants an understanding of creativity and its measures.
Several definitions of creativity have been proposed. According to Amabile (Citation1983), for instance, creativity is a process leading to a creative outcome. Torrance (Citation2010) describes creativity in terms of originality, flexibility, fluency, and elaboration. Cropley and Cropley (Citation2005) define creativity in terms of relevance, novelty, elegance, and generalizability. If a product/solution is only relevant, i.e. it only satisfies the intended function, it is routine. If it is relevant plus novel, it is original. If it is original plus aesthetic, it is elegant; and if it is elegant and generalizable, it is called innovation (Cropley & Cropley, Citation2005). Linsey, Markman, et al. Citation(2008) explain creativity as the ability to look at problems from different perspectives to generate novel and previously unseen possibilities. A similar definition of creativity is proposed by Oman et al. Citation(2013). They describe creativity as ‘a process to evaluate a problem in an unexpected or unusual fashion in order to generate ideas that are novel’. Creativity is also defined as novel and useful products and ability to generate such work (Weisberg, Citation1993). Creativity is prerequisite to produce work that is novel and appropriate (Sternberg & Lubart, Citation1999).
Sarkar and Chakrabarti Citation(2008) analysed a large number of creativity definitions, by using ‘majority analysis’ and ‘relationship analysis’. The ‘majority analysis’ ensured that the ‘common’ definition utilized the most frequently used concepts in the current creativity definitions, and the ‘relationship analysis’ was aimed to capture the rich underlying relationships among the concepts used in the various definitions. The results from these two analyses were compared to propose this ‘common’ definition: ‘Creativity occurs through a process by which an agent uses its ability to generate ideas, solutions or products that are novel and valuable.’ This definition as well as the definitions presented earlier indicate that novelty is a core component of creativity, and therefore novelty assessment is prerequisite to assess creativity. Many creativity assessment methods and metrics include novelty as an important measure of creativity. For example, Sarkar and Chakrabarti (Citation2011) consider novelty and usefulness as measures of creativity, Chulvi, Mulet, et al. (Citation2012) employ importance of each requirement, degree of satisfaction of each requirement and novelty of proposed design as parameters to evaluate creativity, and Shah et al. (Citation2003) employ four metrics, namely, quantity (total number of ideas generated), novelty (how unusual or unexpected an idea is), variety (indicates the number of categories of ideas), and quality (feasibility of an idea and how closely it satisfies the design specifications). A recent study comparing many creativity assessment methods and metrics found that novelty is a key component of creativity (Oman et al., Citation2013), and therefore novelty assessment is prerequisite to assess creativity.
Furthermore, as idea generation is important in engineering design, many research studies are devoted to evaluate idea generation methods by using a set of metrics, including the metric ‘novelty’ (e.g. Jagtap, Citation2016; Linsey, Citation2007; Shah et al., Citation2003; Worinkeng, Joshi, & Summers, Citation2015). According to Shah et al. (Citation2003), uncommon ideas/solutions are perceived as novel; and in a design space, they occupy points that are not initially noticed. An individual generates a novel outcome when it not identical to existing outcomes (Jagtap et al., Citation2015). Some authors employ ‘infrequency’ as a measure of novelty (e.g. Linsey, Citation2007; Lopez-Mesa & Vidal, Citation2006). Shah et al. (Citation2003) categorised novelty into three types: personal novelty (the outcomes generated by an individual are new to him/her), societal novelty (a product or idea is new to a specific society), and historical novelty (a product or idea is new to all societies and civilizations). To assess novelty of products and ideas, methods have been developed by researchers such as Shah et al. (Citation2003) and Lopez-Mesa and Vidal Citation(2006). Sarkar and Chakrabarti (Citation2011) identified several deficiencies in the novelty assessment methods developed by the researchers: Lopez-Mesa and Vidal Citation(2006), Shah et al. (Citation2003), Saunders (Citation2002), and Redelinghuys Citation(2000). The deficiencies that were identified include: the methods do not consider the timeline of invention, most of the methods do not assess how novel a product is (i.e. the degree of novelty), and the methods use arbitrary abstraction levels to assess product novelty. Sarkar and Chakrabarti (Citation2011) developed a novelty assessment method to address those deficiencies. Their method has received attention in design research as indicated by a number of studies referring to or using their method (e.g. Borgianni et al., Citation2012; Fuge et al., Citation2013; Snider et al., Citation2013), and also by the number of citations to their article.
Sarkar and Chakrabarti’s (Citation2011) method employs FBS (Function – Behaviour – Structure) and SAPPhIRE models. The FBS model is employed first to identify whether a product is very highly novel or not. Then, the SAPPhIRE model is used to assess relative degree of novelty of a product with respect to previous products. Their novelty assessment method can be used not only for products, but also for solutions and ideas.
In the FBS model, Function is what a system does and it is intentional. Behaviour is how a system accomplishes the function, and Structure represents the elements and interfaces constructing the system and its interacting environment. In assessing product novelty, the FBS model is used first ():
A recently generated product is assigned ‘very high’ novelty if it fulfils a new function, which is not fulfilled by any of the existing products. For example, the X-ray machine, when it was introduced first time, is an example of a very high novelty product.
A recent product is ‘not novel’ if its structure matches with that of any other available products. A recent product is novel if its structure is different from that of other products.
Figure 1. Steps in the novelty assessment method of Sarkar and Chakrabarti (2011).
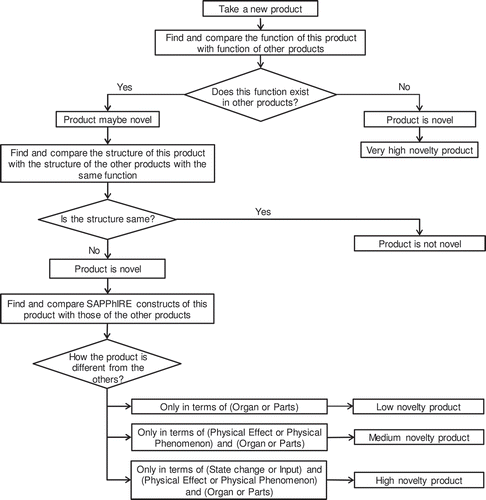
The use of FBS model helps to identify ‘very high’ novelty products, and to ascertain whether or not a product is novel. Next, the SAPPhIRE (State-Action-Part-Phenomenon-Input-oRgan-Effect) model of causality is used to assess the relative degree of novelty of a product. The SAPPhIRE model provides a rich causal explanation of physical phenomena and attempts ‘to reach a non-arbitrary degree of detail of behavioural explanation’ (Chakrabarti, Sarkar, Leelavathamma, & Nataraju, Citation2005). The SAPPhIRE model explains the relationships between the following seven constructs (See ):
Parts – ‘a set of physical components and interfaces constituting the system and its environment of interaction’;
State change- ‘the attributes and values of attributes that define the properties of a given system at a given instant of time during its operation’;
oRgan – ‘the structural context necessary for a physical effect to be activated’;
Effect – ‘the laws of nature governing change’;
Input – ‘the energy, information or material requirements for a physical effect to be activated; interpretation of energy / material parameters of a change of state in the context of an organ’;
Phenomenon – ‘a set of potential changes associated with a given physical effect for a given organ and inputs’; and
Action – ‘an abstract description or high level interpretation of a change of state, a changed state, or creation of an input’.
Figure 2. SAPPhIRE model of causality (Chakrabarti et al., Citation2005).
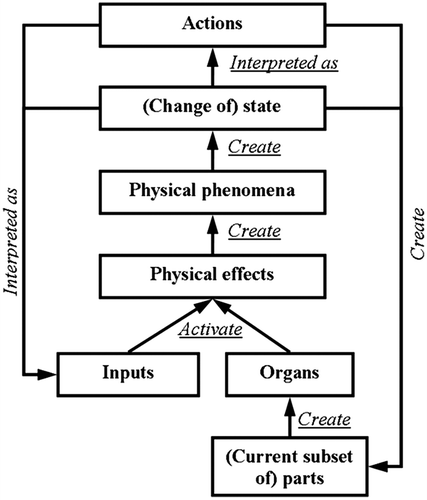
The relationships between the above constructs are: parts create organs; organs and inputs activate physical effects; physical effects create physical phenomena and changes of state; and changes of state are interpreted as actions or inputs, and create or activate parts. System and its environment of interaction are also important concepts in the SAPPhIRE model (Jagtap, Citation2016). Sarkar and Chakrabarti (Citation2011) have mapped SAPPhIRE model to FBS model. The construct ‘action’ in SAPPhIRE is considered as ‘function’ in FBS; ‘parts’ in SAPPhIRE is interpreted as ‘structure’ in FBS; the other constructs of SAPPhIRE work together to create ‘behaviour’ in FBS.
In their novelty assessment method, which uses FBS and SAPPhIRE models, products are assigned degrees of novelty as follows (see ):
A new product with a difference at the level of function (action) is assigned ‘very high’ novelty.
If a new product fulfils the function (action) already satisfied by some other products, and differs from other products in terms of all the other six constructs (except ‘action’), the new product is assigned ‘high’ novelty.
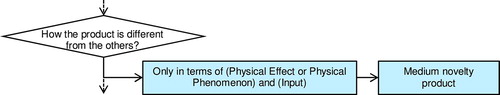
A new product is qualitatively attributed with ‘medium’ novelty if it differs from existing products only in terms of ‘physical effects’ or ‘physical phenomena’ plus ‘organs’ or ‘parts’.
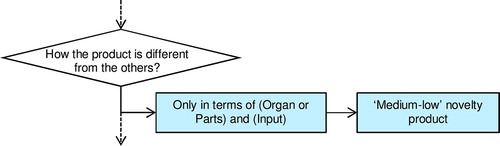
A new product is taken as a ‘low’ novelty product if it differs from existing products only in terms of ‘organs’ or ‘parts’.
To illustrate products with different degrees of novelty, Sarkar and Chakrabarti have provided an example of cooking appliances. For instance, wood burning ovens are taken as ‘very high’ novelty products because before the invention of these ovens, the function of controlled burning of fuel to cook food was not fulfilled. After the wood burning ovens, coal, kerosene, gas burning and electric ovens were invented. Electric oven is not taken as ‘very high’ novelty product since the function of controlled burning of fuels to cook food was already satisfied by its predecessors. Electric ovens are assigned ‘high’ novelty because for the same function, these ovens differ from all its predecessors (e.g. wood, coal, kerosene, gas burning ovens) in terms of input (electricity), physical phenomena, physical effect, organs and parts (see ).
The novelty assessment method of Sarkar and Chakrabarti (Citation2011) has received attention; but we found deficiencies in their method. In Section 3, we present these deficiencies and propose modifications to address them. In total, four modifications have been proposed, and are supported by drawing on examples of products and ideas. While Section 3 presents these modifications separately, they are integrated in Sarkar and Chakrabarti’s method, as presented further in Section 4. Section 5 presents the evaluation of the refined method and Sarkar and Chakrabarti’s method by comparing their novelty assessment results with the results of novelty assessment by experienced designers. Finally, conclusions are presented in Section 6.
3. Modifications
We found four deficiencies in Sarkar and Chakrabarti’s method. These deficiencies were found when we tried their method. One of these deficiencies is that their method does not consider both ‘inputs’ and ‘structure’ (i.e. organ or parts) to check if a product is novel. Other three deficiencies are that their method does not include a step to assess novelty of a product differing from other products – only in terms of inputs, only in terms of physical effect or physical phenomenon and input, and only in terms of inputs and organ or parts. The following subsections present modifications to Sarkar and Chakrabarti’s method to address the four deficiencies.
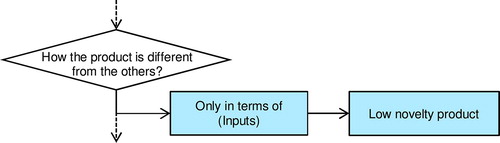
3.1. Modification 1: differences in inputs
One of the deficiencies in Sarkar and Chakrabarti’s method is that it does not include a step to assess novelty of a product differing from other products only in terms of inputs. To address this deficiency, we modify their method by adding a step to assess novelty of products differing from other products only in terms of inputs. The above deficiency and the modification for addressing it are exemplified as follows. Some four stroke Internal Combustion (IC) engines can be operated on petrol as well as blend of petrol and 10% ethanol (FCAI, Citation2015). Thus, there are two products: four stroke IC engine running on ‘petrol’ (petrol engine), and four stroke IC engine running on the ‘blend of petrol and 10% ethanol’ (petrol-ethanol engine). These two products have the same structure (i.e. organ or parts), but they are operating on different inputs, namely ‘petrol’ and ‘blend of petrol and ethanol’. The physical phenomena in these two engines are the same; e.g. combustion of fuel in the cylinder creates pressure and this pressure operates a slider and crank mechanism. In addition, the physical effects in both engines are also the same; e.g. heat transfer laws and Newtonian laws of motion.
The petrol-ethanol engine came after the petrol engine. In order to assess the novelty of petrol-ethanol engine by using Sarkar and Chakrabarti’s method, it needs to be compared with the petrol engine. This comparison, by using Sarkar and Chakrabarti’s method (), shows that the petrol-ethanol engine is not novel because for the same function, its structure is identical to that of petrol engine.
Thus, according to Sarkar and Chakrabarti’s method, a product is not novel if it differs from other products only in terms of inputs. We argue that two products, achieving the same function, but differing only in terms of inputs, should have different degrees of novelty because: inputs coming from outside the system are essential for interaction between the system and its environment; inputs are essential to accomplish the function of a product; and ‘inputs’ is one of the elementary constructs in the SAPPhIRE model, which is used as a theoretical foundation to assess relative degree of novelty of products (Sarkar & Chakrabarti, Citation2011). We argue that the petrol-ethanol engine should be assigned ‘low’ novelty when it is compared with the petrol engine, since it operates on different input. In Section 4, we have presented the rationale of assigning ‘low’ novelty to this product. We, therefore, as shown in , add a step in Sarkar and Chakrabarti’s method to consider products differing only in terms of inputs.
Figure 3. Modification 1: Addition of a step to consider differences only in terms of inputs.
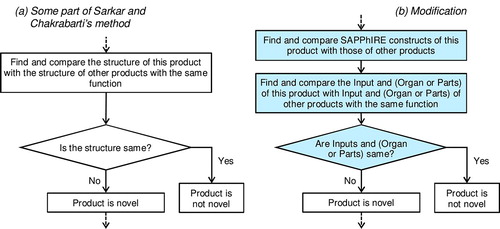
3.2. Modification 2: determining if a product is novel
Sarkar and Chakrabarti’s method does not consider both ‘inputs’ and ‘structure’ (i.e. organ or parts) to ascertain if a product is novel. Below, we explain this deficiency and the related modification to address it. In their novelty assessment method, Sarkar and Chakrabarti have used the FBS and SAPPhIRE models. The construct ‘parts’ in the SAPPhIRE is interpreted as ‘structure’ in the FBS. The FBS model is used first to ascertain whether or not a product is novel. For this purpose, the structure of a recent product is compared with that of previous products. If the structure is same, the product has no novelty. However, as mentioned above in Section 3.1, a recent product can be novel even if its structure is same as that of previous products, achieving the same function. This leads us to propose the second modification: a recent product is not novel if its both ‘inputs’ and ‘structure’ (i.e. organ or parts) are same as those of previous products, fulfilling the same function. Therefore, as shown in , we add a modification to Sarkar and Chakrabarti’s method, replacing the FBS model by the constructs of the SAPPhIRE model, to ascertain whether or not a product is novel.
Figure 4. Modification to ascertain whether or not a product is novel.
3.3. Modification 3: Differences in input and physical effect or physical phenomenon
Sarkar and Chakrabarti’s method does not include a step to assess novelty of a product differing from other products only in terms of physical effect or physical phenomenon and input. We add a step in their method to address this deficiency. The following example illustrates this deficiency and the step added in their method which allows to assess novelty of products differing from other products only in terms of physical effect or physical phenomenon and input. Consider a function of warming a small quantity of water (e.g. to increase temperature of water from 15 to 20 °C). This function can be fulfilled by using two products, as illustrated in . The structure of these products is same – a small metal bowl containing water, as shown by the system boundary in . To fulfil the same function, product-1 and product-2 respectively use solar energy and heat transfer from a hot metal plate. Thus, in product-1, input in the system is solar energy; whereas, in product-2, it is thermal energy from a hot metal plate. In product-1, water is warmed by the physical effect of radiation; and in product-2, it is warmed by the physical effect of conduction (heat transfer by conduction thorough the metal wall of the bowl) (Yunus, Citation2003). In product-1, the physical phenomenon to warm water is absorption of radiation by water; and in product-2 it is transfer of thermal energy through the wall of the bowl (Yunus, Citation2003). Products 1 and 2 thus differ in terms of physical effect or physical phenomenon and input to achieve the same function.
Figure 5. Illustration of products with different inputs and physical effects.
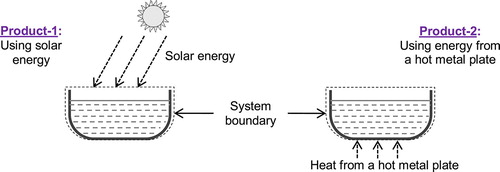
According to Sarkar and Chakrabarti’s method, product-2 is not novel when it is compared with product-1, as they have the same structure. However, product-2 is different from product-1 in terms of physical effect or physical phenomenon and input, which are elementary constructs in the SAPPhIRE model used as a theoretical foundation to assess product novelty. We therefore argue that if a product is different in terms of physical effect or physical phenomenon and input from existing products to achieve the same function, it is qualitatively considered as of ‘medium novelty’. Section 4 presents the rationale of assigning ‘medium’ novelty in this case. As a result, as shown in , we add a modification to Sarkar and Chakrabarti’s method to consider products differing only in terms of physical effect or physical phenomenon and input.
Figure 6. Modification 3: Addition of a step to consider differences in physical effects and inputs.
3.4. Modification 4: differences in inputs and parts/organs
Sarkar and Chakrabarti’s method does not include a step to assess novelty of a product differing from other products only in terms of inputs and organ or parts. The example reported below illustrates this deficiency and the step added in Sarkar and Chakrabarti’s method to address it. shows two conceptual solutions to perform the function of lifting a moderately heavy object. In solution-1, this function is fulfilled by applying a force at the end of the lever. This force is due to the weights attached at the end of the rope. Thus, in solution-1, the input is force due to the gravity. In solution-2, the input is a force exerted by a human. In both solutions, the physical effect is the same, namely the lever effect (Pahl, Beitz, Feldhusen, & Grote, Citation2007). However, the organ or parts to activate this physical effect are different in these solutions. Thus, to fulfil the same function, solutions 1 and 2 differ only in terms of organ or parts and input.
Figure 7. Conceptual solutions to lift a moderately heavy object.
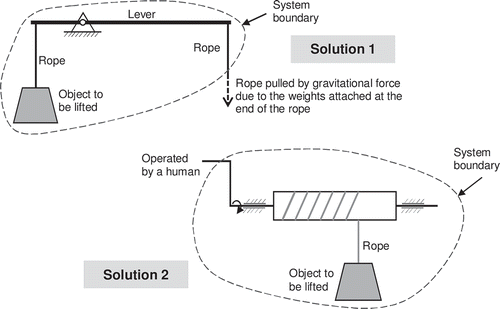
Sarkar and Chakrabarti’s method does not include a step to assess the degree of novelty of a product differing from existing products only in terms of organ or parts and input. In other words, their method cannot be used to compare the above solutions 1 and 2. To overcome this deficiency, we add a modification to their method, in order to consider products differing in terms of organ or parts and input (see ). In this case, we assign ‘medium-low’ novelty, with related rationale presented in Section 4.
Figure 8. Modification 4: Addition of a step to consider differences in inputs and parts/organs.
4. Refined novelty assessment method
In Section 3, four modifications were developed separately. In this section, these modifications are integrated in Sarkar and Chakrabarti’s method, taking into account their rationale to qualitatively assign different degrees of novelty at various levels of the SAPPhIRE model (see ). To detect relative degree of novelty in products, Sarkar and Chakrabarti attribute products with a difference at the level of function (action) as ‘very highly novel’. They argue that products that are different from existing products at ‘physical effects’ or ‘physical phenomena’ level, are more novel than those that are different only at the ‘organ’ or ‘part’ level. They thus assign qualitatively higher degree of novelty to products that are different from existing products at higher level constructs (e.g. action, physical effects, physical phenomena) of the SAPPhIRE model than those that are different only at the lower level constructs (e.g. parts, organs, inputs).
Figure 9. Refined novelty assessment method (Legend: M – Modification, see Section 3 for details).
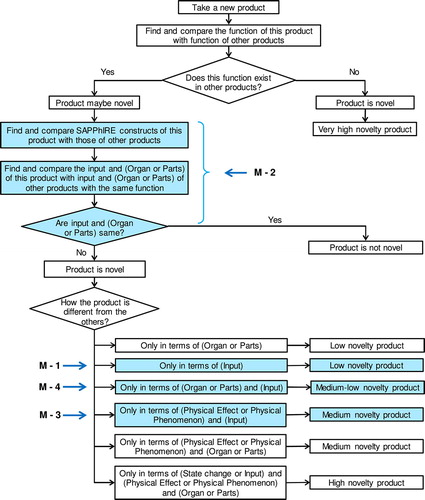
By following Sarkar and Chakrabarti’s justification to qualitatively attribute products with different degrees of novelty, we assign degrees of novelty to products, as shown in the blue coloured boxes on the right side of . We assign ‘low’ novelty to a product differing from existing products only in terms of input (M – 1). If a new product is different from existing products only in terms of organ or parts and input, the product is qualitatively taken as of ‘medium-low novelty’ (M – 4). The degree of novelty ‘medium-low’ indicates the level of novelty as between the levels – ‘medium’ and ‘low’. Similarly, if a new product differs from existing products only in terms of physical effect or physical phenomenon and input, the product is qualitatively considered as of ‘medium novelty’ (M – 3). The refined method provides more clarity and detail to ascertain whether or not a product is novel, by using the constructs ‘inputs’ and ‘organ’ or ‘parts’ of the SAPPhIRE model, and thus eliminates the need of FBS model (M – 2).
5. Evaluation
The results of novelty assessment by using the refined method and by using Sarkar and Chakrabarti’s method were compared with the results of novelty assessment by experienced designers. Sarkar and Chakrabarti have justified the need to compare the results of a novelty assessment method against the collective, intuitive assessment of product novelty by experienced designers. Experienced designers are regularly employed to assess product novelty in patent offices and design firms, because one cannot have comprehensive knowledge base of all the existing products against which a new product can be compared to assess its novelty. Sarkar and Chakrabarti evaluated their novelty assessment method by comparing its results with the results of novelty assessment by experienced designers. In this research, we adopted their evaluation method to compare the results of our refined method and Sarkar and Chakrabarti’s method with the results of the product novelty assessment by experienced designers. This evaluation was a time-consuming process, involving the following steps.
Step 1: Design and distribution of the survey to obtain results of product novelty assessment by experienced designers (in total, 18 designers).
Step 2: Assessment of product novelty by using the refined method and Sarkar and Chakrabarti’s method. Two teams, with two designers in each team (in total four designers, different from the above 18 designers), used the two methods to assess product novelty.
Step 1: design and distribution of the survey
Three sets of products were identified (see online supplement). Set-1 included four spark ignition IC engines (see supplementary Figure 1). Of these four products, two were those exemplified in Section 3.1 (Modification-1), namely, four stroke IC engine running on petrol and four stroke IC engine (with the same structure) running on the blend of petrol and 10% ethanol. Set-2 consisted of four products to achieve the function of warming a small quantity of water, e.g. to increase temperature of water from 15 to 20 °C (see see supplementary Figure 2). Of these four products in set-2, two were those illustrated in Section 3.3 (Modification-3), namely, a bowl containing water placed outside to use solar energy and the same bowl placed on a hot metal plate. In set-3, four conceptual solutions with the function of lifting a moderately heavy object were included (see see supplementary Figure 3). Of these four solutions, two were those exemplified in Section 3.4 (Modification-4). The online supplement also outlines the survey questionnaire.
Because there are some differences as well as commonalities between the Sarkar and Chakrabarti’s method and the refined method, it is important to ensure that the differences between them are considered in their evaluation against the collective, intuitive assessment of product novelty by experienced designers. The refined method includes four modifications to the Sarkar and Chakrabarti’s method. Of these four modifications, one is about amending a step of Sarkar and Chakrabarti’s method (M – 2, see ), and the remaining three are additions of new steps in their method (M – 1, M – 3 and M – 4, see ). Excepting these four modifications, other steps in both the refined and Sarkar and Chakrabarti’s method are same. In evaluating the refined method, the selected product sets ensured that the refined method, which includes the four modifications, could be tested against the collective, intuitive assessment of product novelty by experienced designers. These multiple sets also allowed to check whether or not the novelty assessment by using the refined method is in close agreement with the experienced designers’ novelty assessment, as compared with the Sarkar and Chakrabarti’s method.
In addition to the above reasons for selecting the three product sets, the number and types of products in the sets ensured that the task of completing the survey was not too tedious and time-consuming for the designers, by minimising the effort required by them and increasing the likelihood they would complete the survey. The three sets included relatively simple products, so that the designers were aware of the working mechanisms of the products to fulfil their respective functions. Designers were informed that the products in the sets are chronologically arranged (e.g. the first product labelled ‘product 1’ was invented first). In addition, they were informed about the system boundary of the products in the three sets. System and its environment of interaction are important concepts in the SAPPhIRE model used as a theoretical foundation for the refined method as well as Sarkar and Chakrabarti’s method.
The designers were asked to rank each product in each of the three sets relative to other products in that set, in terms of their novelty. This provides an order of products in terms of their relative novelty. For example, a product with rank 1 has higher degree of novelty than a product with rank 2 (see online supplement for an example of such ranking). Two or more products can have the same rank, for example, when they have the same degree of novelty. The averages of the ranks given by the 18 designers were computed for the final evaluation. The survey also included questions about their personal information, for example their number of years of design experience, educational qualifications, etc.
Eighteen designers, with average design experience of 4.61 years (SD = 2.33 years), completed the survey. All of these designers have a Master’s degree in Product Design from a range of institutes in India, with Bachelor’s degree in engineering field (e.g. Mechanical Engineering, Production Engineering, etc.). The designers were working in India in a range of companies such as automotive, manufacturing, product design consultancies, etc. Necessary explanation and information together with an example was provided to the designers to complete the survey. The survey was pre-tested to verify that the target audience was interpreting the instructions, information and questions as intended. The pre-testing indicated that on average, it took about 15 min to read the instructions and rank the products. The average values of product novelty ranks as assessed intuitively by the designers are shown in (see the column labelled ‘Experienced designers’).
Step 2: assessment of product novelty by using the refined method and Sarkar and Chakrabarti’s method
Table 1. Average novelty ranks by experienced designers, and by using the refined method and Sarkar and Chakrabarti’s method (3, 4 means the rank can be 3 or 4).
In line with the evaluation method of Sarkar and Chakrabarti, two teams (two designers in each team) used the refined method and Sarkar and Chakrabarti’s method to assess novelty of products in the three sets. The average experience of these designers was 3 years, and each of them has a Master’s degree in Product Design. By using the novelty assessment methods, they ranked products in the three sets, providing an order of these products in terms of their relative novelty. For example, if products A, B, C and D are respectively assigned high, low, medium-low and medium degrees of novelty by using the refined method, then rank 1 will be assigned to the product A, rank 2 to D, rank 3 to C, and rank 4 to B. This also means that the degree of novelty assigned to the product A is higher than that assigned to the product D, and the degree of novelty assigned to the product D is higher than that assigned to the product C, and so on. Likewise, ranking of products in a set is undertaken by using Sarkar and Chakrabarti’s method. Products can get same rank if they are assigned the same degree of novelty. For instance, if products ‘X’ and ‘Y’ are assigned same degree of novelty by using a method, then these two products have the same novelty rank (i.e. tied ranks).
The designers in the two teams were provided with documents explaining the two novelty assessment methods. In addition, a researcher was present in the room to answer their questions. Each team took about 2.5 h to understand the novelty assessment methods. They completed the novelty assessment at separate times, and were not allowed to communicate each other about the novelty assessment. The results of their novelty assessment are presented in (last two columns). These novelty ranks are averages of the novelty ranks as given by the two teams.
Because the results of product novelty assessment by the experienced designers and by using the refined and Sarkar and Chakrabarti’s methods are in the form of ranks, we used Spearmen’s rank correlation (see ). As the Spearman’s rank correlation is calculated based on the ranks (e.g. Dubey, Kothari, & Awari, Citation2016; Rumsey, Citation2007), the novelty ranks given by the designers are averaged and these averages are rank-ordered as shown in . Consider for example the novelty ranks given by the experienced designers in the case of product set 2. Their novelty ranks for each product in this set are averaged, and these averages are rank ordered, resulting in rank 3 for product 1, rank 2 for product 2, rank 1 for product 3 and rank 4 for product 4 (see row ‘Product set 2’ and column ‘Experienced designers’ in ).
Table 2. Spearman’s rank correlations.
To compute Spearman’s rank correlation in the case of tied ranks, each tied value is assigned the average of the ranks they would have received if they were not tied (e.g. see Dubey et al., Citation2016). For example, in the case of product set 2 and Sarkar and Chakrabarti’s method, the rank of first product is 1 and the ranks of remaining three products are tied (last column and row ‘Product set 2’ of ). The ranks of these three products, had they not been tied, would have been 2, 3, and 4. In computing Spearman’s rank correlation, the average of these three ranks ([2 + 3 + 4]/3) is used – that is – each of the three products receives the rank 3 (see Dubey et al., Citation2016; Rumsey, Citation2007), and this rank 3 is used in computing Spearman’s rank correlation. Likewise, in the case of the product set 1 and Sarkar and Chakrabarti’s method (last column and row ‘Product set 1’ of ), the ranks of products 3 and 4 are tied. Therefore, each of these products is assigned the rank 3.5 (average of 3 and 4), and this rank is used in computing Spearman’s rank correlation. shows tied ranks when they are tied, and not the ranks that are used in computing Spearman’s rank correlation in the case of such tied ranks. The correlations between the novelty ranks in multiple sets indicate that the refined method correlates highly with that used by the experienced designers (see ). This suggests that, as compared to Sarkar and Chakrabarti’s method, the novelty assessment by using the refined method is in close agreement with the experienced designers’ intuitive assessment of novelty.
5.1. Summary of findings and discussion
Creativity, a key aspect of human intelligence, is crucial in solving problems, designing products, and initiating innovations. It is highly linked with the commercial performance of businesses. As such, creativity is a subject of research in many disciplines, including, among others, engineering design. Many research studies have focussed on understanding and supporting creativity, and have developed methods to assess it. Novelty is a core component of creativity, and therefore assessment of novelty is necessary to assess creativity. The present research focused on refining a specific method of novelty assessment. In particular, we refined Sarkar and Chakrabarti’s (Citation2011) well recognised novelty assessment method, which addresses deficiencies in several other novelty assessment methods developed by, for example, Lopez-Mesa and Vidal Citation(2006), Shah et al. (Citation2003), etc.
We identified deficiencies in Sarkar and Chakrabarti’s method, proposed four modifications to address them, and supported these modifications by providing examples of products and ideas. Of the four modifications, three are needed to assess the novelty of a product differing from other products: (1) only in terms of inputs (‘low’ novelty product); (2) only in terms of organ or parts and inputs (‘medium-low’ novelty product); and (3) only in terms of physical effect or physical phenomenon and input (‘medium’ novelty product). In addition to these three modifications, we proposed a modification to ascertain whether or not a product is novel – that is – a product is not novel if its inputs and organ or parts are same as those of other products.
The refined method and Sarkar and Chakrabarti’s method are evaluated by benchmarking them against the collective, intuitive assessment of product novelty by experienced designers. shows the results of this evaluation in terms of the Spearman’s rank correlations. The correlation in product set 1 between the refined and experienced method is 1 (see ), indicating agreement between the novelty assessment by using the refined method and experienced designers’ intuitive assessment of novelty of products in set 1. A possible explanation behind this is that the novelty assessment by using the refined method is in close agreement with the experienced designers’ assessment of novelty of products in set 1. It appears that the experienced designers have considered differences in inputs in assessing product novelty, for example, differences in inputs in the case of products 1 and 3 in set 1 (see Figure 1 in online supplement).
As shown in , the correlation in product set 2 between the experienced method and Sarkar and Chakrabarti’s method is zero, indicating disagreement between them in assessing novelty of products in set 2. The products in set 2 (see in online supplement) have the same structure, and therefore, according to Sarkar and Chakrabarti’s method, products 2, 3 and 4 in this set are not novel when they are compared with product 1 even though there are differences between them in terms of SAPPhIRE constructs such as inputs and physical effects. On the contrary, it seems that the experienced designers have considered such differences in their assessment of novelty of products in set 2, resulting in disagreement between their novelty assessment and that by using Sarkar and Chakrabarti’s method.
Although the product sets 1 and 3 have the same range of p values (see ), the values of correlations between the novelty ranks by using the experienced method and refined method are higher in these sets than those between the experienced method and the Sarkar and Chakrabarti’s method. This shows a stronger relationship of novelty ranks between the refined method and experienced method than between the Sarkar and Chakrabarti’s method and experienced method as the value of correlation indicates the strength of relationship; higher the correlation value, stronger is the relationship (e.g. Dubey et al., Citation2016). In all three sets, the correlations between the novelty ranks by using the refined method and experienced method are higher than those between the Sarkar and Chakrabarti’s method and experienced method, with higher average value of 0.867 (experienced and refined method) against 0.583 (experienced and Sarkar and Chakrabarti’s method) – the last column in shows the averages of correlation values in the three sets. The results of the evaluation suggest that as compared to Sarkar and Chakrabarti’s method, the novelty assessment by using the refined method better reflects the experienced designers’ intuitive assessment of novelty, as indicated by the correlations in novelty ranks in multiple sets.
If the assessment of product novelty by employing the refined method does not require the use of modifications M – 1 to M – 4 (see ), the results of novelty assessment by using the refined method and Sarkar and Chakrabarti’s method will be same because excepting the four modifications, all other steps in the two methods are identical. In other words, if assessment of product novelty requires the use of only common steps in the two methods, their results of novelty assessment will be same. For example, if a product set includes products differing only in terms of parts and organs, the results of novelty assessment by using the two methods will be identical. On the other hand, as suggested by the findings of evaluation, the results of novelty assessment by using the refined method, requiring the use of any of the four modifications (M – 1 to M – 4), are highly correlated with the experienced designers’ intuitive assessment of product novelty, as compared to Sarkar and Chakrabarti’s method. The overall achievement of the refined method as presented in this paper is its contribution to improved assessment of novelty – a key component of creativity and an important metric used to evaluate idea generation methods in engineering design. As such, the refined method can be used in assessing creativity and evaluating idea generation methods.
As with any research, this research has some limitations. In line with Sarkar and Chakrabarti’s method, we used three sets of products to evaluate the refined method. These three product sets ensured that the refined method, which differs from Sarkar and Chakrabarti’s method in the four modifications, could be tested against the experienced designers’ intuitive assessment of product novelty. Whilst the results of evaluation, by using these multiple product sets, show a stronger relationship between novelty ranks by using the refined method and the experience method, future studies might use a larger number of product-sets for such an evaluation, including those used by Sarkar and Chakrabarti, namely, sets of common writing instruments, popular communication devices and domestic cooking devices. In the present research, the products included in the three sets are ‘mechanical’. Future work may benefit from using sets of wide range of products such as electrical and mechatronic products. Further studies may also gain by using sets of randomly selected product categories. While this research is related to creativity metrics, it is limited to one of the crucial components of creativity, i.e. novelty.
6. Conclusions
As novelty is a key component of creativity, its measurement is essential to assess creativity of products. Sarkar and Chakrabarti (Citation2011) developed a method, which uses FBS and SAPPhIRE models, to assess novelty of products, solutions or ideas. We identified four deficiencies in their method, which were found when we tried the method. We proposed four modifications to address the deficiencies. These modifications are supported by drawing on examples of products and ideas. Three of these modifications are needed to assess the novelty of a product differing from other products: only in terms of inputs; only in terms of organ or parts and inputs; and only in terms of physical effect or physical phenomenon and input. In addition, we proposed a modification to ascertain whether or not a product is novel, i.e. a product is not novel if its inputs and organ or parts are same as those of other products.
We integrated the four modifications in Sarkar and Chakrabarti’s method, taking into account their rationale of qualitatively assigning different degrees of novelty. The refined method provides more clarity and detail in ascertaining whether or not a product is novel, by replacing the FBS model with the constructs of the SAPPhIRE model. Furthermore, the refined method has the capability to consider the cases of product novelty assessment, which could not be recognised in the original method of Sarkar and Chakrabarti. As such, the overall achievement of the refined method as presented in this paper is its contribution to improved assessment of novelty – an important component of creativity.
The refined method and Sarkar and Chakrabarti’s method were evaluated by comparing their results with the results of the product novelty assessment by experienced designers. The results of this evaluation, using three sets of products, suggest that as compared to Sarkar and Chakrabarti’s method, the novelty assessment by using the refined method is in close agreement with the experienced designers’ intuitive assessment of novelty, indicating the usefulness of proposed modifications to Sarkar and Chakrabarti’s method and of the resulting refined method.
Disclosure statement
No potential conflict of interest was reported by the author.
Supplemental data
The supplemental data for this article can be accessed at https://doi.org/10.1080/21650349.2018.1463176
Supplemental material
Download MS Word (287.7 KB)Acknowledgements
This work would not have been possible without Sarkar and Chakrabarti’s (2011) foundational work on the development of their novelty assessment method. The author would also like to thank all the designers who generously gave their time to participate in the study. A preliminary version of this paper was published in the International Design Conference – Design 2016. The raw data used in this study contains sensitive information about the individuals and their organisations, and as such cannot be made freely available.
Related Research Data
References
- Amabile, T. M. (1983). The social psychology of creativity. New York, NY: Springer-Verlag.10.1007/978-1-4612-5533-8
- Amabile, T. (1996). Creativity in context. Boulder, CO: Westview press.
- Borgianni, Y., Cascini, G., & Rotini, F. (2012). A proposal of metrics to assess the creativity of designed services. Paper presented at the DS 73-1 Proceedings of the 2nd International Conference on Design Creativity Volume 1.
- Casakin, H. P. (2007). Factors of metaphors in design problem-solving: Implications for design creativity. International Journal of Design, 1(2), 21–33.
- Chakrabarti, A., & Bligh, T. P. (1994). Functional synthesis of solution-concepts in mechanical conceptual design. Part I: Knowledge Representation. Research in Engineering Design, 6(3), 127–141.10.1007/BF01607275
- Chakrabarti, A., Sarkar, P., Leelavathamma, B., & Nataraju, B. (2005). A functional representation for aiding biomimetic and artificial inspiration of new ideas. AIE EDAM, 19(02), 113–132.
- Childs, P.R.N., & Fountain, R. (2011). “Commercivity”, DS 69: Proceedings of E and PDE 2011, the 13th International Conference on Engineering and Product Design Education (pp. 3–8).
- Chulvi, V., Mulet, E., Chakrabarti, A., López-Mesa, B., & González-Cruz, C. (2012). Comparison of the degree of creativity in the design outcomes using different design methods. Journal of Engineering Design, 23(4), 241–269.
- Corr. (2010). Critical values of the correlation coefficient. Retrieved from http://www.microbiologybytes.com/maths/rtable.html
- Cox, G. (2005). Cox review of creativity in business: Building on the UK’s strengths. Retrieved from http://webarchive.nationalarchives.gov.uk/+/http:/www.hmtreasury.gov.uk/independent_reviews/cox_review/coxreview_index.cfm
- Cropley, D., & Cropley, A. (2005). Engineering creativity: A systems concept of functional creativity. In J. Kaufman & J. Baer (Eds.), Creativity across domains (pp. 169–185). London: Lawrence Erlbaum Associates.
- Cross, N. (2011). Design thinking: Understanding how designers think and work. New York, NY: Berg Publishers.10.5040/9781474293884
- Davis, G. A. (1992). Creativity is forever. Dubuque, IA: Kendall/Hunt Pub.
- Dubey, U., Kothari, D. P., & Awari, G. K. (2016). Quantitative techniques in business, management and finance: A case-study approach. Boca Raton, FL: CRC Press.
- Eisentraut, R., & Badke-Schaub, P. (1995). Creativity: A personality trait or an Illusion. Paper presented at the International workshop: Engineering design and creativity, State Scientific Library, Pilsen, Czech Republic.
- Elizondo, L. A., Kisselburgh, L. G., Hirleman, E. D., Cipra, R. J., Ramani, K., Yang, M., … Carleton, T. (2010). Understanding innovation in student design projects. In ASME 2010 International Design Engineering Technical Conferences and Computers and Information in Engineering Conference (pp. 805–810). American Society of Mechanical Engineers.
- FCAI. (2015). Can my vehicle operate on Ethanol blend petrol? Retrieved April30, 2015, from http://www.fcai.com.au/environment/can-my-vehicle-operate-on-ethanol-blend-petrol
- Fuge, M., Stroud, J., & Agogino, A. (2013). Automatically inferring metrics for design creativity. Paper presented at the ASME 2013 International Design Engineering Technical Conferences and Computers and Information in Engineering Conference.
- Gerber, E. M., & Martin, C. K. (2012). Supporting creativity within web-based self-services. International Journal of Design, 6(1), 85–100.
- Jagtap, S. (2016). Assessing design creativity: Refinements to the novelty assessment method. In DS 84: Proceedings of the DESIGN 2016 14th International Design Conference.
- Jagtap, S., Warell, A., Hiort, V., Motte, D., & Larsson, A. (2014). Design methods and factors influencing their uptake in product development companies: A review. In 13th International Design Conference, Cavtat – Dubrovnik, Croatia (pp. 231–240).
- Jagtap, S., Larsson, A., Hiort, V., Olander, E., & Warell, A. (2015). Interdependency between average novelty, individual average novelty, and variety. International Journal of Design Creativity and Innovation, 3(1), 43–60.10.1080/21650349.2014.887987
- Linsey, J. S. (2007). Design-by-analogy and representation in innovative engineering concept generation (PhD thesis). Austin: The University of Texas.
- Linsey, J., Wood, K. L., & Markman, A. (2008). Increasing innovation: Presentation and evaluation of the wordtree design-by-analogy method. In ASME 2008 International Design Engineering Technical Conferences and Computers and Information in Engineering Conference (pp. 21–32). American Society of Mechanical Engineers.
- Liu, Y. C., Chakrabarti, A., & Bligh, T. P. (2000). Further developments of FuncSION. In J. S. Gero (Ed.), Artificial intelligence in design’00 (pp. 499e519). Kluwer Academic Publishers.
- Lopez-Mesa, B., & Vidal, R. (2006). Novelty metrics in engineering design experiments. Paper presented at the DS 36: Proceedings DESIGN 2006, the 9th International Design Conference, Dubrovnik, Croatia.
- Nelson, B. A., Wilson, J. O., Rosen, D., & Yen, J. (2009). Refined metrics for measuring ideation effectiveness. Design Studies, 30(6), 737–743.10.1016/j.destud.2009.07.002
- Oman, S. K., Tumer, I. Y., Wood, K., & Seepersad, C. (2013). A comparison of creativity and innovation metrics and sample validation through in-class design projects. Research in Engineering Design, 24(1), 65–92.10.1007/s00163-012-0138-9
- Pahl, G., Beitz, W., Feldhusen, J., & Grote, K.-H. (2007). Engineering design: A systematic approach (Vol. 157). Berlin: Springer Science & Business Media.10.1007/978-1-84628-319-2
- Redelinghuys, C. (2000). Proposed criteria for the detection of invention in engineering design. Journal of Engineering Design, 11(3), 265–282.10.1080/095448200750021021
- Rumsey, D. J. (2007). Intermediate statistics for dummies. Hoboken, NJ: Wiley.
- Sadler, J., Shluzas, L., & Blikstein, P. (2016). Building blocks in creative computing: Modularity increases the probability of prototyping novel ideas. International Journal of Design Creativity and Innovation, 1–17.
- Sarkar, P., & Chakrabarti, A. (2008). Studying engineering design creativity-developing a common definition and associated measures.
- Sarkar, P., & Chakrabarti, A. (2011). Assessing design creativity. Design studies, 32(4), 348–383.
- Saunders, R. (2002). Curious design agents and artificial creativity a synthetic approach to the study of creative behavior (PhD thesis). Department of Architectural and Design Science, Faculty of Architecture, University of Sydney.
- Shah, J. J., Smith, S. M., & Vargas-Hernandez, N. (2003). Metrics for measuring ideation effectiveness. Design Studies, 24(2), 111–134.10.1016/S0142-694X(02)00034-0
- Snider, C. M., Culley, S. J., & Dekoninck, E. A. (2013). Analysing creative behaviour in the later stage design process. Design Studies, 34(5), 543–574.10.1016/j.destud.2013.03.001
- Sternberg, R. J., & Lubart, T. I. (1999). The concept of creativity: Prospects and paradigms. Handbook of creativity, 1, 3–15.
- Torrance. (2010). Retrieved from http://www.uwsp.edu/education/lwilson/creativ/define.htm
- Verhaegen, P. A., Vandevenne, D., Peeters, J., & Duflou, J. R. (2013). Refinements to the variety metric for idea evaluation. Design Studies, 34(2), 243–263.10.1016/j.destud.2012.08.003
- Weisberg, R. W. (1993). From creativity e beyond the myth of genius. W H Freeman and Co.
- Worinkeng, E., Joshi, S., & Summers, J. D. (2015). An experimental study: Analyzing requirement type influence on novelty and variety of generated solutions. International Journal of Design Creativity and Innovation, 3(2), 61–77.10.1080/21650349.2014.909294
- Yunus, A. C. (2003). Heat transfer: A practical approach. New York: MacGraw-Hill.