
ABSTRACT
Ideation is a key phase in engineering design and brainstorming is an established method for ideation. A limitation of the brainstorming process is idea production tends to peak at the beginning and quickly decreases with time. In this exploratory study, we tested an innovative technique to sustain ideation by providing designers feedback about their neurocognition. We used a neuroimaging technique (fNIRS) to monitor students’ neurocognitive activations during a brainstorming task. Half received real-time feedback about their neurocognitive activation in their prefrontal cortex, a brain region associated with working memory and cognitive flexibility. Students who received the neurocognitive feedback maintained higher cortical activation and longer sustained peak activation. Students receiving the neurocognitive feedback demonstrated a higher percentage of right-hemispheric dominance, a region associated to creative processing, compared to the students without neurocognitive feedback. The increase in right-hemispheric dominance positively correlated with an increase in the number of solutions during concept generation and a higher design idea fluency. These results demonstrate the prospective use of neurocognitive feedback to sustain the cognitive activations necessary for idea generation during brainstorming. Future research should explore the effect of neurocognitive feedback with a more robust sample of designers and compare neurocognitive feedback with other types of interventions to sustain ideation.
1. Introduction
A critical step in the design process is ideation (Cross, Citation1989). Anything that enriches this step in the design process can improve engineering outcomes that benefit society. Ideation, or idea generation, brings together problem understanding, engineering science, social factors, and practical knowledge to develop creative concepts and possible solutions (French, Citation1999). The quality and quantity of ideas generated during ideation inform and even determine design (Helm et al., Citation2016). During the ideation process, the production of new ideas tends to peak early in the design process and declines over time (Shealy et al., Citation2018), which can lead to a fixation effect on early solutions that prevents innovation (Gero, Citation2011).
In this paper, we present an experiment that tests a technique to sustain idea generation by providing designers feedback about their neurocognition. Neurocognitive feedback is successful in other domains (Hammond, Citation2011), including creative art training (Egner & Gruzelier, Citation2003), clinical application in the treatment of disorders and diseases (Marzbani et al., Citation2016), and brain-computer interface for self-regulation (Sitaram et al., Citation2017). For example, neurocognitive feedback was used to train musicians on attention and relaxation to improve their performance (Egner & Gruzelier, Citation2003). Neurocognitive feedback was also used as a collaborative and social experience for an art performance (Kovacevic et al., Citation2015). By providing designers neurocognitive feedback, we aim to extend the time and cognitive effort they spend generating new ideas.
Investigations into design neurocognition shed light on the correlation between creative thinking and the human’s brain activations. Creative tasks tend to recruit the right hemisphere of the brain more than the left hemisphere (Mihov et al., Citation2010). Hemispheric dominance (right or left hemisphere) emerges as an essential factor affecting creativity during design ideation (Mihov et al., Citation2010; Shealy & Gero, Citation2019). Limited research analyzed links between neurocognitive feedback and hemispheric lateralization (Barnea et al., Citation2005; Hammond, Citation2011). In this study, we attempt to fill that gap by exploring the effects of neurocognitive feedback on temporal hemispheric dominance for idea generation during brainstorming.
In the background section, we introduce brainstorming as an ideation technique, design cognition related to creativity, and the prospective use of neurocognitive feedback to enhance idea generation during brainstorming. The following sections detail our research questions, methodology, and results. The results highlight the effects of neurocognitive feedback on sustaining ideation and changing hemispheric lateralization. The discussion and conclusion provide insights and grounds for future research.
2. Background
2.1. Brainstorming: an established technique for idea generation
Many techniques exist to assist designers during idea generation (Smith et al., Citation1995). For decades, brainstorming has remained a common tool to enrich idea propositions (Isaksen & Gaulin, Citation2005). During brainstorming, a designer or a group of designers are instructed to generate imaginatively as many ideas as possible while suspending criticism of the ideas generated (Hernandez et al., Citation2010). Previously generated ideas combine to form new ones (Pinsonneault et al., Citation1999). Only after this process ends can designers evaluate and filter concepts with given parameters (Osborn & Alex, Citation1953).
The cognitive process needed for brainstorming originates in the mental structures that control memory cognition (Potter & Balthazard, Citation2004). This type of brainstorming works by classifying attributes of ideas into short-term memories, which serve as probes to seek and retrieve matching traces in long-term memory and transform these memories into new and modified mental schemas (Cross, Citation2001). Continuing to brainstorm requires repeated prompts to memory functions that reinitiate the search process. For each new search process, designers necessitate more mental energy (Alexiou et al., Citation2011).
Different modes of cognitive processing or perceptual attention influence creativity during brainstorming (Fillion, Citation2015; Förster, Citation2012; Friedman et al., Citation2003). Perceptual attention refers to the attention involved in processing task-related stimuli (Murphy & Greene, Citation2016). Processing information holistically (global conceptual processing) with a broad scope of perceptual attention leads to the generation of remote and dissimilar concepts, while processing the elements (local conceptual processing) with a narrow scope of perceptual attention results in closely related ideas (Förster, Citation2012; Friedman et al., Citation2003). When generating ideas, global processing compared to local processing supports creativity in brainstorming outputs (Fillion, Citation2015). Prior neurocognitive research indicates that participants perform the execution of both cognitive processing laterally in one of the two hemispheres in their brain (Coulson & Van Petten, Citation2007).
2.2. Creativity and the brain: role of the prefrontal cortex (PFC) and hemispheric lateralization
Creativity in design requires higher cognitive functions (Dietrich, Citation2004). The prefrontal cortex (PFC), as the neural basis of working memory and higher-order cognitive processing, plays a threefold role in the creative process (Dietrich, Citation2004, Citation2019). First, creative insights appear when represented in working memory associated with the PFC (Dietrich, Citation2004; Gabora, Citation2002). Then, the insights are combined and converted into creative solutions, which is dependent on the PFC’s higher-order functions, such as sustained attention, memory retrieval, cognitive flexibility, evaluations, and reasoning (Fuster, Citation1988). Finally, the expression of creative ideas, through lexical or figural skills, is implemented through function in the PFC (Bentin et al., Citation1985; Mihov et al., Citation2010).
The PFC functionally divides into sub-regions, including the medial prefrontal cortex (mPFC), dorsolateral prefrontal cortex (DLPFC), and ventrolateral prefrontal cortex (VLPFC), which contribute to different aspects of creative processing. The mPFC is associated with the retrieval of both short-term and long-term memories (Euston et al., Citation2012), cognitive empathy and perspective taking (Seitz et al., Citation2006). Increased activation in the mPFC is associated with an improved ability to simulate future imaginative events (Meyer et al., Citation2019). The DLPFC is highly active in creative tasks involving visuospatial divergent thinking, making new associations, convergent thinking, and evaluations (Funahashi, Citation2017). The VLPFC is critical for combining existing information into new ideas (Dietrich, Citation2004; Wu et al., Citation2015).
Noticeably, a discernible hemispheric distinction between the right and left parts of the sub-regions emerges (Dietrich, Citation2004; Mihov et al., Citation2010). For instance, making analytical judgments, evaluation, verbal processing, and goal-directed behaviors mainly recruit the left DLPFC (Gabora, Citation2010; Luft et al., Citation2017), while the activation in the right DLPFC is closely associated with sustained attention, divergent thinking, and holistic thinking (Cabeza & Nyberg, Citation2000; Gilbert et al., Citation2010; Wu et al., Citation2015). The right VLPFC supports the capacity to detect similarities between items (Garcin et al., Citation2012) and generate alternatives to explore the problem space (Goel & Vartanian, Citation2005).
The hemispheric lateralization associated with asymmetric cognitive functions is often identified in cognitive studies for creativity (Mihov et al., Citation2010; Shulman et al., Citation2010). A systematic meta-analytic review of the neurophysiological process and lateral dominance of creativity supports the notion of right hemispheric superiority in creative thinking and idea generation (Mihov et al., Citation2010). In the 88 studies previously reviewed (20 neuroimaging studies and 68 studies using correlational behavioral measures), right hemispheric dominance for creative thinking is significant (Mihov et al., Citation2010). Pidgeon et al. (Citation2016) also confirmed the contribution of right hemisphere dominance in visual creativity in open-ended questions in their systematic review including 27 neuroimaging experiments (fMRI and EEG). The right hemisphere shows significantly higher activation in creative thinking in relation to several cognitive functions: a more decisive contribution to global processing (Friedman et al., Citation2003), abstract thinking (Mashal et al., Citation2005), and ill-structured representation and computation (Gilbert et al., Citation2010). Previous research also found left-hemispheric dominance or bilateral activation in creative processing. For instance, many creative tasks are lexical, relying on complicated verbal processing in the left hemisphere, which might overshadow right-hemispheric activation (Bentin et al., Citation1985; Mihov et al., Citation2010). A prior design cognition study also found left-hemispheric dominance when engineering students ideated for engineering problems using different concept generation techniques, suggesting possible design fixation behavior (Shealy & Gero, Citation2019). However, hemispheric dominance does not necessarily mean only one side of the brain is involved in creative tasks. Many interactions occur between the two hemispheres, generating excitatory or inhibitory effects for creative processing (Abraham, Citation2014; Dietrich, Citation2019). Interhemispheric interactions is another critical research direction in design neurocognition studies (Boccia et al., Citation2015).
2.3. Developing tools to sustain creativity: the prospective use of neurocognitive feedback
The cognitive search process during ideation tends to decay over time (Viswanathan, Citation2017), resulting in many solutions generated early in the process and fewer later (Helquist et al., Citation2007; Howard et al., Citation2008). The prior products of memory search that lead to the earlier ideas might interfere with the generation of new ideas, reducing idea generation over time (Ditta & Storm, Citation2017; George et al., Citation2019; Storm & Hickman, Citation2015). Designers’ fixation on the earlier ideas caused by an evaluation of detailed elements (Shealy & Gero, Citation2019) or resource constraint (Shealy & Hu, Citation2017) could also prompt a decrease of idea generation. Devoting new cognitive resources to fewer ideas eventually becomes ineffective, and thus designers stop expending new cognitive resources (Alexiou et al., Citation2011; Shealy et al., Citation2017). In either explanation, the number of retrieved or new generated ideas during brainstorming decreases over time (Helquist et al., Citation2007; Howard et al., Citation2008).
To address the reduction in idea generation over time during brainstorming, we explored the prospective use of neurocognitive feedback. Neurocognitive feedback improves performance by making information about hidden brain states accessible to our consciousness (Hammond, Citation2011). It provides a feedback loop to induce learning mechanisms and allows individuals to search for appropriate mental strategies through self-regulatory control of brain activity (Faller et al., Citation2019). Neurocognitive feedback can effectively change localized brain activity by tapping into learning processes (Marzbani et al., Citation2016; Vernon et al., Citation2003). Studies in many other fields, such as creative art training (Egner & Gruzelier, Citation2003), cognitive performance (Vernon et al., Citation2003), clinical application in the treatment of disorders or diseases (Marzbani et al., Citation2016), and brain-computer interface (Sitaram et al., Citation2017) show that subjects can learn self-regulation of specific brain activity with neurocognitive feedback. For instance, people who receive neurocognitive feedback learn to increase a particular component of their cognitive activity assisting semantic processing in working memory (Wei et al., Citation2017) and attention (Alchalcabi et al., Citation2017; Kaiser & Othmer, Citation2000).
The cost of a neurocognitive feedback system is inexpensive (e.g. starting under $10,000) compared to the millions of dollars invested in an engineering project. Neurocognitive feedback interventions can occur in situ, making it a relevant affordable design tool. Other interventions, such as human interactions can also sustain concept generation, but neurocognitive information is individual and can be used to provide customized feedback. Personalized feedback based on designers’ neurophysiological responses may teach self-regulation more efficiently than cognitive or behavioral feedback. The study presented in this paper aimed to explore the use of neurocognitive feedback to: 1) help designers better understand their design neurocognitive patterns of performance and 2) improve their mental ability to adjust their cognitive approach during design quickly. The results from this preliminary study provide grounds for the development of a neurocognitive feedback tool to sustain creativity.
3. Research questions
To explore the prospective use of neurocognitive feedback to sustain idea generation during brainstorming, we proposed the following questions:
What are the effects of neurocognitive feedback on the fluency of designers’ ideas generated during brainstorming?
Does neurocognitive feedback sustain activation in the prefrontal cortex during brainstorming?
Does neurocognitive feedback influence designers’ hemispheric lateralization during brainstorming?
How does hemispheric lateralization dominance correlate with designers’ brainstorming behaviors?
When provided with real-time neurocognitive feedback and instruction to sustain their activation in the PFC, participants in the experimental group were expected to self-regulate their neurocognition and change their concept generation behavior.
4. Methods
4.1. Experimental design
To explore the effects of neurocognitive feedback on idea generation, ten graduate engineering students from Virginia Tech (all male and right-handed) were recruited to generate solutions to design problems using brainstorming. The design ideation task focused on the first/last mile mobility problem about transporting people between mass transit stops and their residential dwellings (Tilahun et al., Citation2016). The first/last mile task brief is presented in the Appendix. Students were asked to describe their solutions verbally. They were told the goal of the design ideation task was to develop as many solutions as possible. They had no time limit to complete the task. To control for the influence of the design task on participants, all subjects completed the same first/mile mobility problem in the same lab setting and between-group comparisons were used in the statistical analyses.
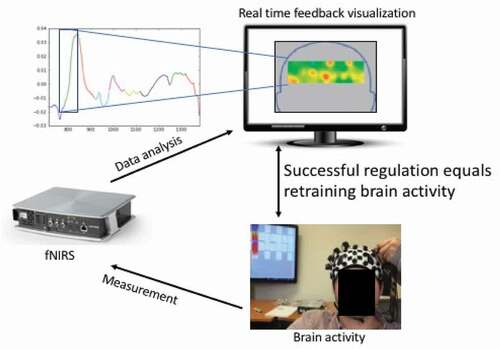
Before the task began, students were outfitted with the neuroimaging instrument that measures their change in oxygenated blood in the prefrontal cortex (PFC). Half of the students received real-time feedback about their oxygenated blood (Oxy-Hb) in their PFC. Students were randomly chosen whether to receive the neurocognitive feedback or not. The purpose of providing this feedback was to raise self-awareness about their cognitive activation patterns and help them sustain activation. Participants were instructed to look at their feedback and to sustain activation across the PFC. Increased activation was shown as red on the heat map, illustrated in . The consistent spatial distribution of fNIRS signals compared to EEG signals suggests fNIRS is a promising tool for investigating the neural mechanisms of neurocognitive feedback (Zhang et al., Citation2014). A recent systematic review on fNIRS neurocognitive feedback also pointed out the advantage of using fNIRS, such as ease of use, portability, affordability, and resistance to motion artifacts (Kohl et al., Citation2020). Nonetheless, there is still a lack of standard methods for fNIRS neurocognitive feedback. For instance, Turbo-Satori developed a neurocognitive feedback app for the NIRx fNIRS system (Lührs & Goebel, Citation2017). In this study, Shimadzu’s LIGHTNIRS system and its fNIRS interface was used (Li et al., Citation2020; Pinti et al., Citation2018; Shimadzu Corporation, Citation2016; Shin et al., Citation2018). The LIGHTNIRS systems provide a visual feedback through brain activation heat maps in this study. This type of color-coded topographic maps which display the signal change of all channels has been used in previous fNIRS neurocognitive feedback studies (Barth et al., Citation2016; Kober et al., Citation2018; Lapborisuth et al., Citation2017). Real-time Oxy-Hb in each channel serves as input to produce the heat map by detrending and normalizing over a 10-second moving window (Lapborisuth et al., Citation2017), where red means high activation, green neutral, and blue negative, .
Figure 1. fNIRS neurocognitive feedback device setup.
4.2. A tool to measure neurocognition
Flow of oxygenated blood measured with functional near-infrared spectroscopy (fNIRS) provided neurocognitive feedback. fNIRS offers comparable spatial resolution to electroencephalography (EEG) and enables subjects to sit in a relatively naturalistic setting compared to functional magnetic resonance imaging (fMRI) (Shealy & Hu, Citation2017). fNIRS is also easier to prepare for neurocognitive feedback trials compared to EEG. Data collection with fMRI is constraining because the scanner encloses participants. The recent development of portable fNIRS devices also makes the potential for ecological validity greater than fMRI. fNIRS emits a near-infrared light into the human cortex, and unabsorbed reflected light is detected by sensors (Ferrari & Quaresima, Citation2012). The change in light absorption indicates the change in oxy- and deoxy-blood.
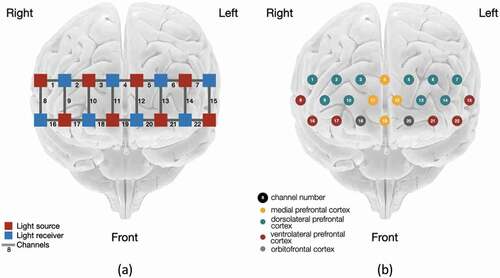
The region of interest for measuring the change in Oxy-Hb is the prefrontal cortex (PFC) and its sub-regions, including dorsolateral PFC (DLPFC), medial PFC (mPFC), and ventrolateral PFC (VLPFC). Sub-regions within the PFC are analyzed in most cognitive studies about design (Shealy et al., Citation2017), decision-making (Hu & Shealy, Citation2019), and planning because of their associated cognitive functions. The DLPFC is related to cognitive flexibility, working memory, and abstract reasoning (Soltanlou et al., Citation2018). The mPFC is a critical region for memory retrieval (Euston et al., Citation2012). The VLPFC is involved in similarity detection and alternative generation (Dietrich, Citation2004; Garcin et al., Citation2012; Wu et al., Citation2015). The data used to provide neurocognitive feedback and for the analysis was the change in Oxy-Hb over time in the PFC. We used Oxy-Hb instead of Deoxy-Hb or total blood because of its high sensitivity to cerebral blood flow (Cazzell et al., Citation2012; Cui et al., Citation2011; Hu & Shealy, Citation2019). The arrangement of sensors and detectors on the PFC is illustrated in .
Figure 2. (a) Sensors placement and (b) prefrontal cortex (PFC) sub-regions monitored (Base of brain image copyright © Society for Neuroscience (2017)).
4.3. Data analysis
The design outcomes, including the number of ideas generated, the completion time of the design task, and the design fluency (time between ideas), were compared between the two groups using Mann-Whitney U tests. Considering the small sample size of ten (five in each group), a nonparametric test (Mann-Whitney U test) was used (Nguyen & Zeng, Citation2014; Siegel, Citation1956).
Two levels of analysis were performed: group level and individual level. As participants did not have a time limit, there was variability in task length. For group-level analysis of activation patterns, channels measurements were divided into ten equal segments or deciles and aggregated across participants to allow for the comparison of variability across time. This segmenting technique mirrors previous design cognition studies (Gero et al., Citation2013) and design neurocognition studies with fNIRS (Milovanovic et al., Citation2020; Shealy et al., Citation2020) assessing temporal aspects of design cognition. An assumption is that the concept generation follows a similar temporal dynamic for each of the participants. Segmenting normalizes time across subjects and serves to average patterns of cognitive activation across time. This moving window of fixed segments approach is adopted from design protocol studies (Kan & Gero, Citation2017) in which the design process was segmented into deciles (ten segments) or ventiles (twenty segments) for more details based on subject’s behavior.
Oxy-Hb for each participant was normalized using Fisher z-transformation as z-scores (Klein & Kranczioch, Citation2019). Participants’ change of Oxy-Hb was averaged together for each of the ten segments. For the individual level analysis of hemispheric lateralization, the dominant hemisphere is determined by the significant difference in the Oxy-Hb mean value between the left and right PFC (Mihov et al., Citation2010). Two sample t-tests were used to compare average Oxy-Hb z-scores between participants in the two groups. ANOVA was used to compare between the brain regions. Significance was defined as p < 0.05. Effect size was measured using Cohen’s d for the significant difference for t tests and Mann-Whitney U tests and η2 (Eta squared) for ANOVA. The difference is regarded as a large effect when Cohen’s d > 0.8 and η2 > 0.138 (Cohen, Citation1977).
5. Results
5.1. Neurocognitive feedback increases student designers’ fluency of idea generation
To address Research Question One, participants’ design behaviors were compared between the two groups. The participants who received the neurocognitive feedback produced more ideas (7.8 ideas on average) than the control group (3.8 ideas on average), and the difference was significant (t = 1.00, p = 0.02). The time participants spent brainstorming was similar (p = 1.00) between the two groups. On average, participants who received the neurocognitive feedback spent less time brainstorming (163 seconds on average) than the control group (185 seconds on average). However, the neuro-feedback group was more fluent in their idea generation. A Mann-Whitney U test between the two groups shows that the time between ideas (fluency) was less (t = 3.00, p = 0.05) for the experimental group (27 seconds between ideas on average) compared to the control group (48 seconds) with a large effect size (Cohen’s d = 1.51). below includes the design metrics and statistical results between the two groups.
Table 1. Design metrics
5.2. Neurocognitive feedback leads to sustained activation in the prefrontal cortex
To compare the temporal difference in the activation between the control group (no neurocognitive feedback) and experimental group (neurocognitive feedback) (Research Question Two), we analyzed the group average of oxygenated blood (Oxy-Hb) in the prefrontal cortex (PFC) across the ten deciles (). In the first five deciles (deciles 1–5), recurring high activation is observed in multiple channels for both groups. In the last five deciles (deciles 6–10), the experimental group showed repeating high activation, especially in the ventrolateral PFC. In contrast, the control group did not show high activation in the PFC in the second half of the brainstorming session compared to the experimental group.
Table 2. Brain activation heat map for the control and neurocognitive feedback group by deciles
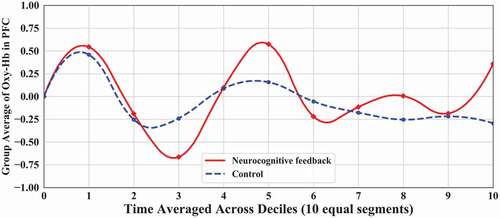
To explore the temporal change of participants’ neurocognitive activation in the PFC, the group averages of Oxy-Hb in the PFC were interpolated across the ten deciles. For the control group, the result showed a decay in brain activation when generating ideas during brainstorming (). The slope of the linear fit was negative, which indicated a decrease in neurocognitive activation over time. This decay pattern was also observed in the activation heat maps in . In contrast, for the experimental group, the neurocognitive feedback intervention reversed the decay of activation. Neurocognitive feedback elicited sustained peak activation during concept generation as the linear fit slope is positive (). The activation heat map in also illustrates the sustained peak activation in the neuro-feedback group over the last five deciles.
Figure 3. Decay in activation in the PFC for the control group.
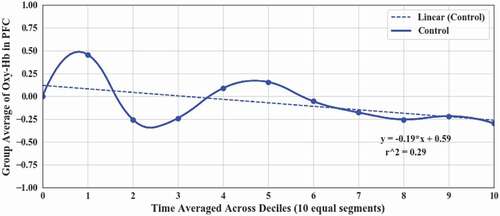
Figure 4. Sustained activation in the PFC for the neurocognitive feedback group.
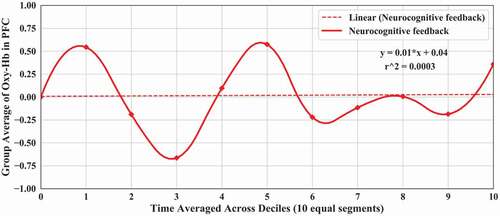
When participants received real-time feedback about their brain activation, they applied more cognitive effort in the PFC, shown in . The average Oxy-Hb over deciles was significantly higher (t = 2.37, p = 0.027, Cohen’s d = 1.05) for the group with neurocognitive feedback compared to the control group. Another finding was the similarity of the cortical activation evolution over time that follows an oscillating curve. This phenomenon appears in both groups () and illustrates an alternation of activation and deactivation. This pattern might account for a cycle in the idea generation process during brainstorming. We also noticed that both the peak amplitude (highest amplitude value) and trough amplitude (lowest amplitude value) are higher in the experimental group compared to the control group. The amplitude remains high across time with neurocognitive feedback, whereas without this feedback, the amplitude drops across the brainstorming session.
Figure 5. Higher activation and deactivation cycles in the PFC for the neurocognitive feedback group compared to the control group.
5.3. Neurocognitive feedback changes the region-specific activation variability between PFC sub-regions
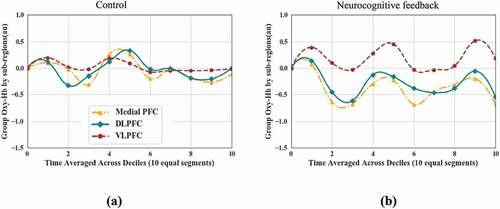
As seen previously in the activation map in , the PFC sub-regions vary in their patterns of activation between the two groups. To investigate the impacts of neurocognitive feedback on the temporal activation of specific sub-regions in the PFC, we compared the average Oxy-Hb across deciles for each group in three sub-regions of the PFC: the dorsolateral PFC (DLPFC), medial PFC (mPFC), and ventrolateral PFC (VLPFC). illustrates the change of Oxy-Hb with interpolation over deciles for the control and neuro-feedback group for all three sub-regions. For the control group, DLPFC, mPFC, and VLPFC show changes across deciles. The Oxy-Hb for the control group average in the three sub-regions display no significant difference over ten deciles.
For the experimental group with neurocognitive feedback, a similar occurrence was observed among the sub-regions, suggesting possible coordination and co-activation between regions. ANOVA indicates significant differences in activation levels (F(2,27) = 26.48, p < 0.001) among the sub-regions with a large effect size (partial n = 0.66). VLPFC shows a higher activation level than the DLPFC and mPFC across the ten deciles. Between the two groups, the most significant difference in sub-region activation is also observed in the VLPFC.
Figure 6. Region-specific variability in PFC sub-regions: (a) the control group; (b) the experimental group with neurocognitive feedback.
5.4. Neurocognitive feedback changes hemispheric lateralization during brainstorming
Hemispheric lateralization appears when performing creative tasks (Mihov et al., Citation2010; Shulman et al., Citation2010). To investigate the effects of neurocognitive feedback on hemispheric lateralization during brainstorming, the dominant hemisphere is analyzed for each participant (Research Question Three). Similarly to prior research, in this study the dominant hemisphere was defined as the hemisphere with significantly higher activation compared to the other hemisphere (Mihov et al., Citation2010). Three out of five control group participants showed left-hemispheric dominance, and the remaining two showed right dominance. In contrast, all five participants in the experimental group with neurocognitive feedback displayed right-hemispheric dominance. As illustrates, the Chi-square test suggests neurocognitive feedback (Chi-square = 4.29, p = 0.038) alters hemispheric lateralization and leads to right-hemispheric dominance during brainstorming.
Table 3. Individual hemispheric dominance during brainstorming
Besides measuring the overall hemispheric dominance throughout the task, the temporal hemispheric dominance dynamic was analyzed for each participant. Oxy-Hb in the left and right hemispheres of a participant during brainstorming is classified into two states of hemispheric dominance: right hemisphere dominance (mean Oxy-Hb in the right hemisphere > mean Oxy-Hb in the left hemisphere) and left hemisphere dominance (mean Oxy-Hb in the right hemisphere < mean Oxy-Hb in the left hemisphere). illustrates the mean Oxy-Hb in the left and right hemisphere and hemispheric dominance for all 10 subjects. The shaded colors of yellow and blue represent the two states of hemispheric dominance, right and left dominance, respectively.
Figure 7. Oxy-Hb in the left and right PFC and hemispheric dominance: (a) control group; (b) neurocognitive feedback group.
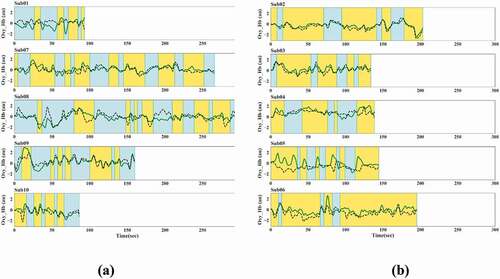
The percentage of right dominance is calculated for all subjects and compared between the two groups using a Mann-Whitney U test. Right hemispheric dominance appears significantly more (t = 1.00, p = 0.02) in the neurocognitive feedback group compared to the control group as shown in and . The dominance of the right hemisphere increases from 46.1% of the task length (SD = 9.5%) for the control group to 73.1% of the task length (SD = 10.2%) for the neuro-feedback group. The effect size is large (Cohen’s d = 2.44).
Additionally, illustrates a sustained hemispheric dominance in the right hemisphere for the neurocognitive feedback group. More frequent dominance shifts occur in the control group than the neurocognitive feedback group. The average time of hemispheric dominance on one side of the brain is calculated for each subject. A Mann-Whitney U test indicates a difference between the groups (t = 2.00, p = 0.03). The right hemispheric dominance duration is higher for the neurocognitive feedback group (Mean = 29.9 seconds, SD = 6.1 seconds) compared to the control group (Mean = 15.1 seconds, SD = 2.6 seconds) with a large effect size (Cohen’s d = 3.16).
5.5. Hemispheric lateralization correlates with designers’ behaviors
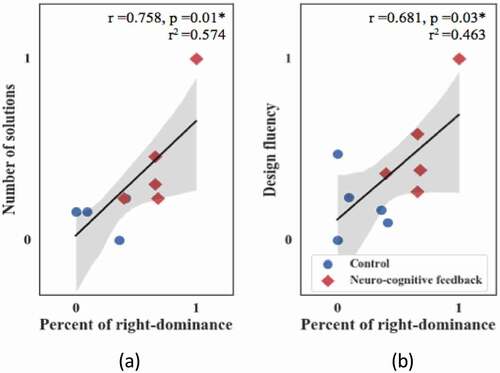
Performing a correlation analysis between the individual percentage of right-hemispheric dominance and ideation outcomes serves to understand the impacts of hemispheric dominance on the number of ideas generated and design fluency (Research Question Four). illustrates the positive relationship between the brain behavior and cognitive performance while generating ideas. The data for the correlation analysis is normalized between 0 and 1 with a min-max standardization. Pearson correlation coefficients between the distribution of right-hemispheric dominance, number of solutions, and design fluency (here design fluency is defined as 1/time between ideas) are significantly positive with large coefficients of determination.
Figure 8. Correlation between (a) right-hemisphere dominance and number of design solutions, (b) right-hemisphere dominance and design fluency.
6. Discussion
This study explored the prospective effectiveness of neurocognitive feedback to sustain design creativity during design ideation. Neurocognitive feedback has significant impacts on students’ behaviors when they generate ideas using brainstorming. On average, participants in the neurocognitive feedback group developed more solutions than participants in the control group. Neurocognitive feedback did not extend the time participants spent brainstorming but rather helped them become more efficient during the design ideation task. Consequently, the fluency of design ideas significantly improved. Differences in design fluency might be due to using varying cognitive strategies in the control and neurocognitive feedback groups. Participants in the control group might have spent their cognitive effort on unnecessary processing, limiting their search for new concepts. For example, two participants in the control group required a much longer time than the average completion time to generate more solutions at the expense of losing efficiency and limiting fluency. In contrast, the experimental group who received real-time neurocognitive feedback and the instruction to ‘light up’ their activation heat map, might have managed to regulate their neurocognitive processing to sustain brain activation and facilitate concept searching.
Different activation patterns appeared across the PFC and its sub-regions. The average Oxy-Hb for the control group decays overtime. This decreasing activation pattern throughout the brainstorming session suggests reduced cognitive efforts. Participants in the control group allocated more cognitive resource to the left hemisphere resulting in resource constraints in the right PFC. Limited resources in the right PFC can explain the diminution of ideas for the control group. A prior study also reported a limitation of cognitive resource allocation for concept generation without proper instruction or tools (Hu et al., Citation2019; Shealy & Hu, Citation2017). Across time, participants receiving neurocognitive feedback succeeded in maintaining cortical activation and sustaining peak activation in their PFC, which coheres with the results on design fluency.
The use of different cognitive strategies is reflected in the different patterns of brain activations. Prior neuroscience research found that patients with right frontal lesions were significantly impaired in a design fluency task (Jones-Gotman & Milner, Citation1977). Design fluency tends to activate the PFC bilaterally but elicits more right-sided blood flow elevations during the task (Elfgren & Risberg, Citation1998). These results suggest design fluency might be mainly mediated by the right PFC (Baldo et al., Citation2001). The correlation analysis, shown in , demonstrates the positive relationship between right-hemispheric dominance and design fluency. The findings in this study agrees with prior ones on the relation between the right PFC activation and design fluency. Neurocognitive feedback leads to a significantly increased temporal right-hemispheric dominance (from 46.1% to 73.1%). Correspondingly, participants in the neurocognitive feedback group generated more ideas with higher design fluency.
Participants in the control group with higher dominance in the left hemisphere were not as productive as participants in the neurocognitive feedback group. The left PFC is usually associated with making analytical judgments, evaluation, verbal processing, and goal-directed behaviors (Gabora, Citation2010; Luft et al., Citation2017). We also observed a more frequent shift between the left-hemispheric and right-hemispheric dominance for the control group than the neurocognitive feedback group. Lateral hemisphere shifts might account for the different design behaviors between groups and should be explored in future studies.
Sub-region analysis provides deeper insights into activation differences between the two groups. The region showing the most significant difference in activation levels is the ventrolateral PFC (VLPFC). The VLPFC is critical for combining existing information into new ideas and support the ability to generate alternatives to explore the problem space (Dietrich, Citation2004; Goel & Vartanian, Citation2005; Wu et al., Citation2015). Participants receiving neurocognitive feedback sustained activation in the VLPFC significantly more than participants in the control group. Activation differences in the VLPFC in our study supports previous findings in the neuroscience literature. Additionally, the similar evolution of Oxy-Hb in all three sub-regions for the neurocognitive feedback group, in contrast to the varying patterns of Oxy-Hb for the control group, might suggest better coordination and co-activation between sub-regions for when receiving neurocognitive feedback. Prior work in design cognition for creativity focused on brain coordination between different regions (Beaty et al., Citation2016; Kowatari et al., Citation2009). Higher coordination in the neurocognitive feedback group can explain the generation of a higher number and a better design fluency.
7. Limitations
As fNIRS-based neurocognitive feedback research is in an early stage, standardizing methods for experimental design, training protocol, and offline processing is still under discussion. Using a loosely controlled experiment and removing the constraints of a block design would improve the current understanding about the underlying processes of design neurocognition (Hay et al., Citation2019). There are some limitations in the study. The first limitation is the sample size. A systematic literature review on neuropsychological study for creativity reports experiments with sample sizes between 5 and 78 participants (Mihov et al., Citation2010). Our sample size is in the lower range with ten participants. Nonparametric methods were used for comparisons between the two groups. Small sample size necessitates caution in the interpretation and generalization of the reported results. Future research should replicate the study with a larger sample size. Randomization was used to normalize individual difference (e.g. knowledge, skills, and also cognitive state) between the control and intervention groups, but future studies should further explore individual variations using a within-subject research design.
The second limitation is the limited choice of behavioral measures: number of ideas and design fluency. Metrics, including quantity, quality, novelty, and variety, are essential for measuring the effectiveness of design ideation (Shah et al., Citation2003). Brainstorming requires suspended evaluation and is typically evaluated based on the novelty of solutions generated (Kudrowitz & Wallace, Citation2013). Osborn and Alex (Citation1953), who developed brainstorming, noted that ‘it is almost axiomatic that quantity breeds quality in ideation’. It led us to use the quantity (i.e. number of unique ideas) as an objective measurement of design outcomes. Design fluency was exploited as a behavioral indicator since prior literature demonstrated that fluency and novelty of solutions positively correlate (Hocevar, Citation1979; Kudrowitz & Wallace, Citation2013; Paulus et al., Citation2011). More metrics related to design outcomes, such as novelty and quality, should be included in future studies to measure designers’ behaviors and outcomes. Here, the analysis focused more on the neurocognition of ideation during brainstorming with neurocognitive feedback.
Another limitation of this study is the selection of brain regions of interest. Generally, neuroimaging studies that do not capture whole-brain activation have limited brain regions of interest (Ayaz et al., Citation2012; Cazzell et al., Citation2012). Only the prefrontal cortex (PFC) was monitored in this study. PFC acts as the neural basis of working memory and higher-order cognitive processing necessary for the creative process (Dietrich, Citation2004, Citation2019) but we do not suggest PFC is the ‘seat of creativity’. Other regions (e.g. parietal cortex) might be involved in creative design cognition and should be regions of interests in future studies. There are also limitations in the fixed, non-overlapping, and equal fractioning technique. The segmentation method is based on the assumption that participants follow a similar path of cognitive activation. Future research could explore using a sliding window segmentation approach to capture dynamics in design neurocognition. The sliding window method can better capture the temporal dynamics of cognitive activation and avoid the assumption of similar patterns of cognitive activation among participants (Allen et al., Citation2014; Y. Zhang & Zhu, Citation2020).
8. Conclusions
Our results show a positive impact of neurocognitive feedback on student designers’ creative behavior during design ideation using brainstorming. Neurocognitive feedback improved their efficiency during the task resulting in a significant improvement of the fluency of design ideas generated. Across time, participants with the neurocognitive feedback succeeded in maintaining cortical activation in their prefrontal cortex, a brain region most closely related to working memory, cognitive flexibility, and abstract reasoning. This coheres with our findings on design fluency. The most significant increase of activation occurred in the ventrolateral PFC, an important region for combining existing information into new ideas and supporting the ability to generate alternatives to explore the problem space (Dietrich, Citation2004; Goel & Vartanian, Citation2005; Wu et al., Citation2015). While not all neurological changes have a causal relationship with cognition and behavior (Fishburn et al., Citation2014), an association between the number of ideas proposed and the increase of oxygenated blood in the PFC seems evident. The positive relationship between right-hemispheric dominance, and number of ideas produced and increased design fluency makes this brain – behavior correlation more apparent. Neurocognitive feedback led to a temporal right-hemispheric dominance, which is critical for creative processing (Mihov et al., Citation2010).
These results should be interpreted with caution because of our limited sample size. The results presented in this paper demonstrate the prospective use of neurocognitive feedback to sustain idea generation, but more research is necessary. A larger sample and multiple additional studies are needed before formulating any generalization of the results. Future work should evaluate the effect of neurocognitive feedback on the quality of ideas generated (Shah et al., Citation2003), investigate coordination between different brain regions using network analysis (Hu et al., Citation2019; Shealy et al., Citation2018), and explore the relationship between hemispheric dominance shifts and creative ideation. Future studies can begin to use more sophisticated prediction models to explain the relationship between the brain and behavior with more participants. While this study was focused on idea generation during brainstorming, similar opportunities emerge to improve performance during other phases of design.
Acknowledgments
This material is based in part on work supported by The National Science Foundation, through Grant EEC-1929892 and EEC-1929896. Any opinions, findings and conclusions or recommendations expressed in this material are those of the author(s) and do not necessarily reflect the views of the National Science Foundation.
Additional information
Funding
References
- Abraham, A. (2014). Creative thinking as orchestrated by semantic processing vs. Cognitive control brain networks. Frontiers in Human Neuroscience, 8, 95. https://doi.org/https://doi.org/10.3389/fnhum.2014.00095
- Alchalcabi, A. E., Eddin, A. N., & Shirmohammadi, S. (2017). More attention, less deficit: Wearable EEG-based serious game for focus improvement. 2017 IEEE 5th International Conference on Serious Games and Applications for Health (SeGAH),IEEE, 1–8. https://doi.org/https://doi.org/10.1109/SeGAH.2017.7939288
- Alexiou, K., Zamenopoulos, T., & Gilbert, S. (2011). Imaging the designing brain: A neurocognitive exploration of design thinking. In J. S. Gero (Ed.), Design computing and cognition ’10 (pp. 489–504). Springer. https://doi.org/https://doi.org/10.1007/978-94-007-0510-4_26
- Allen, E. A., Damaraju, E., Plis, S. M., Erhardt, E. B., Eichele, T., & Calhoun, V. D. (2014). Tracking whole-brain connectivity dynamics in the resting state. Cerebral Cortex, 24(3), 663–676. https://doi.org/https://doi.org/10.1093/cercor/bhs352
- Ayaz, H., Shewokis, P. A., İzzetoğlu, M., Çakır, M. P., & Onaral, B. (2012). Tangram solved? Prefrontal cortex activation analysis during geometric problem solving. 2012 Annual International Conference of the IEEE Engineering in Medicine and Biology Society, IEEE, 4724–4727. https://doi.org/https://doi.org/10.1109/EMBC.2012.6347022
- Baldo, J. V., Shimamura, A. P., Delis, D. C., Kramer, J., & Kaplan, E. (2001). Verbal and design fluency in patients with frontal lobe lesions. Journal of the International Neuropsychological Society: JINS, 7(5), 586–596. https://doi.org/https://doi.org/10.1017/S1355617701755063
- Barnea, A., Rassis, A., & Zaidel, E. (2005). Effect of neurofeedback on hemispheric word recognition. Brain and Cognition, 59(3), 314–321. https://doi.org/https://doi.org/10.1016/j.bandc.2004.05.008
- Barth, B., Strehl, U., Fallgatter, A. J., & Ehlis, A.-C. (2016). Near-infrared spectroscopy based neurofeedback of prefrontal cortex activity: A proof-of-concept study. Frontiers in Human Neuroscience, 10. https://doi.org/https://doi.org/10.3389/fnhum.2016.00633
- Beaty, R. E., Benedek, M., Silvia, P. J., & Schacter, D. L. (2016). Creative cognition and brain network dynamics. Trends in Cognitive Sciences, 20(2), 87–95. https://doi.org/https://doi.org/10.1016/j.tics.2015.10.004
- Bentin, S., McCarthy, G., & Wood, C. C. (1985). Event-related potentials, lexical decision and semantic priming. Electroencephalography and Clinical Neurophysiology, 60(4), 343–355. https://doi.org/https://doi.org/10.1016/0013-4694(85)90008-2
- Boccia, M., Piccardi, L., Palermo, L., Nori, R., & Palmiero, M. (2015). Where do bright ideas occur in our brain? Meta-analytic evidence from neuroimaging studies of domain-specific creativity. Frontiers in Psychology, 6. https://doi.org/https://doi.org/10.3389/fpsyg.2015.01195
- Cabeza, R., & Nyberg, L. (2000). Imaging cognition II: An empirical review of 275 PET and fMRI studies. Journal of Cognitive Neuroscience, 12(1), 1–47. https://doi.org/https://doi.org/10.1162/08989290051137585
- Cazzell, M., Li, L., Lin, Z.-J., Patel, S. J., & Liu, H. (2012). Comparison of neural correlates of risk decision making between genders: An exploratory fNIRS study of the Balloon Analogue Risk Task (BART). Neuroimage, 62(3), 1896–1911. https://doi.org/https://doi.org/10.1016/j.neuroimage.2012.05.030
- Cohen, J. (1977). Statistical power analysis for the behavioral sciences. Elsevier. https://doi.org/https://doi.org/10.1016/C2013-0-10517-X
- Coulson, S., & Van Petten, C. (2007). A special role for the right hemisphere in metaphor comprehension? ERP evidence from hemifield presentation. Brain Research, 1146, 128–145. https://doi.org/https://doi.org/10.1016/j.brainres.2007.03.008
- Cross, N. (1989). Engineering design methods. Wiley.
- Cross, N. (2001). Design cognition: Results from protocol and other empirical studies of design activity. In: Eastman C, McCracken M, Newstetter W (eds). Design knowing and learning: Cognition in design education (pp. 79–103). Elsevier.
- Cui, X., Bray, S., Bryant, D. M., Glover, G. H., & Reiss, A. L. (2011). A quantitative comparison of NIRS and fMRI across multiple cognitive tasks. NeuroImage, 54(4), 2808–2821. https://doi.org/https://doi.org/10.1016/j.neuroimage.2010.10.069
- Dietrich, A. (2004). The cognitive neuroscience of creativity. Psychonomic Bulletin & Review, 11(6), 1011–1026. https://doi.org/https://doi.org/10.3758/BF03196731
- Dietrich, A. (2019). Where in the brain is creativity: A brief account of a wild-goose chase. Current Opinion in Behavioral Sciences, 27, 36–39. https://doi.org/https://doi.org/10.1016/j.cobeha.2018.09.001
- Ditta, A. S., & Storm, B. C. (2017). That’s a good idea, but let’s keep thinking! Can we prevent our initial ideas from being forgotten as a consequence of thinking of new ideas? Psychological Research, 81(3), 678–689. https://doi.org/https://doi.org/10.1007/s00426-016-0773-2
- Egner, T., & Gruzelier, J. H. (2003). Ecological validity of neurofeedback: Modulation of slow wave EEG enhances musical performance. NeuroReport, 14(9), 1221. https://journals.lww.com/neuroreport/Fulltext/2003/07010/Ecological_validity_of_neurofeedback___modulation.6.aspx
- Elfgren, C. I., & Risberg, J. (1998). Lateralized frontal blood flow increases during fluency tasks: Influence of cognitive strategy. Neuropsychologia, 36(6), 505–512. https://doi.org/https://doi.org/10.1016/S0028-3932(97)00146-2
- Euston, D. R., Gruber, A. J., & McNaughton, B. L. (2012). The role of medial prefrontal cortex in memory and decision making. Neuron, 76(6), 1057–1070. https://doi.org/https://doi.org/10.1016/j.neuron.2012.12.002
- Faller, J., Cummings, J., Saproo, S., & Sajda, P. (2019). Regulation of arousal via online neurofeedback improves human performance in a demanding sensory-motor task. Proceedings of the National Academy of Sciences, 116(13), 6482–6490. https://doi.org/https://doi.org/10.1073/pnas.1817207116
- Ferrari, M., & Quaresima, V. (2012). A brief review on the history of human functional near-infrared spectroscopy (fNIRS) development and fields of application. NeuroImage, 63(2), 921–935. https://doi.org/https://doi.org/10.1016/j.neuroimage.2012.03.049
- Fillion, E. A. (2015). The impact of global and local processing on creative performance: (Failing to) improve idea selection in brainstorming. Ohio University. https://etd.ohiolink.edu/pg_10?0::NO:10:P10_ACCESSION_NUM:ohiou1438354620
- Fishburn, F. A., Norr, M. E., Medvedev, A. V., & Vaidya, C. J. (2014). Sensitivity of fNIRS to cognitive state and load. Frontiers in Human Neuroscience, 8,76. https://doi.org/https://doi.org/10.3389/fnhum.2014.00076
- Förster, J. (2012). GLOMOsys: The how and why of global and local processing. Current Directions in Psychological Science, 21(1), 15–19. https://doi.org/https://doi.org/10.1177/0963721411429454
- French, J. M. (1999). Conceptual design for engineers (3rd ed.). www.springer.com/us/book/9783662113646
- Friedman, R. S., Fishbach, A., Förster, J., & Werth, L. (2003). Attentional priming effects on creativity. Creativity Research Journal, 15(2–3), 277–286. https://doi.org/https://doi.org/10.1207/S15326934CRJ152&3_18
- Funahashi, S. (2017). Working memory in the prefrontal cortex. Brain Sciences, 7(5), 49. https://doi.org/https://doi.org/10.3390/brainsci7050049
- Fuster, J. M. (1988). Prefrontal Cortex. In Adelman G., (Eds.), Comparative neuroscience and neurobiology (pp. 107–109). Birkhäuser. https://doi.org/https://doi.org/10.1007/978-1-4899-6776-3_43
- Gabora, L. (2002). Cognitive mechanisms underlying the creative process. Proceedings of the 4th Conference on Creativity & Cognition, ACM, 126–133. https://doi.org/https://doi.org/10.1145/581710.581730
- Gabora, L. (2010). Revenge of the “Neurds”: Characterizing creative thought in terms of the structure and dynamics of memory. Creativity Research Journal, 22(1), 1–13. https://doi.org/https://doi.org/10.1080/10400410903579494
- Garcin, B., Volle, E., Dubois, B., & Levy, R. (2012). Similar or different? The role of the ventrolateral prefrontal cortex in similarity detection. PLOS ONE, 7(3), e34164. https://doi.org/https://doi.org/10.1371/journal.pone.0034164
- George, T., Wiley, J., Koppel, R. H., & Storm, B. C. (2019). Constraining or constructive? The effects of examples on idea novelty. The Journal of Creative Behavior, 53(3), 396–403. https://doi.org/https://doi.org/10.1002/jocb.178
- Gero, J. S. (2011). Fixation and commitment while designing and its measurement. The Journal of Creative Behavior, 45(2), 108–115. https://doi.org/https://doi.org/10.1002/j.2162-6057.2011.tb01090.x
- Gero, J. S., Jiang, H., & Williams, C. B. (2013). Design cognition differences when using unstructured, partially structured, and structured concept generation creativity techniques. International Journal of Design Creativity and Innovation, 1(4), 196–214. https://doi.org/https://doi.org/10.1080/21650349.2013.801760
- Gilbert, S. J., Zamenopoulos, T., Alexiou, K., & Johnson, J. H. (2010). Involvement of right dorsolateral prefrontal cortex in ill-structured design cognition: An fMRI study. Brain Research, 1312, 79–88. https://doi.org/https://doi.org/10.1016/j.brainres.2009.11.045
- Goel, V., & Vartanian, O. (2005). Dissociating the roles of right ventral lateral and dorsal lateral prefrontal cortex in generation and maintenance of hypotheses in set-shift problems. Cerebral Cortex, 15(8), 1170–1177. https://doi.org/https://doi.org/10.1093/cercor/bhh217
- Hammond, D. C. (2011). What is Neurofeedback: An Update. Journal of Neurotherapy, 15(4), 305–336. https://doi.org/https://doi.org/10.1080/10874208.2011.623090
- Hay, L., Duffy, A. H. B., Gilbert, S. J., Lyall, L., Campbell, G., Coyle, D., & Grealy, M. A. (2019). The neural correlates of ideation in product design engineering practitioners. Design Science, 5,E29. https://doi.org/https://doi.org/10.1017/dsj.2019.27
- Helm, K., Jablokow, K., McKilligan, S., Daly, S., & Silk, E. (2016, June 1). Evaluating the impacts of different interventions on quality in concept generation. 2016 ASEE Annual Conference & Exposition, ASEE.
- Helquist, J. H., Santanen, E. L., & Kruse, J. (2007). Participant-driven GSS: Quality of brainstorming and allocation of participant resources. 2007 40th Annual Hawaii International Conference on System Sciences (HICSS’07), IEEE, 18. https://doi.org/https://doi.org/10.1109/HICSS.2007.425
- Hernandez, N. V., Shah, J. J., & Smith, S. M. (2010). Understanding design ideation mechanisms through multilevel aligned empirical studies. Design Studies, 31(4), 382–410. https://doi.org/https://doi.org/10.1016/j.destud.2010.04.001
- Hocevar, D. (1979). Ideational fluency as a confounding factor in the measurement of originality. Journal of Educational Psychology, 71(2), 191–196. https://doi.org/https://doi.org/10.1037/0022-0663.71.2.191
- Howard, T. J., Culley, S. J., & Dekoninck, E. (2008). Describing the creative design process by the integration of engineering design and cognitive psychology literature. Design Studies, 29(2), 160–180. https://doi.org/https://doi.org/10.1016/j.destud.2008.01.001
- Hu, M., & Shealy, T. (2019). Application of functional near-infrared spectroscopy to measure engineering decision-making and design cognition: Literature review and synthesis of methods. Journal of Computing in Civil Engineering, 33(6), 04019034. https://doi.org/https://doi.org/10.1061/(ASCE)CP.1943-5487.0000848
- Hu, M., Shealy, T., Grohs, J., & Panneton, R. (2019). Empirical evidence that concept mapping reduces neurocognitive effort during concept generation for sustainability. Journal of Cleaner Production, 238, 117815. https://doi.org/https://doi.org/10.1016/j.jclepro.2019.117815
- Isaksen, S. G., & Gaulin, J. P. (2005). A reexamination of brainstorming research: Implications for research and practice. Gifted Child Quarterly, 49(4), 315–329. https://doi.org/https://doi.org/10.1177/001698620504900405
- Jones-Gotman, M., & Milner, B. (1977). Design fluency: The invention of nonsense drawings after focal cortical lesions. Neuropsychologia, 15(4), 653–674. https://doi.org/https://doi.org/10.1016/0028-3932(77)90070-7
- Kaiser, D. A., & Othmer, S. (2000). Effect of neurofeedback on variables of attention in a large multi-center trial. Journal of Neurotherapy, 4(1), 5–15. https://doi.org/https://doi.org/10.1300/J184v04n01_02
- Kan, J. W., & Gero, J. S. (2017). Quantitative methods for studying design protocols. Springer. https://doi.org/https://doi.org/10.1007/978-94-024-0984-0
- Klein, F., & Kranczioch, C. (2019). Signal processing in fNIRS: A Case for the removal of systemic activity for single trial data. Frontiers in Human Neuroscience, 13, 331. https://doi.org/https://doi.org/10.3389/fnhum.2019.00331
- Kober, S. E., Hinterleitner, V., Bauernfeind, G., Neuper, C., & Wood, G. (2018). Trainability of hemodynamic parameters: A near-infrared spectroscopy based neurofeedback study. Biological Psychology, 136, 168–180. https://doi.org/https://doi.org/10.1016/j.biopsycho.2018.05.009
- Kohl, S. H., Mehler, D. M. A., Lührs, M., Thibault, R. T., Konrad, K., & Sorger, B. (2020). The potential of functional near-infrared spectroscopy-based neurofeedback—a systematic review and recommendations for best practice. Frontiers in Neuroscience, 14, 594. https://doi.org/https://doi.org/10.3389/fnins.2020.00594
- Kovacevic, N., Ritter, P., Tays, W., Moreno, S., & McIntosh, A. R. (2015). ‘My virtual dream’: Collective neurofeedback in an immersive art environment. PLOS ONE, 10(7), e0130129. https://doi.org/https://doi.org/10.1371/journal.pone.0130129
- Kowatari, Y., Lee, S. H., Yamamura, H., Nagamori, Y., Levy, P., Yamane, S., & Yamamoto, M. (2009). Neural networks involved in artistic creativity. Human Brain Mapping, 30(5), 1678–1690. https://doi.org/https://doi.org/10.1002/hbm.20633
- Kudrowitz, B. M., & Wallace, D. (2013). Assessing the quality of ideas from prolific, early-stage product ideation. Journal of Engineering Design, 24(2), 120–139. https://doi.org/https://doi.org/10.1080/09544828.2012.676633
- Lapborisuth, P., Zhang, X., Noah, A., & Hirsch, J. (2017). Neurofeedback-based functional near-infrared spectroscopy upregulates motor cortex activity in imagined motor tasks. Neurophotonics, 4(2), 021107. https://doi.org/https://doi.org/10.1117/1.NPh.4.2.021107
- Li, C., Su, M., Xu, J., Jin, H., & Sun, L. (2020). A between-subject fNIRS-BCI study on detecting self-regulated intention during walking. IEEE Transactions on Neural Systems and Rehabilitation Engineering, 28(2), 531–540. https://doi.org/https://doi.org/10.1109/TNSRE.2020.2965628
- Luft, C. D. B., Zioga, I., Banissy, M. J., & Bhattacharya, J. (2017). Relaxing learned constraints through cathodal tDCS on the left dorsolateral prefrontal cortex. Scientific Reports, 7(1), 2916. https://doi.org/https://doi.org/10.1038/s41598-017-03022-2
- Lührs, M., & Goebel, R. (2017). Turbo-Satori: A neurofeedback and brain–computer interface toolbox for real-time functional near-infrared spectroscopy. Neurophotonics, 4(4), 041504. https://doi.org/https://doi.org/10.1117/1.NPh.4.4.041504
- Marzbani, H., Marateb, H. R., & Mansourian, M. (2016). Neurofeedback: A comprehensive review on system design, methodology and clinical applications. Basic and Clinical Neuroscience, 7(2), 143–158. https://doi.org/https://doi.org/10.15412/J.BCN.03070208
- Mashal, N., Faust, M., & Hendler, T. (2005). The role of the right hemisphere in processing nonsalient metaphorical meanings: application of principal components analysis to fMRI data. Neuropsychologia, 43(14), 2084–2100. https://doi.org/https://doi.org/10.1016/j.neuropsychologia.2005.03.019
- Meyer, M. L., Hershfield, H. E., Waytz, A. G., Mildner, J. N., & Tamir, D. I. (2019). Creative expertise is associated with transcending the here and now. Journal of Personality and Social Psychology, 116(4), 483–494. https://doi.org/https://doi.org/10.1037/pspa0000148
- Mihov, K. M., Denzler, M., & Förster, J. (2010). Hemispheric specialization and creative thinking: A meta-analytic review of lateralization of creativity. Brain and Cognition, 72(3), 442–448. https://doi.org/https://doi.org/10.1016/j.bandc.2009.12.007
- Milovanovic, J., Hu, M., Shealy, T., & Gero, J. (2020, November 3). Evolution of brain network connectivity in the prefrontal cortex during concept generation using brainstorming for a design task. ASME 2020 International Design Engineering Technical Conferences and Computers and Information in Engineering Conference, ASME. https://doi.org/https://doi.org/10.1115/DETC2020-22563
- Murphy, G., & Greene, C. M. (2016). Perceptual load affects eyewitness accuracy and susceptibility to leading questions. Frontiers in Psychology, 7, 1322. https://doi.org/https://doi.org/10.3389/fpsyg.2016.01322
- Nguyen, T. A., & Zeng, Y. (2014). A physiological study of relationship between designer’s mental effort and mental stress during conceptual design. Computer-Aided Design, 54(C), 3–18. https://doi.org/https://doi.org/10.1016/j.cad.2013.10.002
- Osborn, A. F., & Alex, F. (1953). Applied imagination; principles and procedures of creative thinking. Scribner. http://archive.org/details/appliedimaginati00osborich
- Paulus, P. B., Kohn, N. W., & Arditti, L. E. (2011). Effects of quantity and quality instructions on brainstorming. The Journal of Creative Behavior, 45(1), 38–46. https://doi.org/https://doi.org/10.1002/j.2162-6057.2011.tb01083.x
- Pidgeon, L. M., Grealy, M., Duffy, A. H. B., Hay, L., McTeague, C., Vuletic, T., Coyle, D., & Gilbert, S. J. (2016). Functional neuroimaging of visual creativity: A systematic review and meta-analysis. Brain and Behavior, 6(10), e00540. https://doi.org/https://doi.org/10.1002/brb3.540
- Pinsonneault, A., Barki, H., Gallupe, R. B., & Hoppen, N. (1999). Electronic brainstorming: the illusion of productivity. Information Systems Research, 10(2), 110–133. https://www.jstor.org/stable/23011448
- Pinti, P., Aichelburg, C., Gilbert, S., Hamilton, A., Hirsch, J., Burgess, P., & Tachtsidis, I. (2018). A review on the use of wearable functional near-infrared spectroscopy in naturalistic environments. Japanese Psychological Research, 60(4), 347–373. https://doi.org/https://doi.org/10.1111/jpr.12206
- Potter, P., & Balthazard, B. (2004). The role of individual memory and attention processes during electronic brainstorming. MIS Quarterly, 28(4), 621. https://aisel.aisnet.org/misq/vol28/iss4/5
- Seitz, R. J., Nickel, J., & Azari, N. P. (2006). Functional modularity of the medial prefrontal cortex: Involvement in human empathy. Neuropsychology, 20(6), 743–751. https://doi.org/https://doi.org/10.1037/0894-4105.20.6.743
- Shah, J. J., Smith, S. M., & Vargas-Hernandez, N. (2003). Metrics for measuring ideation effectiveness. Design Studies, 24(2), 111–134. https://doi.org/https://doi.org/10.1016/S0142-694X(02)00034-0
- Shealy, T., & Gero, J. (2019). The neurocognition of three engineering concept generation techniques. Proceedings of the Design Society: International Conference on Engineering Design, 1(1), 1833–1842. https://doi.org/https://doi.org/10.1017/dsi.2019.189
- Shealy, T., Gero, J., Hu, M., & Milovanovic, J. (2020). Concept generation techniques change patterns of brain activation during engineering design. Design Science, 6, E31. https://doi.org/https://doi.org/10.1017/dsj.2020.30
- Shealy, T., Grohs, J. R., Hu, M., Maczka, D. K., & Panneton, R. (2017). Investigating design cognition during brainstorming tasks with freshmen and senior engineering students using functional near infrared spectroscopy. ASEE Annual Conference and Exposition, Conference Proceedings, ASEE.
- Shealy, T., & Hu, M. (2017, June 5). Evaluating the potential of neuroimaging methods to study engineering cognition and project-level decision making. EPOC-MW Conference, Engineering Project Organization Society
- Shealy, T., Hu, M., & John, G. (2018). Neuro-cognitive differences between brainstorming, morphological analysis, and TRIZ. ASME 2018 International Design Engineering Technical Conferences & Computers and Information in Engineering Conference, ASME.
- Shimadzu Corporation. (2016). An example of neurofeedback-related measurements.
- Shin, J., Kwon, J., & Im, C.-H. (2018). A ternary hybrid EEG-NIRS brain-computer interface for the classification of brain activation patterns during mental arithmetic, motor imagery, and Idle State. Frontiers in Neuroinformatics, 12, 5. https://doi.org/https://doi.org/10.3389/fninf.2018.00005
- Shulman, G. L., Pope, D. L. W., Astafiev, S. V., McAvoy, M. P., Snyder, A. Z., & Corbetta, M. (2010). Right hemisphere dominance during spatial selective attention and target detection occurs outside the dorsal frontoparietal network. The Journal of Neuroscience, 30(10), 3640–3651. https://doi.org/https://doi.org/10.1523/JNEUROSCI.4085-09.2010
- Siegel, S. (1956). Nonparametric statistics for the behavioral sciences (pp. xvii, 312). McGraw-Hill.
- Sitaram, R., Ros, T., Stoeckel, L., Haller, S., Scharnowski, F., Lewis-Peacock, J., Weiskopf, N., Blefari, M. L., Rana, M., Oblak, E., Birbaumer, N., & Sulzer, J. (2017). Closed-loop brain training: The science of neurofeedback. Nature Reviews Neuroscience, 18(2), 86–100. https://doi.org/https://doi.org/10.1038/nrn.2016.164
- Smith, S. M., Ward, T. B., & Finke, R. A. (1995). The creative cognition approach. MIT Press.
- Soltanlou, M., Artemenko, C., Ehlis, A.-C., Huber, S., Fallgatter, A. J., Dresler, T., & Nuerk, H.-C. (2018). Reduction but no shift in brain activation after arithmetic learning in children: A simultaneous fNIRS-EEG study. Scientific Reports, 8, 1707. https://doi.org/https://doi.org/10.1038/s41598-018-20007-x
- Storm, B. C., & Hickman, M. L. (2015). Mental fixation and metacognitive predictions of insight in creative problem solving. Quarterly Journal of Experimental Psychology, 68(4), 802–813. https://doi.org/https://doi.org/10.1080/17470218.2014.966730
- Tilahun, N., Thakuriah, P., Li, M., & Keita, Y. (2016). Transit use and the work commute: Analyzing the role of last mile issues. Journal of Transport Geography, 54, 359–368. https://doi.org/https://doi.org/10.1016/j.jtrangeo.2016.06.021
- Vernon, D., Egner, T., Cooper, N., Compton, T., Neilands, C., Sheri, A., & Gruzelier, J. (2003). The effect of training distinct neurofeedback protocols on aspects of cognitive performance. International Journal of Psychophysiology, 47(1), 75–85. https://doi.org/https://doi.org/10.1016/S0167-8760(02)00091-0
- Viswanathan, V. K. (2017). Design fixation to examples: A study on the time decay of fixation. DS 87-8 Proceedings of the 21st International Conference on Engineering Design (ICED 17) Vol 8: Human Behaviour in Design, ICED, 21-25.08.2017. https://www.designsociety.org/publication/39836/Design+fixation+to+examples%3A+A+study+on+the+time+decay+of+fixation
- Wei, T.-Y., Chang, D.-W., Liu, Y.-D., Liu, C.-W., Young, C.-P., Liang, S.-F., & Shaw, F.-Z. (2017). Portable wireless neurofeedback system of EEG alpha rhythm enhances memory. Biomedical Engineering Online, 16(1), 128. https://doi.org/https://doi.org/10.1186/s12938-017-0418-8
- Wu, X., Yang, W., Tong, D., Sun, J., Chen, Q., Wei, D., Zhang, Q., Zhang, M., & Qiu, J. (2015). A meta-analysis of neuroimaging studies on divergent thinking using activation likelihood estimation. Human Brain Mapping, 36(7), 2703–2718. https://doi.org/https://doi.org/10.1002/hbm.22801
- Zhang, X., Noah, A., Yahil, S., Ono, Y., & Hirsch, J. (2014). Neural mechanism for neural feedback based on EEG using functional near-infrared spectroscopy (fNIRS). Society or Neuroscience.
- Zhang, Y., & Zhu, C. (2020). Assessing Brain networks by resting-state dynamic functional connectivity: An fNIRS-EEG study. Frontiers in Neuroscience, 13, 1430. https://doi.org/https://doi.org/10.3389/fnins.2019.01430
Appendix: First/last mile problem
Land-use patterns over the last century have pushed more jobs and people into lower-density suburbs, which are often not within walking distance to existing mass transit. As a consequence, mass transit in these areas is less practical because of the distance to homes, which creates the first/last mile mobility challenge. This distance promotes a reliance on cars resulting in more traffic congestion, pollution, and urban sprawl.
The first/last mile problem in transportation engineering is relevant in major cities and towns across the country. Departments of Transportation in Colorado and Utah and regional divisions of the Federal Highway Administration in Washington State, Arizona, and Florida are currently soliciting requests for proposals (RFPs) for solutions to the first/last mile problem.
In the experiment, assuming you were working with a design firm to solve the ‘first/last mile problem’ in the village of Oak Brook, IL, you need to use the brainstorming technique to generate as many solutions as possible to the ‘first/last mile problem’ in Oak Brook, which requests for proposals (RFPs) for solutions. Oak Brook is near Chicago, IL and is one of the region’s largest employment centers with 2,000 employers and employment of 60,000 people within its 5.3 square miles. It also includes one of the region’s largest retail centers. Your solutions should help connect the Village of Oak Brook and the Metra Commuter Rail service in order to reduce auto dependence of commuters working within Oak Brook.
There is no time limit in the experiment. Please verbally speak out your solutions. When there is crosshair in the screen, please look at the crosshair and keep your mind at rest state
(For the neurocognitive group):
When brainstorming, the heat map in the screen is the feedback from fNIRS which shows your brain activities in the prefrontal cortex. The color red means high activation and blue means low activation. Try to activate your brain to ‘red’ to generate more solutions!