Abstract
The flexural performance of steel fiber-reinforced concrete made with recycled concrete aggregates (RCA) and desert dune sand was investigated. Natural aggregates were replaced by 30, 70, and 100% RCA. Steel fibers were incorporated into mixes in 1, 2, and 3% volume fractions. To evaluate the flexural behavior of plain and steel fiber-reinforced RCA concrete mixes, three- and four-point bending tests were conducted. Experimental results showed that RCA replacement had a predominant impact on compression behavior compared to steel fiber addition, while the latter was more influential on flexural performance. Higher pre-peak slope, flexural strength, deflection, toughness, and equivalent flexural ratio were noted when steel fibers were added to RCA-based concrete tested under four-point bending. Similar improvement in flexural performance was reported from load-crack mouth opening displacement curves of three-point bending tests. Accordingly, analytical regression models were developed to correlate the different properties obtained from these two flexural bending test results.
Acknowledgements
The authors are thankful to Al Dhafra Recycling Industries for providing the recycled concrete aggregates. The contributions of the UAEU engineers and staff are also greatly appreciated.
Declaration of statement
No potential conflict of interest was reported by the authors.
Figure 5. Failure modes of concrete under four-point bending (a) R0SF0, (b) R100SF0, (c) R100SF1, (d) R100SF2, (e) R100SF3.
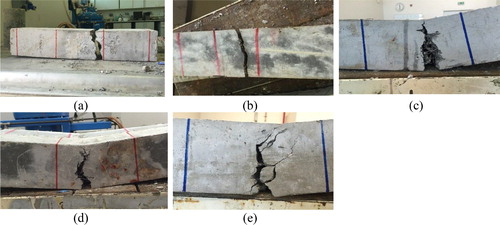
Figure 6. Effect of RCA replacement percentage on the flexural strength (a) f1 and (b) fp.
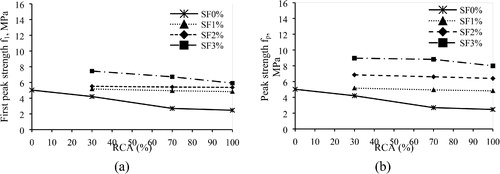
Figure 7. Relationship of concrete compressive strength with (a) f1 and (b) fp.
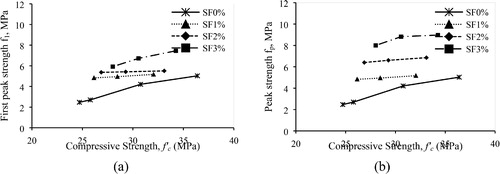
Figure 8. Predicted versus experimental values of flexural strength.
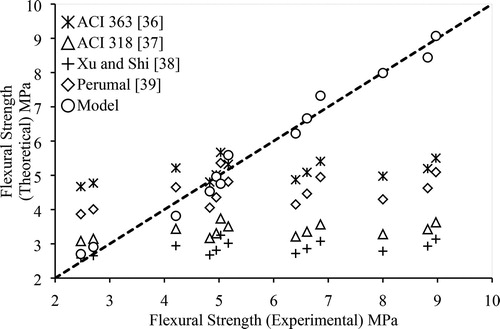
Figure 9. Deflection at peak long of concrete mixes with different: (a) RCA replacement percentage and SF content and (b) compressive strength.
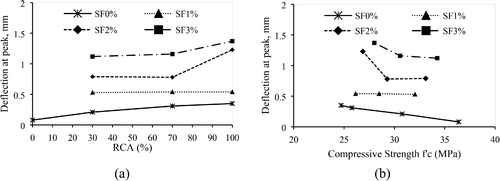
Figure 10. Residual flexural strength of concrete mixes with different: (a) RCA replacement percentage and SF content and (b) compressive strength.
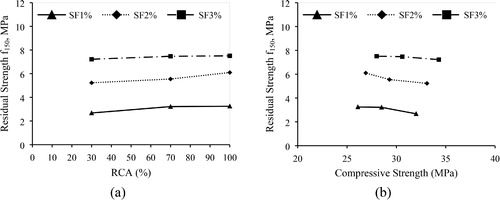
Figure 11. Flexural toughness of concrete mixes with different: (a) RCA replacement percentage and SF content and (b) compressive strength.
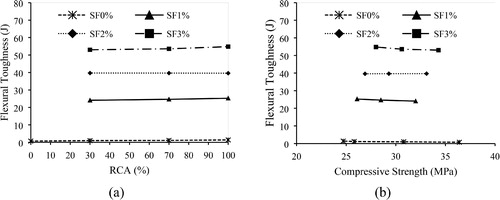
Figure 12. Flexural strength ratio of concrete mixes with different: (a) RCA replacement percentage and SF content and (b) compressive strength.
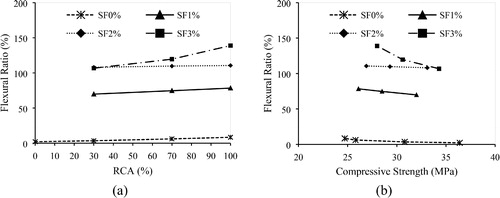
Figure 13. Evaluation of equivalent flexural tensile strength parameters: (a) feq,2; (b) feq,3.
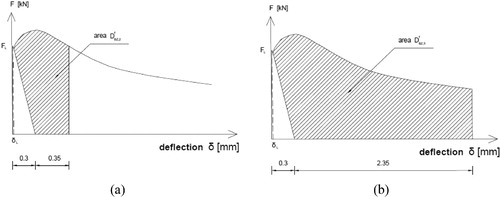
Figure 14. Load-CMOD curves of RCA mixes with: (a) SF 0%; (b) SF 1%; (c) SF 2%; (d) 3%.
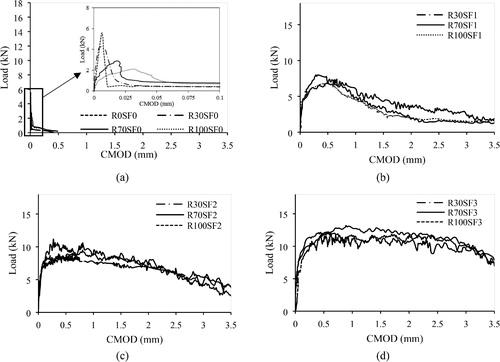
Figure 15. Load-CMOD curves of SF concrete mixes with RCA replacement percentage of: (a) 30%; (b) 70%; (c) 100%.
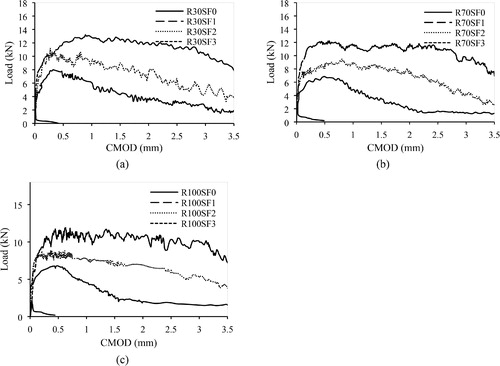
Figure 16. Failure modes of concrete under three-point bending (a) R0SF0, (b) R100SF0, (c) R100SF1, (d) R100SF2, (e) R100SF3.
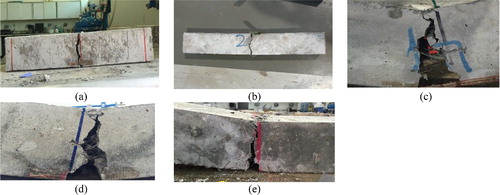
Figure 17. Relationship between feq and fR.
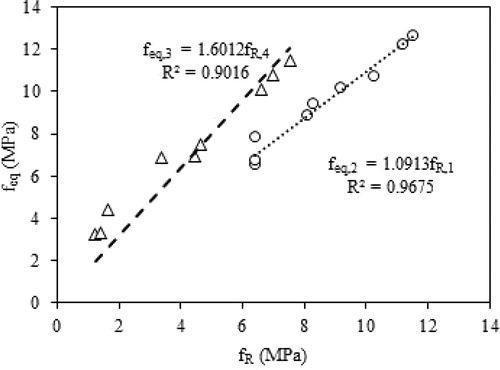
Figure 18. Relationship between f1 and fL.
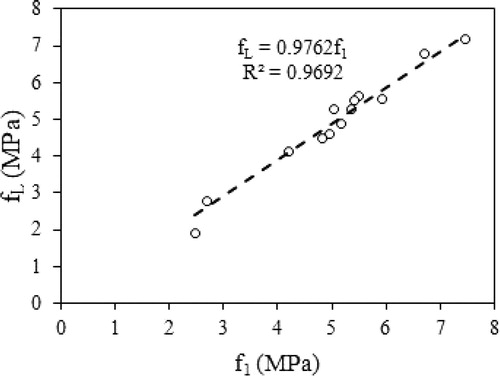
Figure 19. Relationship between three- and four-point residual flexural strength.
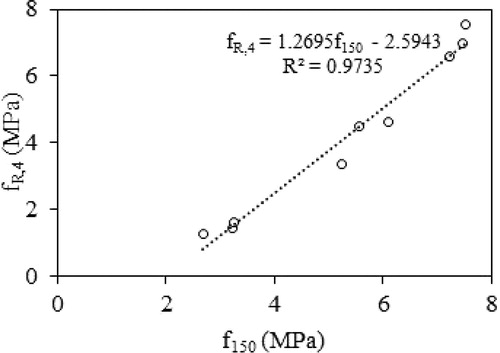
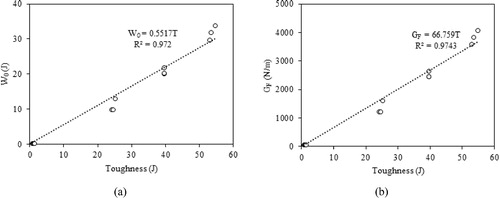
Figure 20. Flexural toughness versus (a) W0 and (b) GF.