
 ?Mathematical formulae have been encoded as MathML and are displayed in this HTML version using MathJax in order to improve their display. Uncheck the box to turn MathJax off. This feature requires Javascript. Click on a formula to zoom.
ABSTRACT
Culturing bacteria and monitoring bacterial cell growth is a critical issue when dealing with patients who present with bacterial infections. One of the main challenges that arises is the time taken to identify the particular strain of bacteria and consequently, decide the correct treatment. In the majority of cases, broad spectrum antibiotics are used to target infections when a narrow spectrum drug would be more appropriate. The efficient monitoring of bacterial growth and potential antibiotic resistance is necessary to identify the best treatment options for patients. Minturising the reactions into microfluidic droplets offers a novel method to rapidy analyze bacteria. Microfluidics facilitates low volume reactions that provide a unique system where each droplet reaction acts as an individual bioreactor. Here, we designed and built a novel platform that allowed us to create and monitor E.coli microfluidic droplet cultures. Optical capacity was built in and measurements of bacterial cultures were captured facilitating the continuous monitoring of individual reactions. The capacity of the instrument was demonstrated by the application of treatments to both bacteria and drug resistant strains of bacteria. We were able to detect responses within one hour in the droplet cultures, demonstrating the capacity of this workflow to the culture and rapid characterization of bacterial strains.
Introduction
Bacterial infections have become one of the biggest health issues worldwide. Two million people are infected with antimicrobial resistant bacteria each year in the US, with 23,000 deaths as a direct result of these infections.Citation1 Longer hospital stays and higher mortality rates are consequences of antibiotic resistant strains of bacteria.Citation2 Mortality rates associated with antibiotic resistant infections are almost three times higher than non-resistant infections, 21% vs 8% Citation3 due to the lack of rapid diagnosis of these resistant bacteria.
The use of broad spectrumCitation2 antibiotics coupled with the inappropriate use and prescription of antibiotics, in turn causes increased antibiotic resistant bacterial strains.Citation2,4 Treatment of patients with more specific narrow spectrum antibiotics is considered the most effective approach to prevent further resistance to antibiotics. Narrow spectrum drugs target the specific bacteriaCitation4,5 consequently, the challenge with prescribing narrow spectrum drugs is the ability to identify the exact strain of bacteria affecting the patient and finding a tailored treatment plan. The focus of this paper is to develop a new method that facilitates miniaturized bacterial culture while having the capacity to monitor bacterial growth and drug response that may lead to the specific treatment of a bacterial strain.
Methods for bacterial growth and monitoring are predominantly user dependent and require multiple interactions including pipetting and fluid handling.Citation6,7 Current methods employ agar plates and broth dilution tests with a large dependence on E.TestsCitation6 to determine the concentration of antibiotic required for treatment. The user time incorporated with these methods is high as each culture has to be inspected manually.Citation6 One of the benefits of rapid identification of treatment is that it will attribute to fewer tests on a patient and shorten the length of hospital stay.Citation6 Shortening the time necessary to detect and identify an effective antibiotic regime to treat bacterial infections will decrease the mortality rate and reduce the cost of treating patients with aggressive bacterial infections.
Microfluidics offers a solution with its ability to miniaturize bacterial cultures to nano liter levels. Microfluidics is best described as the manipulation of fluids in channels of under 1mm. The benefits of microfluidics is the generation of low volume reactions and high throughput tests, allowing for multiplexing that gives the opportunity to test many antibiotics against any bacterial sample. Microfluidic droplets have been established as chemical bioreactorsCitation8 and have been proven in miniaturizing many biological processes such as PCR,Citation9 protein crystallizationCitation10 and bio-sensing.Citation11 Bacterial analysis using microfluidic systems have been established however, the requirement of tools such as a high powered microscopeCitation7 and fluorescence Citation7,8,12,13 make these systems less viable alternatives. There are also limitations, such as the requirement to manually add the antibiotics by pipetting to a microfluidic chip on many platforms, and many do not facilitate on-chip incubationCitation8 of the cultures. This has prevented these methods from being progressive and disruptive.
This paper introduces a platform and method that facilitates the generation and use of microfluidic droplets for bacterial analysis where each droplet will act as an individual bioreactor that can be assessed at any time point using non-invasive approaches eliminating the need for offline assays and instrumentation. The platform developed here uses microfluidic droplets and continuous detection methods with a non-invasive approach. While other microfluidic bacterial methods rely on fluorescence and end point methods, the method proposed does not need the assistance of any other material other than the lysogene broth (LB) culture media for detection of bacterial growth. This instrument allows multiple drugs to be tested against the specific bacteria in order to determine bacterial resistance to a particular treatment. The determination of antibiotic resistance and effectiveness of treatment is monitored on the system. This platform offers advantages over current culture methods in reduced volume and on platform detection so that sample is not lost to other methods of detection such as micro-plate reader. The detection methods used here provide a reading within one hour of culture and continuous monitoring of cultures is available at any time during testing. The ability to add any antibiotics to any culture provides the potential to multiplex thousands of assays and drug combinations and the potential to identify antibiotic resistance. In a clinical setting, this has the potential to ensure that a clinician will not waste time in the diagnosis and arrive more quickly to the administration of more specific narrow spectrum antibiotics.
Experimental design
Bacterial culture
Escherichia coli (E.coli) were cultured from cell line BL21(#L1191, Promega) competent cell line initially a colony was taken from an agar plate and placed in 10ml or lysogene broth (LB). Lysogene broth contains the nutrients for cell growth 5g NaCl, 5g Tryptone and 2.5g Yeast Extract (Sigma Aldrich) with 500ml of deionized H2O. The LB was autoclaved at 121°C for 20 min to maintain sterility. All E.coli steps were performed beside a gas flame to insure sterility. The E.coli mixture was placed in an orbital shaker incubator at 200rmp for 16 h. Once the initial culture was established a new mixture of 1:10 was made from the E.coli culture to LB. The optical density of the sample is read each time using a microplate reader and this is used as the seeding density for all tests. This mixture was used as the source for droplets.
Instrument design
An instrument was designed and used to generate the microfluidic droplets. Droplets were generated, incubated and monitored on this system. demonstrates a schematic of the system. The bacterial sample was placed at the inlet of the tubing (PTFE, 812ID, Zeus Inc.) a flow through this tubing was generated using a syringe pump (Harvard Apparatus PHD 2000). The pump flows under negative pressure and generated a defined flow rate of 15-60ul/min. The microfluidic droplets were generated by aspiration of the fluid and the movement of robotic stage (Festo) into the sample and then back out to the oil. The robotic stage movements are controlled by FCT software where the depth and time of movement are defined. Once the droplets are generated they move through the tubing past a microscope (Olympus CKx3) and camera (Image source) for visual monitoring of the cultures. The droplets are then moved through the drop-off junction for mixing with antibiotics. Once mixed the droplets were incubated on the system using an aluminum plate that the tubing was embedded in. The plate was heated using a silicon heater mat (Radionics) that was controlled by a PID control and maintained a temperature of 37°C for the duration of incubation. Silicon oil (PD5, Momentive) was used as the carrier fluid and this encapsulates the droplet completely in a thin film. The tubing and carrier oil are hydrophobic which prevents the aqueous biological phase sample from attaching to the walls of the tubing hence eliminating contamination.
Figure 1A. A schematic of the designed microfluidic instrument. Flow through the tubing is generated using the syringe pump. The robotic stage moves into the bacteria sample to develop droplets. To measure the optical density a photodiode was embedded into a the incubation plate.
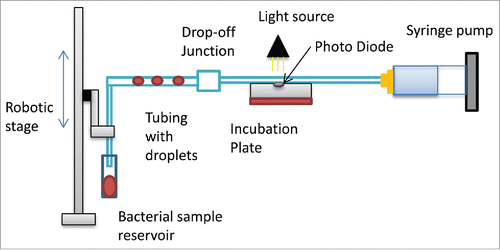
Figure 1B. Images of drop-off junction mixing system where the small droplet is a drug droplet and the large pink droplet is a bacteria culture droplet. Droplets move from a smaller diameter tube into a larger diameter tube. Within the larger tube the droplets are smaller than the diameter of the tubing they move together and coalesce to form a fully mixed droplet and then moves back to 812um tubing for incubation.
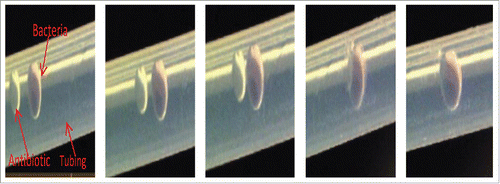
To mix the cultures on the platform with various drugs a drop off junction was created.Citation14 Images of the drop-off junction mixing configuration , in which the larger droplets of bacterial culture are mixed with small drug droplets. Initially the droplets are created in tubing of size 812um when mixing occurs the droplets are pumped to larger tubing of 1200um in diameter. Once the droplets reach the larger tubing they velocity changes as the droplets do not reach the diameter of the tubing. The droplets then act as spherical droplets and move by convection through the tubing. As the larger droplet moves slower than the smaller droplet the droplets meet in this junction and mix. Once they have mixed the droplets move as one droplet trough to 812um tubing and on to incubation. Droplet mixing is also aided by inherent recirculation in droplet flowCitation15,16 throughout the system. The inherent circulations form vortex mixing at the cap ends of each droplet this allows for the constant diffusion of nutrients to the bacteria which means the droplets act as constantly mixing bioreactors.
Bacteria detection
Bacterial growth rate is determined by the change in optical density (OD). For initial tests to establish if the droplets can be equivalent to conventional methods, measurements were taken on a SynergyMX microplate reader where light of wavelength 600 nmCitation17 is absorbed by the sample and is referenced against a control (culture medium containing no bacteria). On the instrument that is developed in this paper the OD measurement was embeded into the heater plate to allow for continuous monitoring of the cultures. shows the system that a LED light source at 505nm (Farnell) that illuminates the tubing and photodiode (Thorlabs FGAP71) detection. The 505nm wavelength has been used before as suitable wavelength in measurement of bacterial growth.Citation17,18 The photodiode converts the light it receives into a current and this monitors the light absorbed by the droplets passing the diode during incubation. If the amount of light changes then the current read by the photodiode back to National Instruments LabVIEW will change. The LabVIEW program developed for this system consisted of block diagram where voltage readings were acquired from the photodiode using the Data Acquisition card (DAQ). This interfaces the hardware with the software. The voltage is then graphed at 2 readings per second. This can be recorded in Excel for analysis of the optical density. Using the voltage readings the optical density can be calculated using Beer-Lambert law.Citation19 The transmittance of light is calculated by using equation Equation1(1)
(1)
(1)
(1)
Where I is the light intensity of the sample and Io is the reference blank in this system it was taken as the light intensity of the oil through the tubing. The optical density has a logarithmic relationship with transmittance.(2)
(2)
Using these equations the system gives a method of analyzing the optical density through the droplets. The optical density measurements are used to monitor all cultures on this system. After the initial validation of this method the photodiode system was used for all subsequent readings.
Results and discussion
Our objective in this study was to design and validate a novel platform and method workflow that would allow the culture and monitoring of bacterial culture in microfluidic droplets. Our initial focus was to optomize the formation of the droplet cultures. To do this, we worked through a range of conditions including varying velocities, droplet size and reaction time on the instrument. Once ideal conditions were established for the most efficient growth of E.coli, we validated our instrument by focusing on the instruments ability to treat and identify antibiotic resistance of E.coli. After the growth of microfluidic bacterial culture was established in the droplets, an on-system optical density optics platform was designed and used in all subsequent tests. To test the effectiveness of adding micro dilutions of antibiotic to the cultures a microfluidic mixing mechanism was introduced. The mixing system was then incorporated to facilitate mixing of antibiotics in the microfluidic cultures.
Comparing microfluidic droplet culture with traditional culture methods
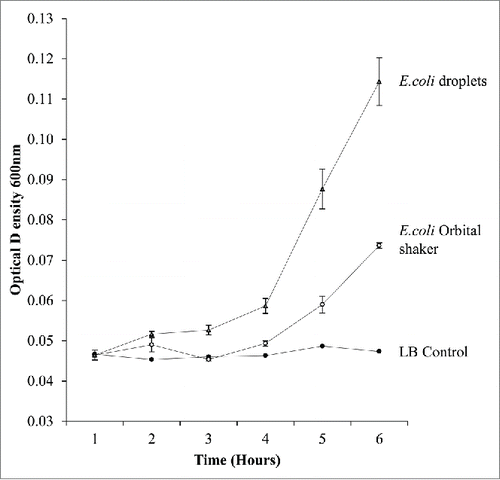
E.coli were cultured as microfluidic droplets of 650nl in a static incubation and compared with a 5ml shaking culture rotated at 180rpm. To quantify the bacteria a sample of 10ul was taken from each culture and mixed with 90ul LB this was placed in a 96 well plate. The absorbance was measured at OD 600nm on the microplate reader. The droplets remained static during incubation. Bacterial droplets optical density was measured by accumulating together the droplets in a plate after incubation and taking a 10ul sample. Three samples were measured for each time point and statistical analysis evaluated using standard error of the mean. demonstrates the growth curve of the cultures over 10 h. This shows that bacterial cell growth is faster in droplet culture than conventional culture, this is in agreement with previously documented systemsCitation8 in microfluidic devices. This verifies the integrity of the droplets as a bioreactor for bacterial growth.
Figure 2. A graph comparing growth rates of traditional E.coli shaker flask culture with E.coli droplet cultures measured on a microplate reader. Droplet cultures show a higher growth rate than orbital shaker cultures.
Optical detection of bacterial growth in droplet culture
As droplets have to be accumulated together to take readings using the microplate reader we designed an on-system photodiode optical density system. To validate this, a sample of E.coli that had a seeding OD of 0.02 was made. The mixture was then incubated in an orbital incubator for 2 hours to initialize the log phase growth. A sample was taken and 10 droplets were made from this suspension. The sample size of 10 droplets allows for accurate calculation and standard error analysis. For all tests standard error of the mean was used as a method of error analysis. The growth curve for bacteria against a control is shown in , both the LB control and E.coli growth observations were measured on the instrument at the same time. Each individual droplet was measured each hour. An example of the readings from the LabVIEW system after 6 h is shown in . Here we measured the difference in voltage readings in control droplets and compared to culture droplets on the system. It is clear that the bacterial droplets have an increased voltage showing growth. This solution eliminates the variation in sample measurements from bulk cultures as in the droplet cultures, we don't sample the culture volume, rather the entire closed culture is monitored in real time. The ability to differentiate between growing cultures allowed us to conclude that this was a valid method of measurement of bacteria culture and performed well against traditional growth systems.
Figure 3. The photodiode system readings of E.coli droplets and LB droplets over 9 h.
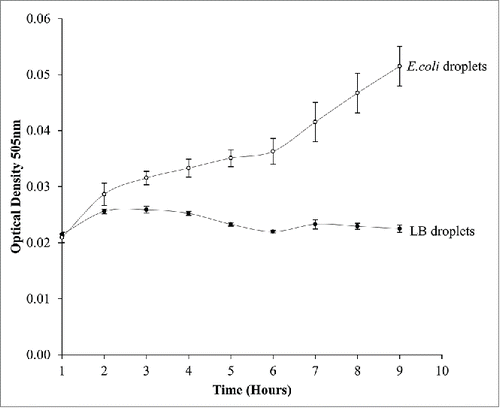
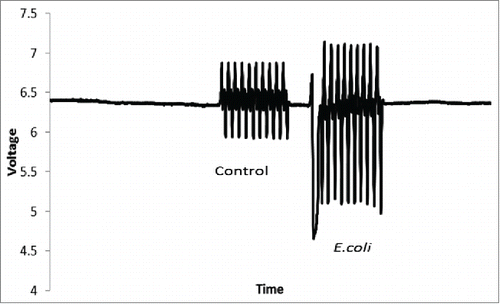
Figure 4. An image of the voltage readings from the photodiode system. Each peak represents a droplet where the first 10 droplets are LB followed by 10 droplets of E.coli readings taken after 6 hours of incubation.
The effects of droplet volume on E.coli culture
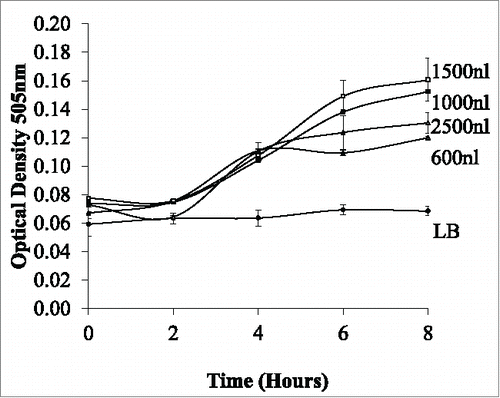
The optimum volume for cell growth was examined across a range of volumes (400–2500 nl). Depending on the volume, droplets vary in length within the tubing. shows the bacterial growth curve in increasing volumes the most conducive volume was found at 1500nl. Although all volumes show growth at 1500nl the growth rate in volumes over 1500nl is sub optimal. As the volume of the droplet increases, the length of the droplet will increase. The length of the droplet was determined by measuring through the tubing using Vernier calipers. Our results show that with increased length, the growth of the E.coli growth decreases. The decreased growth in longer droplets may be due to reduced number of internal circulations within the flow. To have a complete mixing within a droplet, the droplet is required to move along the tubing at an equivalent length of the droplet.Citation16 As the droplets will move along the same tubing length for observation there will be more mixing within the smaller droplets and less in the larger droplets. This may result in less nutrient mixing to the bacteria. As optimum growth is found to be 1500nl this was used as the volume used for the effect of velocity on the cultures and to examine the effect of drug treatment on the cultures.
Figure 5. Monitoring the effect of variation of the droplets volume (600 nl to 2500 nl) on bacterial growth over time. Results indicated that the optimum growth rate is achieved in 1500nl droplet volume
The effects of droplet velocity on E.coli culture
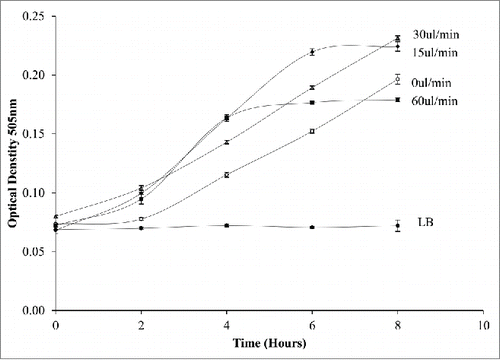
To determine the effect of internal mixing within the droplet, droplets were continuously moved through the tubing at velocities from 0.48mm/s-1.92mm/s to change the rate of diffusion of LB to the bacteria. The culture was seeded at 0.07OD. The E.coli droplet volume flow rates investigated were 15ul/min-60ul/min. As the velocity increases the internal circulations within the droplets increase.Citation15 Each test was processed on an individual basis all flow rates were tested individually. illustrates the effect of flow rate on the cultures. As expected, dynamic conditions give the most productive growth when compared to static culture. However, flow rates above 30ul/min had a negative effect on the growth of the bacteria. This may be a shear effect as it is well known that shear forces have a negative effect on cell growth on the bacteria.Citation20 We conclude from our data that flow rates of 15-30ul/min are the optimal flow rate for E.coli growth within the system.
Figure 6. Monitoring the effect of dynamic conditions on E.coli growth within a droplet at varying flow rates from 0-60ul/min. Increasing the flow rate increases the growth rate up to 30ul/min.
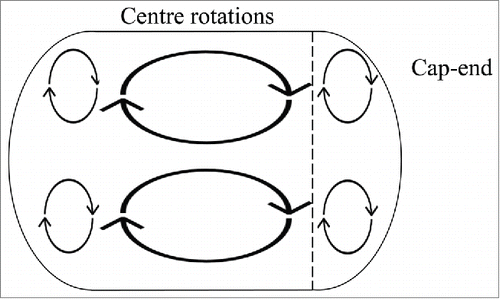
To examine more closely the flow conditions within the droplets, an investigation into the internal circulations within the flow was conducted. The internal circulation within the droplet can be subdivided into two region these include cap ends of the droplet and the center of the dropletCitation21 (). When we imaged our culture droplets () we observe an a distribution of the bacteria throughout the droplet where most of the bacteria will reside within the cap end region of the droplets. We imaged at 15ul/min, 30ul/min and 60ul/min volume flow rates. The vortices size will change the cap ends region with varying velocity.Citation21 This pattern is demonstrated in the bacterial droplets where with increasing velocity the bacteria move closer to the back of the droplet ().
Figure 7A. A diagram of the internal circulations within a droplet where there are 2 regions of circulation; center rotations and 2 rotations at each cap end. The line demonstrates the region where most of the cells reside.
A vortex pattern caused the accumulation of the cells in the cap ends at 60ul/min () and as and the other cells rotate around this accumulation. This effect was only visible at 60ul/min, this mechanism is preventing the bacteria from receiving sufficient nutrients after four hours (as seen in ). Although the bacteria stay alive the availability of nutrients is preventing the growth of the E.coli. The optimum conditions found were at 30ul/min where the vortex formations do not inhibit the growth of the bacteria.
Antibiotic treatment of E.coli
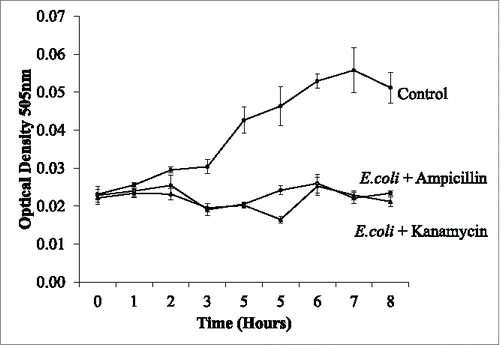
Droplets were created to test the effectiveness as bioreactors in determining the growth of E.coli when treated with antibiotics. Three tests were undertaken an initial test was testing E.coli against ampicillin (Sigma Aldrich) final concertation 0.05 mg/ml and kanamycin (Sigma Aldrich) 0.15 mg/ml and two controls of E.coli culture without an antibiotic and LB with no additives. The second test used ampicillin resistant E.coli and these droplets were tested against kanamycin and ampicillin. The third test used E.coli cultures grown in the droplets and ampicillin and kanamycin added to the cultures after 6 h of growth in the droplets and a control of E.coli with no drug added. We performed the mixing within the three tests using a drop off junction (). Each test gave a rapid indication of the effectiveness of the antibiotic as well as indicates if the strain was resistant to the antibiotic.
The initial test () demonstrated the effect of ampicillin and kanamycin on the growth of the bacteria in 8 droplets. The drug was delivered in the smaller droplet (500nl) and mixed 2:1 with the large droplet containing the E.coli (1000nl) culture. The fusion of the droplets delivered the drug to give a final volume of 1500nl. As expected, the antibiotics work effectively to prevent the growth of the E.coli when mixed on the system (). The bacteria continued to grow only in the droplets that contain no drugs. This test was all done on the same system at the same time proving that many samples can be examined in parallel, using a fraction of conventional volumes.
Figure 7B. Images of the bacteria droplets at varying flow rate 15–60 ul/min. A dotted line shows the area of most concentration at 15 ul/min, this line is placed at the same point in shown in 30 ul/min and 60ul/min where it is clear that the bacteria moves
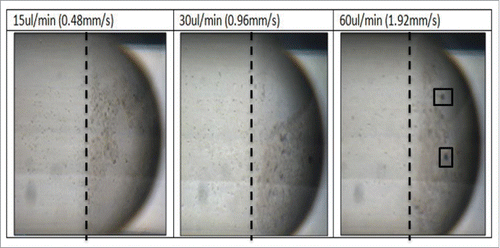
Figure 8. The treatment of bacterial cultures within the droplets. Droplets of; E.coli, E.coli mixed with ampicillin and E.coli mixed with Kanamycin were monitored over time. Antibiotic treated droplets are prevented from growing while the non-treated E.coli continue to grow further into the cap ends. At 60 ul/min 2 internal circulations are visibly present in the cap ends.
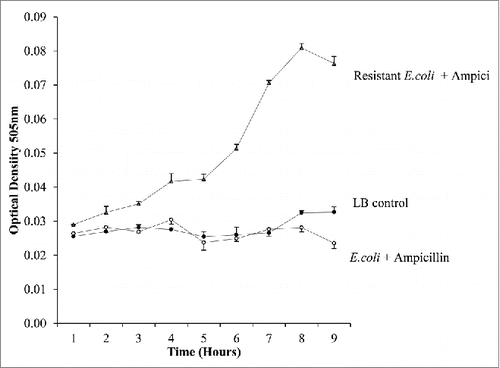
The second test was to investigate ampicillin resistant E.coli when cultured in the presence of ampicillin (). The antibiotics were mixed with the samples at time 0. The ampicillin resistant bacteria mixed with ampicillin continue to grow while the ampicillin resistant bacteria cultured in the presence of Kanamycin did not grow. This shows the integrity of the system in identifying resistance to bacteria and detecting a suitable antibiotic to prevent proliferation of the bacteria.
Figure 9. The identification of resistance to antibiotics. E.coli droplets and ampicillin resistant E.coli droplets were monitored over time with ampicillin mixed at time 0. The continued growth of the resistant E.coli is evident while the non-resistant strain were prevented from growing
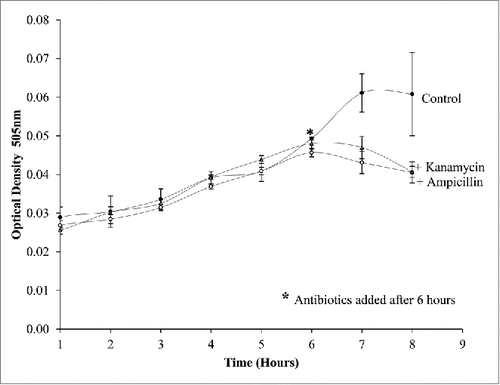
The final test on this system was done by splitting one bacterial culture into multiple droplets 8 droplets for each sample. Once growth was established, kanamycin and ampicillin were added to the droplets after 6 h using our drop off junction. The effect of the drugs on the cultures was instant with subsequent measurements showing a reduction in optical density and hence a reduction in growth (). This illustrates the ability of the instrument to culture bacteria and mix antibiotics into the droplet culture in continuous flow. It also demonstrates that the mixing system is sufficient to treat cells and allow accurate monitoring of proliferation. Overall the system has shown an accurate response to drugs being added to the system with the reduction and prevention of growth.
Figure 10. E.coli droplets cultured for 6 h with ampicillin and kanamycin mixed at 6 h using the drop-off junction. The reaction is rapid as the reduction in cell growth is evident after 1 of adding the antibiotics while the cells without antibiotics continue to grow.
Conclusion
In summary, here we describe the development of a microfluidic system using low volume reagents to identify bacterial resistance. The microfluidic system has proven that the technology simplifies the culture of bacteria favorable when compared to current and traditional culture methods. We have determined the optimum culture volume and droplet velocity that promotes bacterial growth and we illustrate how we can deliver antibiotic solutions to culture droplets using drop off junctions. This system would have many advantages in the laboratory and clinical setting as it facilitates the contained and miniaturized liquid culture of bacteria and may help provide information more effectively in to clinicians to more accurately treat bacterial infections in patients. We demonstrate that the instrument can identify resistance within one hour. The mixing system within the instrument provides a distinct advantage as it can test thousands of assays against thousands of cultures in a low volume, low cost, time effective way with minimal user handling. Recognition of the flow mechanisms within the droplet allows optimization of the platform. The effective culturing and use of microfluidic droplets as bioreactors will not only decrease the cost of testing but also allow more tests to be undertaken in parallel. The ability to test on the system with low cost optics and without fluorescence material required to the system gives this instrument a distinct advantage over other microfluidic methods. The ability in a single test to identify bacterial growth and provide a successful treatment of a bacterial strain may provide more effective antibiotic treatment identification in a clinical setting and potentially reduces ineffective treatment diagnosis. This proof of concept study argues favorably for the use of microfluidic platforms to help identify antibiotic resistant strains of bacterial.
Disclosure of potential conflicts of interest
No potential conflicts of interest were disclosed.
Funding
The authors greatly acknowledge the financial support of the Stokes Laboratories, University of Limerick and funds from Science Foundation Ireland, Grant 13/CDA/2228 (to PK).
References
- National C, for, Health, Statistics. Antibiotic Resistance Threats in the United States, 2013. USA: U S Department of Health and Human Services, 2013
- Kollef MH, Fraser VJ. Antibiotic resistance in the intensive care unit. Annals Internal Med 2001; 134:298-314; http://dx.doi.org/10.7326/0003-4819-134-4-200102200-00014
- Rubin RJ, Harrington CA, Poon A, Dietrich K, Greene JA, Moiduddin A. The economic impact of Staphylococcus aureus infection in New York City hospitals. Emerging Infect Dis 1999; 5:9-17; PMID:10081667; http://dx.doi.org/10.3201/eid0501.990102
- McDonnell N. Group. Antibiotic Overuse: The Influence of Social Norms. J Am College Surgeons McDonnell Norms Group 207:265-75
- Mohan R, Mukherjee A, Sevgen SE, Sanpitakseree C, Lee J, Schroeder CM, Kenis PJA. A multiplexed microfluidic platform for rapid antibiotic susceptibility testing. Biosensors Bioelectronics 2013; 49:118-25; PMID:23728197; http://dx.doi.org/10.1016/j.bios.2013.04.046
- Reller LB, Weinstein M, Jorgensen JH, Ferraro MJ. Antimicrobial susceptibility testing: a review of general principles and contemporary practices. Clin Infect Dis 2009; 49:1749-55; PMID:19857164; http://dx.doi.org/10.1086/647952
- Chang WH, Wang CH, Lin CL, Wu JJ, Lee MS, Lee GB. Rapid detection and typing of live bacteria from human joint fluid samples by utilizing an integrated microfluidic system. Biosensors Bioelectronics 2015; 66:148-54; PMID:25460896; http://dx.doi.org/10.1016/j.bios.2014.11.006
- Churski K, Kaminski TS, Jakiela S, Kamysz W, Baranska-Rybak W, Weibel DB, Garstecki P. Rapid screening of antibiotic toxicity in an automated microdroplet system. Lab on a Chip 2012; 12:1629-37; PMID:22422170; http://dx.doi.org/10.1039/c2lc21284f
- Hayes CJ, Dalton TM. Microfluidic droplet-based PCR instrumentation for high-throughput gene expression profiling and biomarker discovery. Biomol Detection Quantification 2015; 4:22-32; http://dx.doi.org/10.1016/j.bdq.2015.04.003
- Ward T, Faivre M, Abkarian M, Stone HA. Microfluidic flow focusing: drop size and scaling in pressure versus flow-rate-driven pumping. Electrophoresis 2005; 26:3716-24; PMID:16196106; http://dx.doi.org/10.1002/elps.200500173
- Squires TM, Quake SR. Microfluidics: Fluid physics at the nanoliter scale. Rev Modern Physics 2005; 77:977-1026; http://dx.doi.org/10.1103/RevModPhys.77.977
- Boedicker JQ, Li L, Kline TR, Ismagilov RF. Detecting bacteria and determining their susceptibility to antibiotics by stochastic confinement in nanoliter droplets using plug-based microfluidics. Lab on a Chip 2008; 8:1265-72; PMID:18651067; http://dx.doi.org/10.1039/b804911d
- Sun P, Liu Y, Sha J, Zhang Z, Tu Q, Chen P, Wang J. High-throughput microfluidic system for long-term bacterial colony monitoring and antibiotic testing in zero-flow environments. Biosensors Bioelectronics 2011; 26:1993-9; PMID:20880691; http://dx.doi.org/10.1016/j.bios.2010.08.062
- McCarthy C. On the Utilisation of Taylor flows for Automation Cell to Signal. Department of mechanical, aeronautical and biomedical engineering. Ireland: University of Limerick, 2015
- Baroud CN, Gallaire F, Dangla R. Dynamics of microfluidic droplets. Lab on a Chip 2010; 10:2032-45; PMID:20559601; http://dx.doi.org/10.1039/c001191f
- Tice JD, Song H, Lyon AD, Ismagilov RF. Formation of droplets and mixing in multiphase microfluidics at low values of the reynolds and the capillary numbers. Langmuir 2003; 19:9127-33; http://dx.doi.org/10.1021/la030090w
- Kiefer J, Ebel N, Schlucker E, Leipertz A. Characterization of Escherichia coli suspensions using UV/Vis/NIR absorption spectroscopy. Analytical Methods 2010; 2:123-8; http://dx.doi.org/10.1039/B9AY00185A
- Jakiela S, Kaminski TS, Cybulski O, Weibel DB, Garstecki P. Bacterial growth and adaptation in microdroplet chemostats. Angewandte Chemie Int Edition 2013; 52:8908-11; http://dx.doi.org/10.1002/anie.201301524
- McClenaghan VAGaNH. Understanding bioanalytical chemistry principles and applications. John Wiley & Sons, Ltd, 2009
- Zhong JJ, Fujiyama K, Seki T, Yoshida T. A quantitative analysis of shear effects on cell suspension and cell culture of perilla frutescens in bioreactors. Biotechnol Bioengineering 1994; 44:649-54; http://dx.doi.org/10.1002/bit.260440512
- Kurup GK, Basu AS. Hydrodynamic particle concentration inside a microfluidic plug. 14th International Conferene on Minaturized Systems for Chemsity and Life Sciences Netherlands: MicroTAS 2010. 2010; 2:740-742