 ?Mathematical formulae have been encoded as MathML and are displayed in this HTML version using MathJax in order to improve their display. Uncheck the box to turn MathJax off. This feature requires Javascript. Click on a formula to zoom.
ABSTRACT
Understanding the hip joint surface contact stress distribution characteristics is helpful to determine hip joint biomechanical features and abnormal pathological behavior. Firstly, a 3-dimensional static hip joint biomechanical model is built using analytical method of model in order to study biomechanical properties including bearing area, stress distribution and the peak value of the contact stress of the femoral head, which reveals the relationship between the biomechanical properties and its geometric parameters. Secondly, based on the finite element analysis of the hip joint model, the contact stress distribution on the surface of femoral head is acquired under the condition of the different joint force and the acetabulum coverage rate. Finally, according to the evaluation of the femoral head surface stress and contact stress peak under different load distribution, accuracy and universality of the biomechanical model is verified.
Introduction
The hip joint is the body's largest weight-bearing joint. The ball-and-socket structure plays a role of conducting gravity. Among the multiple active joints in the body, the hip joint is the most stable and allows a wide range of human action to be completed. In addition, it is considered the most common multiple lesions joint in clinical studies. For instance, in arthritis caused by hip dysplasia, if the pathological change cannot be corrected in a timely manner, the acetabulum will divorce from the original position, which may cause dislocation. As a result, the acetabulum cannot cover the femoral head in the original ball-and-socket manner. Thus, the weight-bearing area on the articular surface is reduced, and the stress is increased. In addition, the stress is focused on the outer edge of the acetabulum. Eventually, hip osteoarthritis will occur. Therefore, establishment of a simulation model for contact stress on the surface of the hip joint will aid in the timely detection of the condition of the diseased joint. This will provide important reference data for the determination of treatment programs.
Research methods for analyzing hip biomechanical properties mainly include the experimental methods and various numerical methods.Citation1-4 For a long time, the biomechanical properties of human bones were analyzed by in vitro research. For example, Taylor et al. pointed out that, under the influence of the hip joint or gluteal muscles, there were significant difference between the femoral interior compressive stress and exterior tensile stress;Citation5 Zhang et al. tested fresh femur specimens of healthy adults using an MTS testing machine, and found that, under longitudinal compression, 3-point bending, and axial torsion, the mechanical distribution borne by the femoral shaft was different in different sections under the same load.Citation6 This method of determining bone biomechanical properties through mechanical experimentation was limited to obtaining the distribution model for contact stress in individual living tissue. Most researchers used numerical analysis simulation methods to simulate the biomechanical behavior of living tissues, of which the finite element method was the most widely used. It was initially applied in studies of mechanical problems in the cardiovascular system, and began to be used in biomechanical studies on orthopedics in the 1970s;Citation7 in the 1980s, its application spread to various parts of the skeleton.Citation8 For example, researchers at Pennsylvania State University established a simulation model of the legs using the finite element method.Citation9 A fast finite element model was established by the Human-Computer Interaction Technology Laboratory in Washington University.Citation10 These finite element analyses were developed to simulate the biomechanical properties of human tissues, with the advantages of complex modeling and higher accuracy in the results. However, it offered no advantage in terms of computing speed and the complex analysis process was simultaneously more demanding for the operator.
In summary, this study intended to solve 2 problems. Firstly, we were dedicated to finding a simple and special calculation method for contact stress in the articular surface of the hip joint. Secondly, we were dedicated to validating the accuracy of this calculation method in characterizing the contact stress in the articular surface of the hip joint. Based on the above objectives, this study established a precise 3-dimensional static mathematical model for contact stress in the articular surface of the hip joint. The model was used to calculate characteristics, such as the bearing area, stress distribution, and the peak value of contact stress, in the articular surface of the hip joint. The model yielded an innovative idea of the relationship between the mechanical properties and the geometric parameters of the hip surface. We further proposed a way of using the finite element method to establish a virtual model of the hip joint for analysis of contact stress distribution in the articular surface of the hip joint, as well as the peak value of the contact stress under different loads. The results of the analysis were compared to the constructed results of the mathematical model for verification of the accuracy and universality of the mathematical model for contact stress established in this study.
Materials and methods
Establishment of the mathematical model for contact stress in the articular surface of the hip joint
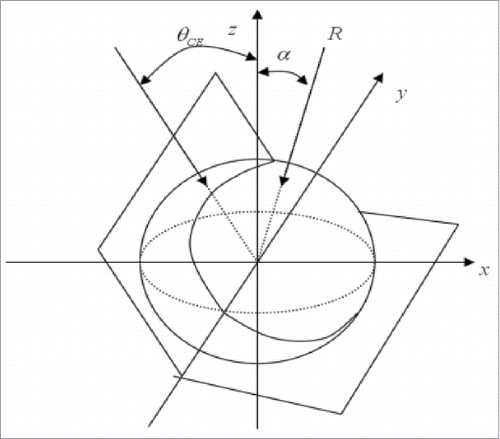
The hip spherical coordinate system was established based on the right hip as the research object. The center of the spherical joint was placed at the origin of the coordinate system. The X and Z-axes were in the coronal plane of the body, and Y-axis was in the sagittal plane of the body. The direction of the X-axis was defined from the right pointing to the left of the body; the Y-axis was defined as pointing to the back; and the Z-axis was defined as pointing vertically. shows the coordinate system of the established model of the hip joint.
The tissue fluid between the bone and cartilage could play a role of lubrication, thus in the model the influence of friction was ignored, and only the stress was considered. At this moment, the tangential stress acting on the spherical joint sphere was zero. The resultant force acting between the head and acetabulum was the radial pressure R, which was located on the contact surface of the hip joint, pointing toward the center of the sphere. Suppose the spheroidal coordinates of any point on the articular surface were (,
, r), and the spheroidal coordinates of the acting point of the resultant force R were (
,
, r), wherein,
and
were the azimuthal angles;
and
were the polar angles; and r was the radius of the sphere. The resultant force R acting on the contact surface and the contact pressure p of any point on the spheroidal joint should meet the following integral relationship:
(1)
(1) Where in,
,
The elastic modulus of the articular cartilage was significantly smaller than that of the femur and acetabulum. The femoral head was considered as a rigid sphere, and the acetabulum was as a rigid hemispherical shell. These two components were concentric to each other, and the articular cartilage was located centrally between them. When a load was applied to the hip joint, the articular cartilage was extruded, becoming thinner. However, the deformation was within the elastic range. Under the physiological load, the radial strain of the articular cartilage was significantly smaller than the radius of the femoral head. The articular cartilage was considered as a linear elastic body. Suppose the line of direction through the origin of the coordinate system, and parallel to the load direction, was intersected by the acetabular hemispherical surface. According to the principles of theoretical mechanics, this point of intersection coincided with the acting point of the resultant force. At this moment, the maximum stress on the spherical surface of the joint was the contact stress
on the acting point of the resultant force. Therefore, the stress of contact pressure p of any point on the articular surface and the contact pressure
on the acting point of the resultant force should meet the following linear relationship:
(2)
(2) Where in,
is the central angle between any point on the contact surface and the acting point of the resultant force.
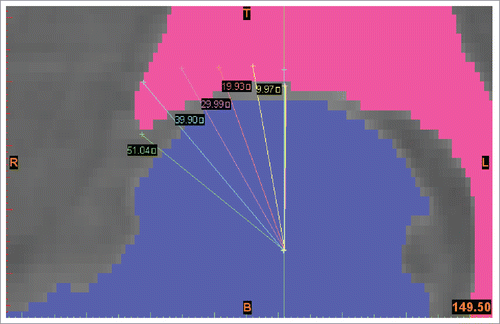
Before discussing the bearing area of the femoral head surface, the concept of central-edge angle (CE angle) should be introduced. It is the included angle between the vertical of the center of the femoral head and the outer edge of the acetabulum. The CE angle was an important indicator to measure the contact area of the hip joint. The contact area decreased with the reduction of the CE angle. Suppose the acetabulum was a regular hemispherical concave, then the contact area and the CE angle have a linear relationship. The CE angle value can be gotten by using angle measuring function in Mimics software. The result of angle measurement is 51.04°. For building acetabulum and cartilage model of different CE angle, other angle should be marked, as shown in .
While standing motionless on a single foot, the component of contact force of the hip joint perpendicular to the coronal plane was only 3% of the resultant force in the coronal plane. Thus, this could be ignored.Citation11 Therefore, the contact force of the hip joint only included 2 components, namely . The angles
,
,
,
, and θCE measured counterclockwise around the axis were stipulated as positive when they orientated forward along the axis from the origin of the coordinate system. The coordinate axis was rotated so that the acting point of the resultant force was located on the vertex of the spherical joint. The integral relations of the mathematical model in the newly established coordinate system were as follows:
(3)
(3) Where
,
.
These integrations were solved, and the stress of the contact pressure of the acting point on the spherical surface was found to be:(4)
(4)
This analysis showed that when the line of direction through the coordinate system origin, and parallel to the load direction, was intersected with the acetabular hemispherical surface, this point of intersection coincided with the acting point of the resultant force. In other words, the point of maximum stress of contact pressure on the articular surface acted on the point of intersection. At this moment, =
. When the same line of direction was intersected with the articular spherical surface and the intersection point is out of contact surface, the resultant force R did not cross the spherical center. The peak value
of contact pressure in the articular spherical surface was the stress value of the nearest point to the point of intersection on the edge of the bearing area. At this moment, the maximum contact stress satisfied Eq. (2), i.e.,
.
Finite element model and contact stress in the articular surface of the hip joint
shows finite element modeling process. With the total hip being the object of study, the spiral CT was carried out in normal adult males. The scan length was 346 mm and the space between scan layers was 1.5mm. CT images were output in DICOM format and stored in the computer. CT data in DICOM format was imported into the medical image processing software Mimics, and thus the tomographic images could be obtained.
After CT images were imported into Mimics, the range of image editing was determined by setting the threshold. The data of bone tissues were then extracted based on the difference in gray value between bone tissues and cartilage. The most basic segmentation could be achieved. The segmented 2 parts underwent 3-dimensional reconstruction, and formed the 3-dimensional model of the femur and acetabulum. The cartilage could not be clearly displayed in the CT image for its smaller gray value, so that MRI images were applied for 3-dimensional reconstruction to the articular cartilage.
Firstly, the generated 3-dimensional model was imported into the reverse engineering software Geomagic Studio 2012. The model was modified and optimized. Secondly, the model was matched using a number of curve patches with different sizes and curvatures. The final 3-dimensional geometric model was stored in IGS format. Finally, the femur, articular and acetabular IGS model was imported into Unigraphics NX 8.0 for assembly. The assembly model of the hip joint was then exported in IGS format.
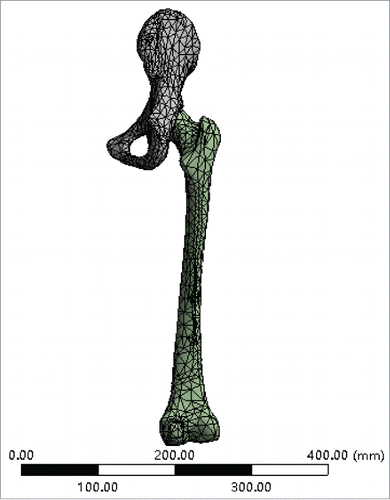
The geometrical model that had been assembled was imported into ANSYS 14.0 s to generate the solid model automatically. Before meshing, appropriate element attributes should be set according to the material properties of bone. Herein, both the cortical bone and articular cartilage were defined as continuous and uniform isotropic elastic materials. Surface-surface contact was assigned between cartilage and cortical bone. The elastic modulus of the cortical bone was defined as 17300MPa, with a Poisson's ratio of 0.29; the elastic modulus of the cartilage was 10MPa, with a Poisson's ratio of 0.4.Citation12 The element type was defined as a 10-node tetrahedral solid element (10solid187). After the material properties and element type were set, the model underwent automatic meshing. Then the entire sphere of the femoral head underwent mesh refinement by the Remesh command to improve the accuracy of analysis. The final 3-dimensional finite element model was generated, with a total of 6397 elements and 12378 nodes, as shown in .
The three-dimensional finite element model was used to simulate the state of standing motionless on a single foot. The distal femur was completely fixed, while the acetabulum and the articular cartilage were partially fixed, with movement limited to vertical movement in the coronal plane. The contact force of the hip joint under these conditions was approximately 3 times that of the mass of the body i.e., for a body mass of 70 kg, the size of load forced on the acetabulum was 2100 N.Citation13 The load direction was located in the OXZ plane through the center of the femoral head, and the CE angle was set according to the CE angle of the hip joint model.
The finite element model of the total hip was established in this study in order to verify the mathematical model for contact stress in the articular surface of the hip joint. The finite element analysis method was used for stimulation of contact stress in the articular surface of the hip joint. This model was used to obtain the surface stress distribution and peak. This result was compared to the surface stress distribution and peak calculated by the mathematical model in order to evaluate the accuracy of the mathematical model.
Results and discussion
Analysis results of the peak value of contact stress in the articular surface of the hip joint
shows the peak values of contact stress in the articular surface of the hip joint with different load directions and CE angles, by the finite element model simulation analysis.
Table 1. Peak stress of different CE angle femoral head surface under different load direction.
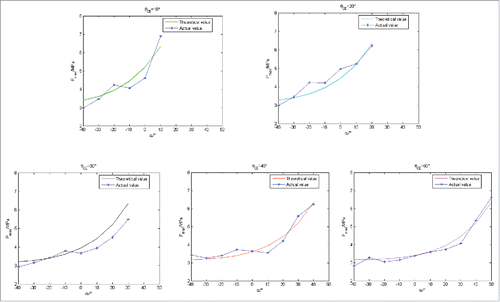
shows the changes in the peak values of contact stress in the articular surface of the hip joint with different θCE, with changes load direction. Wherein, the data obtained by the finite element analysis was sequentially connected by a straight line. The smooth curve represented the theoretical curve of the mathematical model.
Figure 5. Contrast of simulation results (actual value) and calculated results (theoretical value) in the mathematical model.

The mathematical model showed that for different θCE, when the difference of θCE – was equal, the results of the peak value of contact stress was similar, which was consistent with the calculated results of the simulation model. Meanwhile, the contrast of the mathematical model and simulation results showed that the theoretical curve of the mathematical model was relatively similar to that of the finite element analysis curve, regardless of the trend or value. This verified the accuracy of the mathematical model established in this study.
Distribution of contact stress in the articular surface of the hip joint
From the results in , when loads were applied in different directions to the finite element model with different θCE, all of the peak values of contact stress in the articular surface were near to the intersection of the femoral head surface and the load direction. In addition, they are distributed radially to the periphery, decreasing from the center to the periphery. When the θCE was 40°, = −30°, the peak value of the stress was close to the peak value of the stress when the θCE was 30°,
= −40°. This conclusion was consistent with the results of the mathematical model. However, from the comparison of (c) and (d), it was shown that at a θCE of 30°, there was almost no difference in the stress distribution between
= − 40° and
= −50°. When
= −50°, there was still no significant change in the position of the peak value of the stress in the articular surface of the femoral head. When θCE was 10°, the deflection angle
of the load increased to −60°. As shown in (f), the surface stress was concentrated on the contact edge of the hip acetabulum and the femoral head, which was in contrast to the calculated results of the mathematical model established in this study. This reason for this was that the geometrical model of the hip joint established in this paper was thick at the top and thin in the surrounding area, making the top of the femoral head and femoral articular cartilage in full contact with each other. Simultaneously, the gaps were formed in the peripheral parts. When the deflection angle of the load was gradually increased to a certain value, interspaces began to form in the joint capsule in the acting position of the load. Thus, there was no contact pressure stress generated at the intersection location of the femoral head surface and the load direction. The model was invalid for the contact of the joint capsule, thus the stress in the articular surface of the femoral head was concentrated at the edge of the acetabulum, in contact with the femoral head.
Figure 6. von Mises stress diagram in the articular surface of the hip joint. (A) von Mises stress diagram in the articular surface of the hip joint with the θCE = 50° and = 0°; (B) von Mises stress diagram in the articular surface of the hip joint with the θCE = 40° and
= −30°; (C) von Mises stress diagram in the articular surface of the hip joint with the θCE = 30° and
= −40°; (D) von Mises stress diagram in the articular surface of the hip joint with the θCE =30° and
= −50°; (E) von Mises stress diagram in the articular surface of the hip joint with the θCE = 20° and
=10°; (F) von Mises stress diagram in the articular surface of the hip joint with the θCE = 10° and
= −60°.

Conclusions
The present study aims to establish a simple model for contact stress on the articular surface of the hip joint, which meets the accuracy requirements. We have mainly solved 2 problems to achieve the objective. Firstly, we determined the expression of simple contact stress in the articular surface of the hip joint. The mathematical model for contact stress in the articular surface of the hip joint was established on the basis of the relationship between contact stress and the geometrical parameters. Secondly, this model was accurately verified by finite element analysis. The following conclusions were achieved through analysis and verification:
The mathematical model could correctly reflect the distribution of stress in the articular surface of the hip joint. When the load deflection angle was greater than −40°, the same characteristics of stress distribution were shown for the mathematical and finite element model. When the load deflection angle
was less than −40°, there was a larger deviation between the 2 models due to the contact failure in the finite element model. Typically, the body's normal activities are conducted within in a load deflection range of −20°to 10°, thus the mathematical model could correct reflect the distribution of the stress in the articular surface of the hip joint.
The mathematical model could correctly calculate the peak values of contact stress in the articular surface of the hip joint at different force directions and CE angles. The simulation and mathematical model results of the peak values of contact stress in the articular surface of the hip joint were compared at different directions, including θCE = 10°, θCE = 20°, θCE = 30°, θCE = 40°, and θCE = 50°. The results were similar in terms of the trends and values.
The mathematical model was simple and satisfied the accuracy requirement. The simulation of the contact stress in the articular surface of the hip joint using the mathematical model could avoid the complex process of the finite element modeling and analysis. In addition, it could also meet the requirement of clinical accuracy in 2 aspects of the values and trends. It could realize the target of using a simple method to achieve the contact stress data without in vitro biomechanical experiments.
Due to the limit of the finite element model, the conclusion “When the direction of the resultant force R is perpendicular to the plane of the outer edge of the bearing area, there was the minimum peak value of contact stress in the articular surface of the femoral head” derived by the mathematical model had not been validated.
Disclosure of potential conflicts of interest
No potential conflicts of interest were disclosed.
Funding
The authors would like to give thanks for the financial support of NSFC (61272387), NCET (NCET-13-0756), State Key Laboratory of Robotics and System (HIT) and Chang Jiang Scholar Candidates Program for Provincial Universities in Heilongjiang (2013CJHB007).
References
- Xiao HT, Song SF, Zheng NS, Ma YT, Zhang GQ. Total hip arthroplasty in the treatment of advanced non-traumatic osteonecrosis of femoral head. Progress Modern Biomed 2014; 27(12):5291-5.
- Li R, Chen T, Piao FL, Zhang LJ. Hip replacement and sports femoral head injury. J Clin Rehabilitative Tissue Engineering Res 2011; 15(48):9078-81.
- Rushfeldt PD, Mann RW, Harris WH. Improved techniques for measuring in vitro the geometry and pressure distribution in the human acetabulum II instrumented endoprosthesis measurements of articular surface pressure distribution. J Biomech 1981; 14(5):315-23; PMID:7263723; http://dx.doi.org/10.1016/0021-9290(81)90041-5
- Hodge WA, Fijan RS, Carlson KL, Burgess RG, Harris WH, Mann RW. Contact pressures in the human hip joint measured in vivo. Proc Natl Acad Sci USA 1986; 83(9):2879-83.
- Taylor WR, Roland E, Ploeg H, Hertig D, Klabunde R, Warner MD, Hobatho MC, Rakotomanana L, Clift SE. Determination of orthotropic bone elastic constants using FEA and modal analysis. J Biomech 2013; 35:767-73; http://dx.doi.org/10.1016/S0021-9290(02)00022-2
- Lu JP, Zhang JG. A development of 3D FEM for cranium brain based on CT. Microcomputer Information 2013; 22(8):211-3.
- Cowin SC. The mechanics properties of cancellous bone. In Bone Mechanics 1979; 1:30-57.
- Felson DT. The epidemiology of osteoarthritis: Prevalence and risk factors. Am Acad Orthopaedic Surgeons 1985; 15(5):13-24.
- Polliack AA, Sieh RC, Craig DD, Landsberger S, McNeil DR, Ayyappa E. Scientific validation of two commercial pressure sensor systems for prosthetic socket fit. Prosthet Orthot Int 2000; 24 (1):63-73; PMID:10855440; http://dx.doi.org/10.1080/03093640008726523
- Rho JY, Hobatho MC, Ashman RB. Relations of mechanical properties to density and CT numbers in human bone. Med Eng Phys 1995; 17(5):347-55; PMID:7670694; http://dx.doi.org/10.1016/1350-4533(95)97314-F
- Liang A, Ji SJ, Fan CF. Stress change of congenital subluxation of hip and dysplasia of acetabular by finite element analysis. Chin J Pediatric Surgery 2000; 21(6):327-30.
- Maxian TA, Brown TD, Pedersen DR, Callaghan JJ, Maxian TA. Three-dimensional sliding/contact computational simulation of total hip wear. Clin Orthop 1996; 33(3):41-50; PMID:8981881
- Wang GY, Zhang CC, Xu SG. Three-dimensional finite element analysis of hip contact area and contact pressure during normal walking. J Clin Rehabilitative Tissue Engineering Res 2011; 15(22):3991-4.


