
 ?Mathematical formulae have been encoded as MathML and are displayed in this HTML version using MathJax in order to improve their display. Uncheck the box to turn MathJax off. This feature requires Javascript. Click on a formula to zoom.
ABSTRACT
The main aim of this study was to investigate the effects of the initial pH values of the buffer on photo-fermentation biohydrogen production. Hydrogen production and the kinetics of it under different initial pH values were analyzed. Effects of initial pH values on reducing sugar consumption, hydrogen production rate, and byproduct production were evaluated at initial pH values of 5–7. The results showed that initial pH values of phosphate buffer had a significant effect on biohydrogen production via photo-fermentation. With the initial pH value of phosphate buffer at 6.0, the cumulative hydrogen production reached its maximum, 569.6 mL. The maximum hydrogen production rate was 23.96 mL/h at the initial pH value of 6.5. With the initial pH values at 5.0 and 7.5, the maximum hydrogen production rates were becoming lower, only 5.59 mL/h and 5.42 mL/h, respectively. And with the increase in pH values, the peak period of hydrogen production was gradually delayed, indicating that the alkaline environment had a negative effect on the ability of photosynthetic bacteria. This study revealed the influence of phosphate buffer initial pH values on the biohydrogen production via photo-fermentation and aimed to provide a scientific reference for further improving the theory and technology for biohydrogen production from biomass.
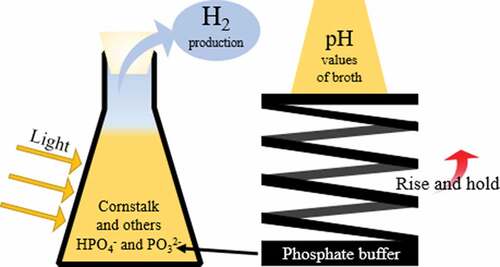
Graphical Abstract
1. Introduction
With the rapid depletion of fossil fuel and the deterioration of the environment, the development and utilization of clean renewable energy has become a study hotspot. Hydrogen is a high-energy clean fuel, regarded as an attractive future energy carrier because of its conversion to energy yielding only pure water [Citation1]. And it is a possible alternative to replace fossil fuels because it has the potential to eliminate most of the problems that the fossil fuels create. There are many methods to produce hydrogen. Hydrogen can be produced by fossil fuels (coal, natural gas, and nuclear energy) and renewable resources (biomass, water, wave, wind, solar, and geothermal energy) [Citation2]. Today, 50% of H2 comes from natural gas (steam methane reforming), 30% from cracked petroleum products, and 18% from gasification of coal and electrolysis of water [Citation3]. Compared with traditional hydrogen production methods, such as reforming petrochemical resources or chemical materials, using renewable biomass to produce hydrogen is a new technology that integrates clean production and resource recycling [Citation4]. China is one of the largest agricultural countries in the world. And corn straw is one of the largest agricultural wastes in China, with an annual output of 327.4 million tons [Citation5]. In addition, the contents of cellulose and hemicellulose in corn stalk are high, and the content of lignin is low. Besides that, corn stalk is easy to be decomposed and utilized. Therefore, corn stalk is an ideal raw material for producing bio-hydrogen [Citation6].
At present, the production of hydrogen by microbial fermentation is mainly concentrated on the two aspects of anaerobic dark fermentation and photo-fermentation hydrogen production [Citation7]. Because photo-fermentation hydrogen production has the advantages of extensive raw material resources and thorough substrate utilization, it has become a major research direction of hydrogen production technology at home and abroad [Citation8]. The pH value is one of the important influencing factors of the hydrogen production technology of photosynthetic organisms, and it has a significant effect on the hydrogen production process of photosynthetic bacteria when using hydrolysis corn stalk as a substrate. Study by Liu et al. [Citation9] showed that the hydrogen production of photosynthetic bacteria also increased at first and then decreased as the pH value increased. With the pH value at 6, the hydrogen production rate and total yield reached the maximum. Phosphate can be used as a buffer in the microbial fermentation hydrogen production system, it also provides phosphorus for the growth of microorganisms. Investigation on the effect of phosphate on hydrogen production by microbial fermentation was mainly focused on the dark fermentation of hydrogen production by anaerobic bacteria. For example, Li et al. [Citation10] found that K2HPO4 can promote the growth and hydrogen yield of biohydrogen bacterium R3sp.nov. and it had a positive effect on maintaining the pH values of the medium. When the mass concentration of K2HPO4 was 1.5 g/L, the biogas production and hydrogen yield of biohydrogen bacterium R3sp.nov. reached the maximum, which were 4960 mL/L, 2107.5 mL/L, respectively. Wang [Citation11] found that phosphate could influence anaerobic fermentation bacteria to produce hydrogen. A 4 g·L−1 NaHCO3, 500 mg·L−1 NaH2PO4 · 2H2O, and K2HPO4 · 3H2O were added in hydrogen production medium, the hydrogen yield of glucose reached 1.94 mol·mol−1, which was 56% higher than the control group. Lin et al. [Citation12] found that phosphate solution had a great impact on anaerobic bacteria to produce hydrogen. With the concentration of NaH2PO4 was 600 mg/L in hydrogen production medium, the hydrogen production rate of mixed strains was increased by 1.9 times, and the hydrogen yield and hydrogen production rate had also increased. In studies by Zhang et al. [Citation13], the results of hydrogen production kinetics showed that K2HPO4 in the medium could increase the maximum hydrogen production potential and shorten hydrogen production rate at best. The delay time of hydrogen production was increased with the concentration of K2HPO4 was 10 mmol/L, the maximum hydrogen production potential reached the most and the maximum hydrogen production rate also became larger, which were 40.81 mL/g and 1.87 mL/(h·g), respectively. However, most of the previous experimental methods used the buffer at pH value 4.8 and then adjusted the pH to neutral with KOH. The buffer may work better if making the initial pH value of the buffer to 7 directly. But no similar studies were found.
In this paper, enzymatic hydrolysis corn stalk was used as a hydrogen-producing substrate. Phosphate was added to the medium as a buffer. And the phosphate buffers initial pH values were 5, 5.0, 5.5, 6.0, 6.5, 7.0, and 7.5, with the light conditions of 3000 Lux. In order to provide references for further improving the theory and hydrogen production technology of photo-fermentation from corn straw, the effect of phosphate buffer at different initial pH values on hydrogen production was studied.
2. Materials and methods
2.1. Materials
The bacteria used in this experiment were consortium, it included Rhodospirillum rubrum (27%), R.capsulata (25%), R.pulastris (28%), Rhodobacter sphaeroides (9%), Rhodobacter capsulatus (11%). It was provided by Henan Agricultural University Key Laboratory of Renewable Energy New Materials and Equipment of the Ministry of Agriculture and Rural [Citation14]. The photosynthetic consortium was maintained in a medium containing 1 g/L of NH4Cl, 2 g/L of NaHCO3, 1 g/L of yeast extract, 0.2 g/L of K2HPO4, 4 g/L of CH3COONa, 0.2 g/L of MgSO4 · 7H2O, and 2 g/L of NaCl, and incubated at 30°C with light intensity of 2000 Lux for 3–5 days. The culture grown in an exponential period with a biomass concentration of 0.8 g/L was used as an inoculum for photo-fermentation [Citation15].
The corn stalk was taken from the experimental field of Science and Education Park of Henan Agricultural University. After being air-dried, it was pulverized into flocculent by a grinder, then was washed. After that, it was put into a stove and corn stalk pith was oven to constant weight with 50°C. Cornstalk was crushed into 80–100 μm as the raw material [Citation16].
KH2OP4- K2HOP4 buffer pH value formula is pH = pKa2 + lg (K2HOP4/KH2OP4) [Citation17]. The concentration of K2HPO4 and KH2OP4 added to fermentation broth at different pH values are shown in .
Table 1. Concentrations of K2HPO4 and KH2OP4 added to fermentation broths with different pH values
2.2 Experimental design
Five grams of corn straw powder and 1 g/mL (based on dry straw mass) cellulose liquid enzyme were added into 150 mL Erlenmeyer flasks. Different quality K2HPO4 and KH2OP4 were used as a buffer, and 75 mL photo-fermentation medium was also added into the bottle. On the control experiment, C6H8O7 and Na3C6H5O7 · 2H2O were used as a buffer. The control buffer's initial pH was adjusted to 7.0 by KOH. Photo-fermentation medium included NH4Cl (0.4 g/L), MgCl2 (0.2 g/L), K2HOP4 (0.5 g/L), NaCl (2.0 g/L), C5H8NO4Na·H2O (3.5 g/L), yeast extract (0.1 g/L). Each reactor was loaded with 50 mL of photosynthetic bacterial liquid. Biogas was collected in a 60 mL syringe attached to the outlet on the reactor. The reactors were incubated at 30°C with a light intensity of 3000 Lux [Citation14].
2.3 Analysis methods
The gas in the collection bag was extracted with a 60 ml syringe every 12 h. The hydrogen content in the gas sample was analyzed by gas chromatography (6820GC-14B, Agilent, USA) [Citation18], nitrogen gas was used as a carrier with a flow rate of 45 mL/min. The operational temperatures of column oven, injection port, and detector were set to 80°C, 100°C, and 150°C, respectively. Samples of the fermentation broth were collected every 12 h during the fermentation process. And the sample was centrifuged at 5000 rpm for 5 min in a centrifugal machine and then filtered the liquid through a 0.45 mm drain membrane filter. After being filtration, 0.6 mL of the supernatant was mixed with 0.6 mL of 0.2 moL/L HCl, volatile fatty acids (VFAs) and ethanol in culture samples were analyzed [Citation18] in a composition (6820 GC-14B, Agilent, USA) equipped with a capillary column (DB-FFAP) and flame ionization detector, nitrogen was used as the carrier gas at a flow rate of 30 mL/min. The pH value was measured once every 12 hours. And the pH value was measured by the pHS-3E pH meter. The measurement range was 0–14.00 with an accuracy of ± 0.01. Reducing sugar concentration was measured by the di-nitro salicylic (DNS) colorimetric method [Citation19].
2.4 Kinetic analysis
Accumulated hydrogen production during photo-fermentation was determined by the modified Gompertz equation [Citation20]. The modified Gompertz equation is:
P(t) is the cumulative hydrogen production, mL/g; Pmax is the maximum hydrogen production potential, mL/g; rm is the maximum hydrogen production rate mL/(h·g); λ is the delay period of hydrogen production, h; t is the time for the hydrogen production reaction to proceed, h; e is the reaction constant, which is 2.718 281 828. The nonlinear regression equation is used to directly enter the nonlinear least squares fitting. The sample method is used to minimize the sum of the squares of the parameters, and then iteratively estimate the parameters Pmax,rm and λ.
3. Results and discussion
3.1 Effects of initial pH values on biohydrogen production
After the photosynthetic bacteria were inoculated, they had to undergo a growth delay period (0–12 h) at first and adapt to the new growth environment. At this stage, the organisms grow slowly. In the subsequent logarithmic period (12–72 h), photosynthetic bacteria showed an exponential growth trend. After this period, the reproduction of the bacteria reached a dynamic equilibrium (72–168 h), it meant that the number of bacteria growth was equal to the number of deaths [Citation21]. shows hydrogen production during photo-fermentation processes at different levels of initial pH values. During photo-fermentation at initial pH of 6.0, the maximum cumulative hydrogen production of 569.61 mL. And cumulative hydrogen production at control experiment was much lower, 293.8 mL. Compared to the photo-fermentation at initial pH of 7.0, the cumulative hydrogen production of control experiment was lower, indicating that K2HPO4 promoted the growth and hydrogen yield of biohydrogen bacterium. In previous studies, when corn straw was used as material, the hydrogen yield was generally 36.08 mLH2/g to 126.22 mLH2/g [Citation3]. As shown in , the maximum hydrogen production in this study was at a relatively high level compared to previous experiments [Citation15]. With the initial pH values lower than 6.0, the hydrogen production capacity of photosynthetic bacteria gradually increased with increase in initial pH values, and the hydrogen production was 262.45–596.61 mL. However, with the initial pH value higher than 6.0, the hydrogen-producing ability of photosynthetic bacteria gradually decreased with increase in initial pH values. The results showed that the photosynthetic bacteria had the best hydrogen-producing ability with the phosphate buffer initial pH value of 6.0. This result is similar to the result of the study by Liu et al. [Citation9].
Figure 1. Effects of initial pH values on hydrogen production rate (a) and cumulative hydrogen production (b)
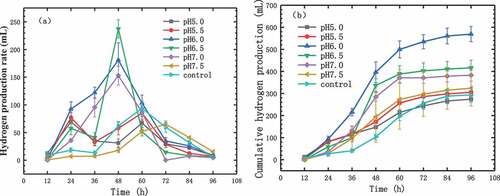
We can know that from ), the peak hydrogen production time and maximum hydrogen production rate of photosynthetic bacteria varied greatly with different initial pH values. Photosynthetic bacteria had the highest hydrogen production rate with phosphate buffer initial pH of 6.5, 19.64 mL/h. Low level of hydrogen production rate was observed during photo-fermentation at initial pH of 5.0 and 7.5, only 5.59 mL/h and 5.42 mL/h, respectively. Hydrogen production at initial pH values of 6.0, 6.5, and 7.0, the peak time of hydrogen production was from 36 to 48 h. After 48 h, the hydrogen production gradually dropped. And at the phosphate buffer initial pH values of 5.0 and 5.5, the peak period of hydrogen production from photosynthetic bacteria appeared at 12 to 24 h. After 24 h, the hydrogen production rate decreased at first and then increased. During photo-fermentation at control experiment, the highest hydrogen production rate was 7.8 mL/h. And the peak time of hydrogen production was from 48 to 60 h.
Combining , we can know that, the peak period of hydrogen production from photosynthetic bacteria was concentrated in 12–48 h at the phosphate buffer initial pH values of 6.0, 6.5, and 7.0. This period is the pre-logarithmic phase of photosynthetic bacteria. And in this period, the hydrogen production rate was the highest, because the number and activity of photosynthetic bacteria reached an optimal state [Citation22].
At the buffer initial pH values of 5.0 and 5.5, the photosynthetic bacteria need longer adaptation time under these conditions due to the lower pH values, resulting in unstable hydrogen production rates. At initial pH 7.5, the hydrogen-producing ability of photosynthetic bacteria was suppressed, and the cumulative hydrogen production was lower than that of others, only 207.18 mL. In a report by Tao et al. [Citation23], a photosynthetic bacterial strain can produce hydrogen at pH up to 9.5, but this strain was not able to produce hydrogen at pH of 10. Our bacterial showed a slightly lower tolerance to high pH, the hydrogen production was still dramatically inhibited by the pH of 7.5. However, the hydrogen production of the photosynthetic consortium could be further improved by optimizing other factors, such as light intensity, which can be evaluated in future research [Citation24].
The determination coefficient kinetic parameter R2 obtained from the hydrogen production kinetics analysis and fitting of the hydrogen production fermentation process are shown in . It can be known from that with the phosphate buffer initial pH values in the range of 5.0 to 7.0, the photosynthetic bacteria had the highest hydrogen production potential at the 6.0 pH value, which was 582.46 mL. With the phosphate buffer initial pH values in the range of 5.0 to 6.0, the maximum hydrogen production potential increased from 295.11 mL to 582.46 mL, and the maximum hydrogen production rate increased from 4.3 mL/h to 23.96 mL/h. With the phosphate buffer initial pH values in the range of 6.0 to 7.5, the maximum hydrogen production potential from 582.46 mL reduced to 237.82 mL, and the maximum hydrogen production rate reduced from 23.96 mL/h to 5.1 mL/h. It indicated that higher pH values can inhibit the hydrogen production ability of photosynthetic bacteria.
Table 2. Kinetic parameters of hydrogen production by photosynthetic bacteria
Table 3. Comparison of hydrogen yields with other relative works
3.2 Effects of initial pH values on reducing sugar concentration
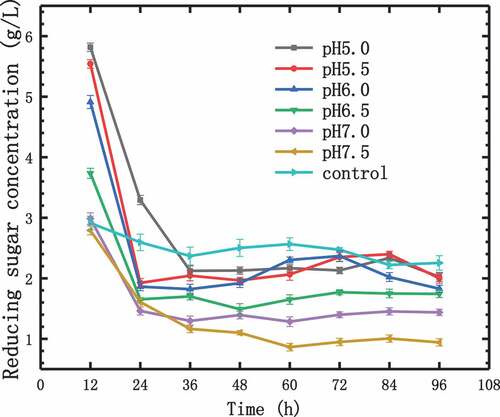
In the process of hydrogen production by fermentation, the hydrolysis and production of reducing sugars coexisted [Citation25]. The concentration of reducing sugar had been changing, and its concentration change rule is shown in . The initial substrate concentration was the same, so the initial reducing sugar concentration was the same too. In the first 12 h, the higher the initial pH value, the more the reducing sugar was degraded. At 24 h, the reducing sugar concentration reduced to 1.61–1.92 g/L during the photo-fermentation at initial pH values in the range of 5.5–7.5. With the initial pH of 5.0, the reducing sugar concentration was reduced to 3.30 g/L at 24 h. During the photo-fermentation of control experiment, the reducing sugar concentration reduced to 2.59 g/L at 24 h. During 24–36 h, the reducing sugar consumption rate decreased. At 36 h, the reducing sugar concentration was 1.17–2.13 g/L, and then within the next 60 h, the reducing sugar concentration became stable, because the production rate and consumption rate kept a balance. The concentrations of reducing sugar in fermentation broths with different initial pH values were maintained at different levels. But concentrations of reducing sugar of control experiment were higher than others. At 96 h, the reducing sugar concentration was 0.94–2.02 g/L. It can be seen from that the higher the pH values of the fermentation broth, the lower the concentration of reducing sugar. Indicating that at higher pH values, it is more favorable for the production of reducing sugar, but not for the degradation of reducing sugar. From 12 h to 96 h, the consumption proportion of reducing sugar was 52-65%. But the consumption proportion of reducing sugar was only 24.14% of control experiment. The result showed that photosynthetic bacteria had a better working efficiency when using phosphate as a buffer. Comparing to substrate conversion (40-80%) in previous studies using the same photosynthetic bacteria for hydrogen production, the substrate conversion was at a high level in this experiment [Citation26,Citation27].
Figure 2. Effects of initial pH values on reducing sugar concentration in fermentation broth
3.3 Effects of initial pH values on VFAs
During the process of photo-fermentation by photosynthetic bacteria, cellulase hydrolyzed cellulose in corn straw powder into reducing glucose. Glucose was produced by the enzymatic pathway and converted to volatile fatty acids (VFAs) after fermentation [Citation28]. Glucose releases hydrogen protons in the process of producing VFAs, and the hydrogen protons, together with high-energy electrons generated from photosynthesis or from metabolic pathways, produce H2 under the action of nitrogenase [Citation29]. Photosynthetic bacteria will produce the organic acids as final products during hydrogen production. The organic acids will cause a decrease in pH values and inhibit the activity of photosynthetic bacteria [Citation30].
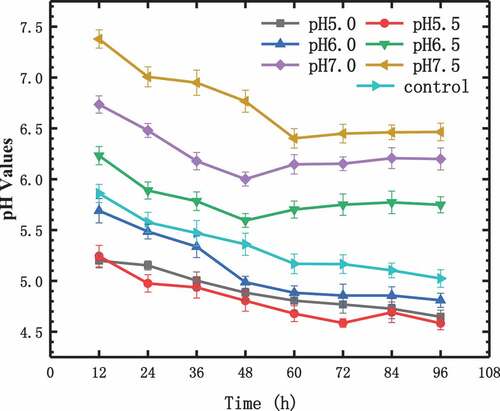
The production of acid will affect the pH values of the fermentation broth during the metabolism process. The pH values change the process of the fermentation broth is shown in . It can be seen from that with the initial pH values of the phosphate buffer of 5, 5.5, and 6.0, pH values of the fermentation broth decreased continuously, the final values were 4.65, 4.58, 4.81. Because when the initial pH value was low, the hydrogen-producing ability of the photosynthetic bacteria was weak, leading to acid accumulation to exceed acid consumption. At initial pH values of 6.5 and 7.0, the fermentation broth pH values continued to fall within 12–48 h, and accumulated more and more VFAs. The hydrogen production rate at this stage gradually increased, reaching the maximum hydrogen production rate at 48 h. The pH values increased at 60 h, it showed that the accumulation of acid decreases in 48–60 h, and the pH values remained stable after 60 h, the final values were 5.75 and 6.2. With the phosphate buffer initial pH of 7.5, the pH value continued to drop until 60 h, and remained stable after 60 h, with a final value of 6.51. During the fermentation of control experiment, the pH value was decreased continuously. Its initial pH value was 7.0 and final value was 5.02. The final pH value was much lower than the phosphate buffer with an initial value of 7.0. Although they have the same initial pH values, phosphate buffered better than citrate.
Figure 3. Effect of initial pH values on pH changing in fermentation broth
The composition of the final fermentation product depends on the conditions of the medium [Citation31]. There were four types of glucose metabolites in this hydrogen production process: ethanol, acetic acid, propionic acid, and n-butyric acid. Acetic acid was the main product with minimal production of ethanol and propionic acid. The characteristics of these organic compounds were greatly affected by the initial pH values, so the ratios of each compound were varied under different conditions. From , it can be seen that the contents of acetic acid had been unstable because the hydrogen production rates at different initial pH values were greatly different, there was no obvious rule of acetic acid concentration changes. The main factors affecting the acetic acid content were the environment of the fermentation broth, and acetic acid content was maintained at different levels. In the fermentation broth with the highest hydrogen production, the accumulation of acetic acid in the early stage caused the photosynthetic bacteria to reach the peak of hydrogen production in 48 h, and then the acetic acid content decreased and the hydrogen production rate gradually decreased too.
Figure 4. Effect of initial pH values on ethanol (a), acetic acid (b), propionic acid (c), and n-butyric acid (d) contents
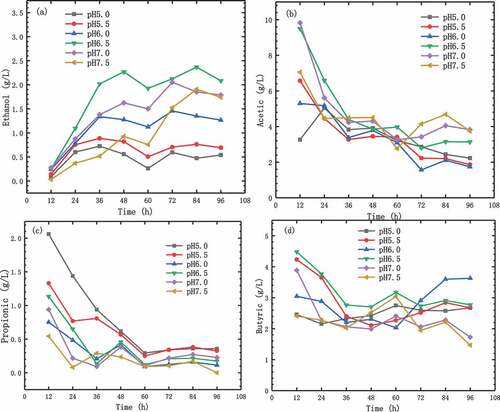
The reducing sugar was fermented into ethanol during the metabolism at first [Citation32]. The change process of ethanol content is shown in ). At 12 h, the contents of ethanol under different initial conditions were similar, which were 0.03–0.14 g/L. During the period of 12–48 h, the content of ethanol raised to 0.60–1.09 g/L. And the increases in ethanol were different in fermentation broths with different initial pH values.
The ethanol content in the fermentation broth with initial pH of 5.0, 5.5, and 6.0 increased significantly at 72 h, the values were 0.59, 0.70, 1.45, respectively. And then decreased slightly. The changes of propionic acid and n-butyric acid content are shown in ) and ). It can be seen from the figure that there was no obvious regular change in the contents of propionic acid and butyric acid. Among them, the contents of propionic acid decreased from 12 h to 60 h, and remained stable after an increase of 72 h, the final values were 0–0.36 g/L.
It is well known that hydrogen production is directly proportional to final metabolites such as acetic acid and butyric acid [Citation33]. However, the accumulation of ethanol had a negative effect on hydrogen production [Citation34]. Therefore, with the initial pH of 6.5, the content was higher. Photosynthetic bacteria had lower hydrogen production capacity, and the hydrogen production was less at pH value of 6.5 than that of 6.0.
4. Conclusion
Phosphates with different initial pH values were used as buffers to explore the effects of the fermentation broth pH values on the biohydrogen production via photo-fermentation. The results showed that the phosphate buffer worked better than citrate, and initial pH values had a significant effect on biohydrogen production. When the initial pH value of the phosphate buffer was 6.0, the maximum hydrogen production reached 569.6 mL. When the phosphate buffer initial pH value was 6.5, the hydrogen production rate reached a maximum value of 23.96 mL/h. With the initial pH value higher than 6.0, the alkaline environment would inhibit the hydrogen production ability of photosynthetic bacteria. The results provided a scientific reference for improving the theory and technology of photo-fermentation biological hydrogen production.
Highlights
Cornstalk pith was used for photo-fermentative hydrogen production.
Effects of buffer pH values on photo-fermentation hydrogen production were studied.
Optimal initial phosphate pH value for photo-fermentation was found to be 6.0.
Disclosure Statement
No potential conflict of interest was reported by the authors.
Additional information
Funding
References
- Show KY, Lee DJ, Tay JH, et al. Biohydrogen production: current perspectives and the way forward. Int J Hydrogen Energy. 2012 Oct;37(20):15616–15631.
- Srivastava N, Srivastava M, Malhotra BD, et al. Nanoengineered cellulosic biohydrogen production via dark fermentation: A novel approach. Biotechnol Adv. 2019;37(6):107384.
- Soares JF, Confortin TC, Todero I, et al. Dark fermentative biohydrogen production from lignocellulosic biomass: technological challenges and future prospects. Renew Sust Energ Rev. 2020;117:109484.
- Zhang Q, Wang Y, Zhang Z, et al. Photo-fermentative hydrogen production from crop residue: A mini review. Bioresour Technol. 2017;229:222–230.
- Zhang Z, Yue J, Zhou X, et al. Photo-fermentative bio-hydrogen production from agricultural residue enzymatic hydrolyzate and the enzyme reuse. BioResources. 2014;9(2):2299–2310.
- Jiang D, Zhang Q, Han B, et al. Analysis of physiological characteristics and hydrogen production characteristics of HAU-M1 photosynthetic hydrogen-producing bacteria. J Sol Energy. 2015;36:289–294.
- Zagrodnik R, Laniecki M. The role of pH control on biohydrogen production by single stage hybrid dark- and photo-fermentation. Bioresour Technol. 2015 Oct;194:187–195.
- Lu C, Zhang Z, Ge X, et al. “Bio-hydrogen production from apple waste by photosynthetic bacteria HAU-M1,”. Int J Hydrogen Energy. 2016;41(31):13399–13407.
- Liu H, Zhang Z, Zhang Q, et al. Optimization of photo fermentation in corn stalk through phosphate additive. Bioresour Technol Rep. 2019;7:100278.
- Li Y, Hong C, Wei H, et al. Biohydrogen baeterium R3 sp. nov. effect and regulation of fermentation hydrogen production performance. Heilongjiang Sci. 2011;863:1–6.
- Wang J, Wang J. Effect of buffer system on biological hydrogen production by anaerobic fermentation. J Environ Sci. 2008;28(6):1136–1140.
- Lin C-Y. Effects of carbonate and phosphate concentrations on hydrogen production using anaerobic sewage sludge microflora. Int J Hydrogen Energy. 2004;29(3):275–281.
- Zhang Q, Liu H, Hu J, et al. Effects of phosphate and carbonate on hydrogen production by photofermentation of straw biomass. J Agric Eng. 2017;33:251–257.
- Jiang D, Zhang Y, Lu C, et al. Dynamics of biomass straw enzymolysis and photosynthetic characteristics of biological hydrogen production. Nongye Jixie Xuebao/Trans Chin Soc Agric Mach. 2015;46(5):196–201.
- Jiang D, Ge X, Zhang T, et al. Photo-fermentative hydrogen production from enzymatic hydrolysate of corn stalk pith with a photosynthetic consortium. Int J Hydrogen Energy. 2016 Oct;41(38):16778–16785.
- Lu C, Wang Y, Lee D-J, et al. Biohydrogen production in pilot-scale fermenter: effects of hydraulic retention time and substrate concentration. J Clean Prod. 2019;229:751–760.
- Zhou J, Huang Y, Xu J, et al. Preparation of reference materials for mixed phosphate pH solution. Chem Reagent. 2019;41:469–474.
- Zhu S, Zhang Z, Li Y, et al. Analysis of shaking effect on photo-fermentative hydrogen production under different concentrations of corn stover powder. Int J Hydrogen Energy. 2018;43(45):20465–20473.
- Wang J, Nie G, Li S, et al. Determination of optimum wavelength in DNS method for determination of reducing sugar content. Henan Agric Sci. 2010;39(4):115–118.
- Budiman PM, Wu TY. Ultrasonication pre-treatment of combined effluents from palm oil, pulp and paper mills for improving photofermentative biohydrogen production. Energy Convers Manag. 2016 Jul;119:142–150.
- Lu C, Zhang H, Zhang Q, et al. Optimization of biohydrogen production from cornstalk through surface response methodology. J Biobased MaterBioenergy. 2019 Dec;13(6):830–839.
- Cai J, Zhao Y, Fan J, et al. Photosynthetic bacteria improved hydrogen yield of combined dark- and photo-fermentation. J Biotechnol. 2019;302:18–25.
- Tao Y, He Y, Wu Y, et al. Characteristics of a new photosynthetic bacterial strain for hydrogen production and its application in wastewater treatment. Int J Hydrogen Energy. 2008;33(3):963–973.
- Lu C, Jing Y, Zhang H, et al. Biohydrogen production through active saccharification and photo-fermentation from alfalfa. Bioresour Technol. 2020;304:123007.
- Zheng T, Yu H, Liu S, et al. Achieving high ethanol yield by co-feeding corncob residues and tea-seed cake at high-solids simultaneous saccharification and fermentation. Renewable Energy. 2020 Jan;145:858–866.
- Zhang Z, Wang Y, Hu J, et al. Influence of mixing method and hydraulic retention time on hydrogen production through photo-fermentation with mixed strains. Int J Hydrogen Energy. 2015;40(20):6521–6529.
- Dareioti MA, Vavouraki AI, Kornaros M. Effect of pH on the anaerobic acidogenesis of agroindustrial wastewaters for maximization of bio-hydrogen production: A lab-scale evaluation using batch tests. Bioresour Technol. 2014;162:218–227.
- Zhang Y, Shen J. Effect of temperature and iron concentration on the growth and hydrogen production of mixed bacteria. Int J Hydrogen Energy. 2006;31(4):441–446.
- Yi W, Xuehua Z, Chaoyang L, et al. Screening and optimization of mixed culture of photosynthetic bacteria and its characteristics of hydrogen production using cattle manure wastewater. J Biobased MaterBioenergy. 2015 Feb;9(1):82–87.
- Lu C, Zhang H, Zhang Q, et al. An automated control system for pilot-scale biohydrogen production: design, operation and validation. Int J Hydrogen Energy. 2020 Feb;45(6):3795–3806.
- Levin DB, Pitt L, Love M. Biohydrogen production: prospects and limitations to practical application. Int J Hydrogen Energy. 2004;29(2):173–185.
- Lu C, Zhang Z, Zhou X, et al. Effect of substrate concentration on hydrogen production by photo-fermentation in the pilot-scale baffled bioreactor. Bioresour Technol. 2018;247:1173–1176.
- Nasr N, Gupta M, Elbeshbishy E, et al. Biohydrogen production from pretreated corn cobs. Int J Hydrogen Energy. 2014;39(35):19921–19927.
- Abe JO, Popoola API, Ajenifuja E, et al. Hydrogen energy, economy and storage: review and recommendation. Int J Hydrogen Energy. 2019;44(29):15072–15086.