
 ?Mathematical formulae have been encoded as MathML and are displayed in this HTML version using MathJax in order to improve their display. Uncheck the box to turn MathJax off. This feature requires Javascript. Click on a formula to zoom.
ABSTRACT
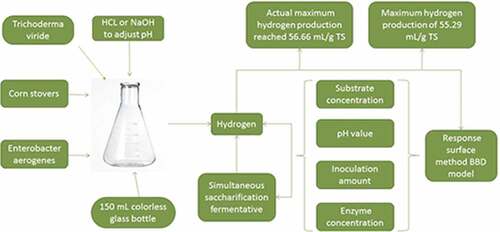
Corn stovers are rich in carbohydrates and can be used by anaerobic bacteria to produce hydrogen by fermentation. In the present study, using hydrogen production as the main experimental index, the effect of different influential factors on hydrogen production from corn stover saccharification and fermentation was studied, using the response surface method BBD model. The significance of interactions between different influential factors on hydrogen production by simultaneous saccharification and fermentation of corn stover material were investigated and optimized. Results showed that there were several factors affecting simultaneous saccharification fermentative hydrogen production from corn stover, including substrate concentration, inoculation amount, pH value and enzyme concentration. In linear terms, substrate concentration had the greatest influence on hydrogen production by anaerobic simultaneous saccharification and fermentation. In terms of multi-factor interactions, the interaction between pH and enzyme concentration was the most significant. The optimal hydrogen production conditions established from the BBD model were as follows: substrate concentration of 25 mg/mL, inoculation amount proportion of 32.62%, initial pH value of 6.50 and enzyme concentration of 172.08 mg/g, resulting in the maximum hydrogen production of 55.29 mL/g TS. The actual maximum hydrogen production reached 56.66 mL/g TS, with these experimental results consistent with the predicted value established from equation fitting. This study provides a reference for hydrogen production by anaerobic synchronous saccharification fermentation using corn stover as substrate and lays a foundation and provides technical support for the industrialization of biological hydrogen production using corn stover as substrate.
Graphical abstract
1. Introduction
Energy is the foundation of human survival and development. However, due to large-scale development and utilization of fossil energy, serious global energy shortages, resource exhaustion and environmental deterioration have been induced. The greenhouse effect caused by a large amount of CO2 emissions has resulted in an increase in extreme weather events and global warming [Citation1]. These factors have resulted in the need to develop clean renewable energy sources. Hydrogen energy has received a lot of attention recently, due to its high calorific value (122 kJ/g) and clean waste production, with only water produced during combustion [Citation2–Citation4]. The production methods of hydrogen energy mainly include hydrogen production from electrolyzed water, hydrogen production from fossil fuels, and hydrogen production from biological processes. Compared with the other two hydrogen production methods, biological hydrogen production is a better hydrogen production method, because biological hydrogen production can be performed at normal temperature and pressure, low energy input, high efficiency, and biological hydrogen production is green and environmentally friendly [Citation5–Citation11]. Biological hydrogen production can use a wide range of substrates, such as glucose, xylose, kitchen waste and agricultural waste [Citation12–Citation14]. Biohydrogen production methods mainly include dark fermentation hydrogen production and photo-fermentation hydrogen production [Citation15,Citation16]. Compared with photo-fermentation, dark fermentation has higher hydrogen production rate, shorter reaction cycle [Citation17,Citation18] and the reaction device and main process are relatively simple. Although the source of the substrate and process equipment for dark fermentation are simple; however, the current cost of hydrogen production is relatively high, which limits the development of dark fermentation biological hydrogen production [Citation19].
Crop stalk is a kind of biomass resource existing in China, the annual crop stalks can reach about 0.5 billion tons, corn stovers accounted for 33% in 2016 [Citation20]. The common domestic use methods are composting, open burning or biogas production and forming fuels [Citation21–Citation23]. Since the corn stover contains a large amount of cellulose, hemicellulose and lignin, the pretreatment of the corn stover for dark fermentation biological hydrogen production not only reduces the cost of biological hydrogen production, but also expands the source of biological hydrogen production raw materials, which is a promising way of hydrogen production. At present, there are few studies on the dark fermentation of hydrogen from corn stover-based biomass, mainly focusing on the factors affecting hydrogen production and the pretreatment methods of biomass microorganisms. Jiang Danping’s research shows that fungal pretreatment has a better effect on increasing reducing sugar concentration [Citation24]. Jing Yanyan’s research shows that the ultra-pulverization technology of corn stover can improve the hydrogen production capacity of photosynthetic bacteria [Citation25]. Therefore, the use of corn stover in dark fermentation biohydrogen production needs further research.
The use of corn stover for hydrogen production fermentation can mainly be divided into three stages: pretreatment, enzyme hydrolysis and fermentation. The enzymatic hydrolysis process converts cellulose into reducing sugar, followed by fermentation by separate hydrolysis and fermentation (SHF) to produce hydrogen. However, the enzymatic hydrolysis process and the fermentation process can be carried out simultaneously in a reactor, via a process called simultaneous saccharification fermentation (SSF). However, simultaneous saccharification fermentation for the production of hydrogen is mainly used in ethanol and lactic acid fermentation [Citation26]. The effect of dry fermentation on simultaneous glycosylated ethanol fermentation has been studied [Citation27], as well as simultaneous glycosylated ethanol fermentation using cellulose as a substrate [Citation28]. The conditions of synchronous saccharification fermentation for hydrogen production by photosynthetic bacteria have been optimized, although there is little information available on the application of synchronous saccharification fermentation technology in dark fermentation.
Compared with step-by-step saccharification and fermentation, hydrogen production by simultaneous saccharification and fermentation has various advantages. For example, the number of reactors required is reduced, the reaction cycle is shortened, the inhibition effect of hydrolysis products on fermentation is weakened and operational costs are reduced. Different fermentation processes have different reaction condition requirements. In order to obtain the best hydrogen production effect, this study used the BBD model to optimize the process of dark fermentation synchronous saccharification hydrogen production based on single factor optimization in the early stage.
2. Materials and methods
2.1. Raw materials
The experimental material was collected from the experimental field of the Zhengzhou Science and Education Park, which were naturally dried and pulverized, the passed through a 60 mesh (0.3 mm) sample sieve, sealed and stored for later use. The composition and content of lignocellulose and its main elements are shown in .
Table 1. Composition of the corn straw raw material
2.2. Microorganisms and media
The dark fermentation bacteria are as Enterobacter aerogenes. Enterobacter aerogenes is a gram-negative bacillus. It was provided by the key laboratory of new materials and facilities for rural renewable energy. It is facultatively anaerobic and insensitive to light. They were cultured in a 150 mL colorless glass bottle at a temperature of 35°C, without light, without oxygen, and inoculated in aseptic conditions. Logarithmic bacteria were used as inoculants for further experiments. The growth medium and hydrogen production medium was composed of soy peptone (5 g•L−1), tryptone (15 g•L−1) and NaCl (5 g•L−1) [Citation29].
2.3. Experimental design
All experiments were carried out in 150 mL reaction bottles, which were purged with nitrogen for 5 min to create an anaerobic environment. Cellulase was treated with Trichoderma viride (enzyme activity 35 u/mg) and the pH was regulated with 5 mol/L HCl or NaOH.
According to the univariate an analysis established in previous experiments, the experimental design levels were: substrate concentrations of 5, 15 and 25 mg/mL, enzyme concentrations of 100, 150 and 200 mg/g (w/w), inoculum amount of 20, 30 and 40% (v/v) and pH values of 6, 6.5 and 7 [Citation30]. The experimental variables are shown in . The 29 experiments and 4 variable BBD experimental designs and software design are presented in . At the same time, three groups were used as the control group. Each group was sampled 3 times and the mean value was taken as the experimental value.
Table 2. Variables of the response surface
Table 3. Box-Behnken experimental design using four independent variables
Hydrogen yield was taken as the response (Y). Regression analysis was performed on all obtained data, resulting in an empirical model that related the measured response to the independent experimental variables. The model equation is represented as shown in EquationEquation (1)(1)
(1) :
where Y is the predicted response, C0 is the intercept, Ci is the linear coefficient, and Cij is the interaction coefficient. Analysis of variance (ANOVA) was performed and three-dimensional response surface curves were plotted using by Design Expert 8.0 software to study the interaction among these factors [Citation31].
2.4. Analytical method
Hydrogen content: A gas chromatograph (6820 gc-14 b Agilent) was used for determination. The packing of the column was 5A molecular sieve, using nitrogen as a carrier gas at a flow rate of 45 mL/min and 99.999% high purity hydrogen was used as the standard gas. Chromatographic conditions included an inlet temperature 100 °C, column temperature of 800°C, TCD detector temperature of 150°C, sample volume of 500 uL and retention time 2 min.
pH measurements were performed using a PHS-3 C type pH meter (Shanghai Yidian Scientific Instrument Co, Ltd.), at a measurement range of 0.00–14.00 and a resolution of 0.01.
3. Results and analysis
Box-Behnken experimental design is a method used to find the optimal process parameters through analysis of regression equations. The experimental results are shown in .
By applying multiple regression analysis to the experimental data, the following second-order polynomial equations were obtained to describe the hydrogen yield as a function of the variables, as described in EquationEquation (2)(2)
(2) for coded values and EquationEquation (3)
(3)
(3) for actual experimental values, established by measuring the actual experimental conditions according to the Box-Behnken model [Citation32]:
Table 4 shows the variance analysis of the BBD model, with the lack-of-fit of the model being 0.3101, which is greater than 0.05, indicating that the lack-of-fit is not significant and that the model is appropriate. The determination coefficient R2 of the fitted model is an evaluation index, reflecting the degree of fitting of the regression equation to the data, with a larger R2 indicating a larger proportion of the total variation of the dependent variable is described by the regression equation and the better the fitting effect. Results show that the R2 of this regression equation was 0.9519, indicating that the predicted value and the measured value fit well within the test range [Citation33]; the model’s correction factor adjusted R2 is 0.9039, indicating that this model can explain 90.39% of the response value change. The variation coefficient CV is the degree of variation between treatment groups at different levels, with the model CV of 6.73%, indicating that the test had good repeatability.
Table 4. ANOVA of the model
A factor p-value of <0.05 indicates that the factor has a significant impact on the model. In linear terms, the substrate concentration (X1), inoculation amount (X2), pH (X3) and enzyme concentration (X4), all significantly affected Enterobacter synchronous saccharification hydrogen production (p-value < 0.05). In terms of the quadratic model, the substrate concentration and the quantity of inoculation amount significantly affected hydrogen production (X1X2), while reaction time, pH and enzyme concentration also had a significant effect (X3 X4). The maximum predicted hydrogen production yield under optimized conditions experiment was 55.29 mL/g TS. The optimal reaction conditions include were substrate concentration of 25 mg/mL, inoculation amount of 32.62% of pH 6.5 and enzyme concentration of 172.08 mg/g. The hydrogen production yield obtained under these optimal experimental conditions was 56.66 mL/g TS, showing close similarity to the modeled data.
The response surface diagram of the model is a useful visualization. The response surface diagram is a reproduction of the regression equation and can predict the response values of different variables [Citation34]. Observe the relationship between the dependent and independent variables, maintaining one factor as constant, while the other two factors are varied within a certain range. Three-dimensional response surface and contour maps were used to determine the interaction between fermentation conditions and optimal reaction conditions for hydrogen production in synchronous saccharification fermentation. The color and shape of the contour line can determine the significance of the variable and the interaction between variables, with larger color changes and gradients indicating a greater impact on the experiment, an elliptical contour, indicating a strong mutual effect, while a circular contour indicates no interaction [Citation35–Citation38].
shows the three-dimensional response surface diagram and contour diagram of the effects of hydrogen yield on the hydrogen production in synchronous saccharification fermentation as a function of substrate concentration, inoculum, pH, and enzyme concentration. The response surface model was obtained with the BBD model using the data shown in .
Figure 1. Three-dimensional surface plot and Contour plot for hydrogen yield. The response surface model was obtained by the BBD with the date shown in . (a) the effect of substrate concentration, inoculation amount and their mutual interaction on hydrogen yield; (b) the effect of substrate concentration, initial pH and their mutual interaction on hydrogen yield; (c) the effect of substrate concentration, enzyme concentration and their mutual interaction on 1hydrogen yield. (d) the effect of inoculation amount, initial pH and their mutual interaction on hydrogen yield. (e) the effect of inoculation amount, enzyme concentration and their mutual interaction on hydrogen yield. (f) the effect of initial pH, enzyme concentration and their mutual interaction on hydrogen yield
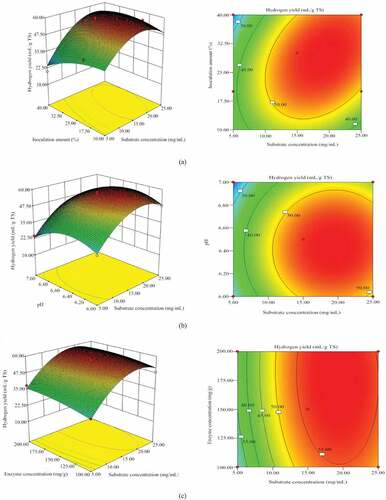
) shows the effect of substrate concentration, inoculation amount and their mutual interaction on hydrogen yield. When hydrogen production reached a peak value, continued increase in substrate concentration and inoculation amount led to hydrogen production decrease. When the substrate concentration was 25 mg/g and the inoculation amount was 32.62%, the hydrogen production reached the highest. This may be due to the increase of the inoculum amount, the energy consumed by microbial growth increased and less hydrogen is released. At the same time, the amount of microorganisms increased, and therefore, the amount of corresponding metabolites increased, with the accumulation of metabolites causing hydrogen production to be inhibited. Excessive substrate concentrations will cause acidification of the reaction solution, affecting the activities of dehydrogenases such as coenzymes, ferric redox proteins and flavin proteins in microorganisms.35 The contour line is an oval shape, indicating that the interaction between substrate concentration and inoculation amount had a significant impact on hydrogen production in synchronous saccharification fermentation, with these results supported by the ANVOA results (p = 0.0113).
) shows the effect of substrate concentration, initial pH and their mutual interaction on hydrogen yield. Optimum design boundary pH was 6.5 and substrate concentration was 25 mg/g. According to the results of contour and variance analysis (p = 0.7507 > 0.05), there were no significant interactions between the two. However, the concentration could affect the pH of fermentation process, with the increase of substrate concentration, much more volatile acids were produced as by-product resulted in pH decreasing.
) shows the effect of substrate concentration, enzyme concentration and their mutual interaction on hydrogen yield. It can be seen from ) that when the substrate concentration reaches a certain value, increasing the amount of enzyme concentration showed no significant effect on hydrogen production. This may be because there were a limited number of enzyme adsorption points available on corn stover cellulose and when these adsorption points were adsorbed, excess enzyme dissociates in the fermentation broth and could not induce further enzymatic hydrolysis. When the amount of enzyme concentration remains constant, with increased substrate concentration, the amount of hydrogen produced increases initially and then decreases. The highest hydrogen production occurred at an enzyme concentration of 172.08 mg/g and substrate concentration of 25 mg/g. It can be seen from the three-dimensional response surface diagram that hydrogen production was more sensitive to changes in substrate concentration than changes in enzyme concentration, because the slope of hydrogen production on the substrate concentration axis is steeper than the enzyme concentration axis. From the analysis of variance (p = 0.7507 > 0.05), the interaction between enzyme concentration and substrate concentration was not found to be significant.
shows the effect of inoculation amount, initial pH and their mutual interaction on)hydrogen yield, Optimum design boundary inoculation amount was 32.62% and pH was 6.50. The analysis of variance indicating that the interaction between the two is not obvious (p = 0.0965), similar results also observed between the inoculum amount and enzyme concentration (p = 0.8736) ()). This phenomenon may be due to substrate concentration dominating the fermentation process and acting as the limiting step, with all other effects limited by substrate concentration. At the same time, Enterobacter aerogenes had certain acid resistance, which may directly affect the pH of the culture medium to maintain suitable fermentation conditions [Citation39].
Figure 1. (Contined)
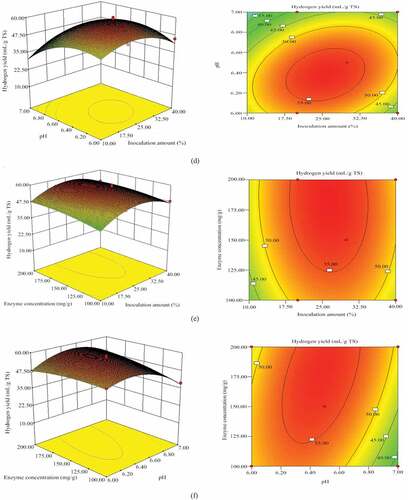
) shows the effect of initial pH, enzyme concentration and their mutual interaction on hydrogen yield. It could be seen from the surface diagram that there was a strong interaction between the two, its outline was oval, and the p-value of the analysis of variance was 0.0397 (p < 0.05). The surface diagram (1 f) also shows that hydrogen production was more sensitive to changes in pH compared to changes in enzyme concentration. Results show that when the enzyme concentration remains constant and the pH increases, hydrogen production increases initially and then decreases rapidly. Because pH directly affects the activity of cellulose, the activity of cellulose is lower under neutral conditions, with optimal reaction rates occurring at pH were 6.5, enzyme concentration was 172.08 mg/g.
As shown in , the significant peaks in the surface plots for specific hydrogen yield and the maximal point of the corresponding contour plots indicate that the maximum specific hydrogen yield could be obtained within the experimental design range. A maximum yield of 55.29 mL/g TS was predicted under the optimal conditions of a substrate concentration of 25.00 mg/mL, initial inoculum proportion of 32.62% (v/v), initial pH of 6.50, temperature of 35.59°C and enzyme concentration of 172.08 mg/g. The maximum experimental result for hydrogen yield of 56.66 mL/g TS was higher than many previous studies, Zhang et al. used corn stover hydrolyzate as substrate for hydrogen production experiments, and the maximum hydrogen yield of 46.77 mL/g TS [Citation29]. Sun et al. used corn stover as substrate to conduct dark fermentation biological hydrogen production and found the maximum hydrogen yield was 54.94 mL/g [Citation40]. Lu et al. used response surface methodology BBD model to study the effect of different influencing factors on photosynthetic hydrogen production from biomass straw, and the maximum hydrogen yield of 31.11 mL/g was obtained [Citation41].
Conclusions
The feasibility of hydrogen production from corn stover was analyzed. Enterobacter aerogenes was suitable for the dark fermentation hydrogen production from corn stover. The response surface method was used to optimize hydrogen production from corn stover by synchronous saccharification fermentation. Through model analysis, it was found that substrate concentration, inoculum amount, pH value and enzyme concentration had significant effects on hydrogen production by simultaneous saccharification and fermentation, and the interaction between pH value and enzyme concentration showed significant. The model results showed that the optimal conditions for dark fermentation hydrogen production from corn stover by simultaneous saccharification and fermentation was substrate concentration of 25 mg/g, inoculum proportion of 32.62%, initial pH of 6.50 and enzyme concentration of 172.08 mg/g, generating a hydrogen yield of 55.29 mL/g TS, with the actual maximum hydrogen production reaching 56.66 mL/g TS. These experimental results were overall consistent with the predicted values based on equation fitting, indicating that the model is reasonably suitable.
Highlights
The dark fermentation hydrogen production was optimized by using the response surface method.
The interaction between pH and enzyme concentration had a large effect on hydrogen production.
The maximum hydrogen production yield was obtained by BBD model.
Disclosure statement
No potential conflict of interest was reported by the authors.
Additional information
Funding
References
- Ajmi AN, Hammoudeh S, Nguyen DK, et al. On the relationships between CO2 emissions, energy consumption and income: the importance of time variation. Energy Econ [Internet] 2015; 49:629–638. Available from: http://www.sciencedirect.com/science/article/pii/S0140988315000444.
- Hosseini SE, Abdul Wahid M, Jamil MM, et al. A review on biomass-based hydrogen production for renewable energy supply. Int J Energy Res [Internet] 2015; 39:1597–1615. Available from: https://onlinelibrary.wiley.com/doi/abs/10.1002/er.3381
- Nicoletti G, Arcuri N, Nicoletti G, et al. A technical and environmental comparison between hydrogen and some fossil fuels. Energy Convers Manag [Internet] 2015; 89:205–213. Available from: http://www.sciencedirect.com/science/article/pii/S0196890414008589.
- Hallenbeck PC, Liu Y. Recent advances in hydrogen production by photosynthetic bacteria. Int J Hydrogen Energy [Internet] 2016; 41:4446–4454. Available from: http://www.sciencedirect.com/science/article/pii/S0360319915026920.
- Kalinci Y, Hepbasli A, Dincer I. Biomass-based hydrogen production: A review and analysis. Int J Hydrogen Energy [Internet] 2009; 34:8799–8817. Available from: http://www.sciencedirect.com/science/article/pii/S0360319909013391.
- Mathews J, Wang G. Metabolic pathway engineering for enhanced biohydrogen production. Int J Hydrogen Energy [Internet] 2009; 34:7404–7416.
- Li Y, Zhang Z, Jing Y, et al. Statistical optimization of simultaneous saccharification fermentative hydrogen production from Platanus orientalis leaves by photosynthetic bacteria HAU-M1. Int J Hydrogen Energy Internet] 2017; 42:5804–5811.
- Azwar MY, Hussain MA, Abdul-Wahab AK. Development of biohydrogen production by photobiological, fermentation and electrochemical processes: A review. Renewable Sustainable Energy Rev [Internet] 2014; 31:158–173.
- Lin CY, Chiang CC, Thi Nguyen ML, et al. Enhancement of fermentative biohydrogen production from textile desizing wastewater via coagulation-pretreatment. Int J Hydrogen Energy Internet] 2017; 42:12153–12158.
- Sargsyan H, Gabrielyan L, Hakobyan L, et al. Light-dark duration alternation effects on Rhodobacter sphaeroides growth, membrane properties and bio-hydrogen production in batch culture. Int J Hydrogen Energy [Internet] 2015; 40:4084–4091.
- López Pérez PA, Neria-González MI, Aguilar López R. Increasing the bio-hydrogen production in a continuous bioreactor via nonlinear feedback controller. Int J Hydrogen Energy. 2015;40:17224–17230.
- Khan MA, Ngo HH, Guo WS, et al. Optimization of process parameters for production of volatile fatty acid, biohydrogen and methane from anaerobic digestion. Bioresour Technol. 2016;219:738–748.
- Zhi Z, Wang H. White-rot fungal pretreatment of wheat straw with Phanerochaete chrysosporium for biohydrogen production: simultaneous saccharification and fermentation. Bioprocess Biosyst Eng. 2014;37:1447–1458.
- Jiang D, Ge X, Zhang T, et al. Photo-fermentative hydrogen production from enzymatic hydrolysate of corn stalk pith with a photosynthetic consortium. Int J Hydrogen Energy [Internet] 2016; 41:16778–16785.
- Wang J, Wan W. Effect of Fe2 + concentration on fermentative hydrogen production by mixed cultures. Int J Hydrogen Energy. 2008;33:1215–1220.
- Wang J, Wan W. Comparison of different pretreatment methods for enriching hydrogen-producing bacteria from digested sludge. Int J Hydrogen Energy [Internet] 2008; 33:2934–2941. Available from: http://www.sciencedirect.com/science/article/pii/S0360319908003649.
- Li D, Jiao C, He W, et al. Comparison of micro-aerobic and anaerobic fermentative hydrogen production from corn straw. Int J Hydrogen Energy [Internet] 2016; 41:5456–5464.
- Nasirian N, Almassi M, Minaei S, et al. Development of a method for biohydrogen production from wheat straw by dark fermentation. Int J Hydrogen Energy [Internet] 2011; 36:411–420.
- Saleem M, Lavagnolo MC, Spagni A. Biological hydrogen production via dark fermentation by using a side-stream dynamic membrane bioreactor: effect of substrate concentration. Chem Eng J [Internet] 2018; 349:719–727.
- Lee DJ, Wang Y, Zhang Z, et al. Photo-fermentative hydrogen production from crop residue: A mini review. Bioresour Technol Internet] 2017; 229:222–230.
- Wang Q, Zhao W, Liu H, et al. Interactions and kinetic analysis of oil shale semi-coke with cornstalk during co-combustion. Appl Energy [Internet] 2011;88:2080–2087.
- Deng D, Duan XX, Lu JJ, et al. Electrogenerated alkaline hydrogen peroxide for rice straw pretreatment to enhance enzymatic hydrolysis. Bioresour Technol [Internet] 2019; 292:122077.
- Kainthola J, Kalamdhad AS, Goud VV. Optimization of process parameters for accelerated methane yield from anaerobic co-digestion of rice straw and food waste. Renew Energy [Internet]. 2019. DOI:10.1016/j.renene.2019.10.124
- Jiang D. Technology of microbial pretreatment of straw which used for photosynthetic hydrogen production. 2013.
- Jing Y, Li D, Luo X, et al. Study on settlement stability and hydrogen production capability of ultra-micro corn straw. Acta Energiae Solaris Sin. 2014;35:960–964.
- Liu G, Zhang Q, Li H, et al. Dry biorefining maximizes the potentials of simultaneous saccharification and co-fermentation for cellulosic ethanol production. Biotechnol Bioeng. 2018;115:60–69.
- Merskey H. Communications to the editor. J Psychosom Res. 1983;27:85.
- Li Y, Zhang Z, Jing Y, et al. Statistical optimization of simultaneous saccharification fermentative hydrogen production from Platanus orientalis leaves by photosynthetic bacteria HAU-M1. Int J Hydrogen Energy [Internet] 2017; 42:5804–5811. Available from: http://www.sciencedirect.com/science/article/pii/S0360319916335157.
- Zhang Q, Zhang T, Zhang Z, et al. Experiment on hydrogen production by photosynthetic bacteria and Enterobacter aerogenes combined fermentation. Trans Chin Soc Agric Eng. 2017;33:243–249.
- Zhang Z, Zhou X, Yue J, et al. Experimental study on enzymatic pretreatment process of ultrafine corn cob powder. Atca Energiae Solaris Sin. 2013;34:1536–1541.
- Lu C, Zhang Z, Ge X, et al. Bio-hydrogen production from apple waste by photosynthetic bacteria HAU-M1. Int J Hydrogen Energy Internet] 2016; 41:13399–13407.
- Ghosh D, Sobro IF, Hallenbeck PC. Optimization of the hydrogen yield from single-stage photofermentation of glucose by Rhodobacter capsulatus JP91 using response surface methodology. Bioresour Technol [Internet] 2012; 123:199–206.
- Wang Z, Quan Y, Zhou F. Optimization of medium composition for exopolysaccharide production by Phellinus nigricans. Carbohydr Polym Internet] 2014; 105:200–206.
- Choi JM, Han SK, Kim JT, et al. Optimization of combined (acid + thermal) pretreatment for enhanced dark fermentative H2 production from Chlorella vulgaris using response surface methodology. Int Biodeterior Biodegrad [Internet] 2016; 108:191–197.
- Açıkel Ü, Erşan M, Sağ Açıkel Y. Optimization of critical medium components using response surface methodology for lipase production by Rhizopus delemar. Food Bioprod Process [Internet] 2010; 88:31–39. Available from: http://www.sciencedirect.com/science/article/pii/S0960308509000704.
- Androga DD, Sevinç P, Koku H, et al. Optimization of temperature and light intensity for improved photofermentative hydrogen production using Rhodobacter capsulatus DSM 1710. Int J Hydrogen Energy. 2014;39:2472–2480.
- Lu C, Wang Y, Lee DJ, et al. Biohydrogen production in pilot-scale fermenter: effects of hydraulic retention time and substrate concentration. J Clean Prod [Internet] 2019;229:751–760.
- Lu C, Zhang Z, Zhou X, et al. Effect of substrate concentration on hydrogen production by photo-fermentation in the pilot-scale baffled bioreactor. Bioresour Technol [Internet]2018;247:1173–1176.
- Zhang Q, He Y, Hu J, et al. Experimental study on hydrogen production by anaerobic fermentation of Enterobacter aerogenes. Trans Chin Soc Agric Mach. 2014;45:176–181.
- Sun T. The process optimization and equipment research of dark fermentation biological hydrogen production process. 2016. DOI:10.2116/analsci.32.1267
- Lu C, Wang Y, Jing Y, et al. Experimental study on optimization of hydrogen production from photosynthetic biomass of corn straw based on BBD model. Acta Energiae Solaris Sin. 2014;35:1511–1516.