
 ?Mathematical formulae have been encoded as MathML and are displayed in this HTML version using MathJax in order to improve their display. Uncheck the box to turn MathJax off. This feature requires Javascript. Click on a formula to zoom.
ABSTRACT
This study investigates the optimized condition for enhancing biogas production in the anaerobic digestion of fallen poplar leaves. Two experiments were conducted: (1) The calcium hydroxide concentration, bacteria concentration, and composting time were used as three parameters to optimize the fermentation pretreatment condition and contrasting tests were performed; and (2) a series of fermentation tests were conducted to explore the best process parameters and biogas production characteristics. The results showed that a biological and chemical combined pretreatment effectively improved the biogas productivity of poplar leaves as fermentation substrates, and the parameter that had the greatest effect during anaerobic digestion was temperature followed by the solid concentration and pH value. The optimal pretreatment condition was: alkali concentration 4.61%, bacterial concentration 0.20‰, and a composting time of 6.6 days. By considering the factors that affect the fermentation of poplar leaves and the cumulative gas production, the optimum condition for poplar leave digestion was found to be a temperature of 30°C, a pH of 7, and a 10% solid concentration. In addition, the methane yield of the optimized trial was well fitted using the modified Gompertz model.
Graphical abstract
1. Introduction
Due to the acceleration of urbanization, municipal solid waste (MSW) contributes significantly to problems related to energy shortages and environmental pollution. Therefore, this waste needs to be properly utilized [Citation1,Citation2]. Biofuel production is a promising way to sustainably manage the organic fraction of MSW. The production of biofuel consists of a microbiological degradation process that occurs at a certain temperature, pH value, and under anaerobic conditions [Citation3–Citation9]. Biogas production is the most highly suggested solution for the MSW pollution problem because the organic portion of MSW is rich and economic. For this reason, several studies have examined the potential of biogas generation from urban solid waste [Citation10–Citation13].
According to the 25th International Poplar Commission (IPC)-session, China has the second largest poplar planted area of 8.5 million ha, which is 27% of the total global poplar planted area [Citation14]. Most of poplars are used as shelter forests and product forests in northwest China, and they are also planted as roadside trees in northern Chinese cities [Citation14,Citation15]. The estimated annual yield of fallen leaves for one city is approximately 30 kilo tons [Citation16]. Poplar leaves are abundant and widely available, hence they have been considered as a substrate for anaerobic fermentation. However, because they are a lignocellulosic biomass, poplar leaves also face the hydrolysis problem created by the complex three-dimensional structure of the polysaccharide and lignin [Citation17]. Compared with other substrates, co-digestion has not been shown to significantly improve the degradation of lignocellulosic materials [Citation18–Citation20]. Pretreatment is a promising solution to improve the biodegradability and reach a higher biogas production of lignocellulosic materials [Citation21]. Various studies have shown that chemically pretreated materials perform much better in biogas production [Citation22,Citation23]. Sodium hydroxide (NaOH) is the most common agent for alkaline pretreatment, which is superior for improving hydrolysis compared with calcium hydroxide (Ca(OH)2) [Citation24–Citation26]. A 33.3% increase in total methane production has been reported for 3.0% NaOH-treated poplar waste in four days with an 88% moisture content [Citation27], and a 113.8% increase in methane yield has been shown in 5% NaOH-treated poplar processing residues [Citation28]. The result of applying NaOH as pretreatment in poplar processing waste has been shown to be effective; however, the high concentration of sodium ions may inhibit the activity of methanogens. In addition, sodium ions in anaerobic discharge may also increase soil salinity, whereas calcium ions affect methanogens and the environment much less. This fact would make the choice of calcium hydroxide a good substitution for an alkaline pretreatment agent [Citation29–Citation31]. A recent study [Citation32] indicated that bio-pretreatment can change the chemical composition of materials significantly. Moreover, studies that have examined the effects of co-pretreatment by applying two or more pretreatment types have also been conducted. The influence of a CaO-LFD bio-chemical pretreatment on rice straw rose the methane yield to 57.56% [Citation33]. Ji reported a 61.54% increase in the methane yield for corn straw after co-pretreatment with calcium hydroxide and steam explosion [Citation34]. Therefore, two or more pretreatment methods combined can provide a more promising effect than a single pretreatment.
An investigation of poplar waste anaerobic digestion reported a total methane yield of 81.1 ml∙g-1 volatile solids (VS) by using a 3.0% NaOH pretreatment, and the maximal methane yield increased to 98.2 ml∙g-1 VS when the poplar waste was co-digested with high-pH cattle slurry [Citation27]. Another study showed a peak methane production of 271.9 ml∙g-1 VS using a 5.0% NaOH pretreatment [Citation28]. Another study showed that the biogas yield reached 321 ml∙g-1 VS for poplar leaf co-digestion with swine manure [Citation35]. However, few studies have investigated the anaerobic digestion characteristics of poplar leaf as the sole feedstock. In this study, the effect of combined pretreatment on the anaerobic digestion of poplar leaves as the sole substrate is conducted. The objective of the study is to: (1) to test the anaerobic digestion performance when poplar leaves are used as the sole substrate after combined pretreatment and (2) to determine the best combination of pretreatment condition parameters and the optimal condition for anaerobic digestion.
2. Experimental methods
2.1. Experimental material
Poplar leaves collected from the scientific and educational park of the Henan Agricultural University were used as raw materials for these fermentation experiments. After natural air-drying, the poplar leaves were milled in a ball-milling machine for later use. Ammonia chloride (NH4Cl) was added to adjust the carbon/nitrogen ratio (C/N) to 25 [Citation36]. The biogas slurry was removed during the final-stage fermentation from a normal biogas digester. The slurry had a 30% concentration of fermentation broth, and this was used as the inoculation after enrichment culturing. The experiments were conducted in Key Laboratory of Renewable Energy of Ministry of Agriculture, Henan Agricultural University, and they were completed in the summer of 2018.
2.2. Experimental apparatus
The fermentation equipment used in these experiments was made by the Key Laboratory of Renewable Energy of Ministry of Agriculture, Henan Agricultural University, China, which was based on the water displacement principle. The equipment consisted of a 2.5 L fermentation container where the leaves were digested and two 1 L bottles for the collection of the water and gas. The fermentation container was placed in a water bath that was temperature controlled using a digital thermostat controller (DFD-100, YuYao Eastern Electrical Equipment Co. Ltd., China). In addition, a 3000 rpm electric blender (JJ-3 H, Yuexin Yiqi Co. Ltd., China), and a digital display thermometer (DTSW, Taian Detu Automatic Equipment Co. Ltd., China) were fixed on the top of the container. A pH meter (PHS-II, Shanghai Shengzi Equipment, Co. Ltd., China) was used to monitor the changes in the pH value.
2.3. Experimental method and design
2.3.1. Pretreatment
Fermentation is a complicated process that can be affected by many factors, not only during the process, but even in the raw material preparation stage. The Box-Behnken Design (BBD) was used to investigate the influence of the alkali (calcium hydroxide) concentration, the bacterial concentration, and the composting time as the pretreatment operational parameters in three levels, as shown in . According to the design, 17 experimental trials were conducted with 5 replications of the center points (). The total biogas production was calculated as the response variable, which was the sum of the daily water discharge volume. In addition, the influence of the three parameters was evaluated using the statistical software of Design-Expert 8.0 (Stat Ease Inc. Minneapolis, USA) to acquire the optimal combination of pretreatment conditions that corresponded to the highest biogas production. Based on the experimental results, a second order polynomial model function was fitted to predict the optimal point. The regression model, which expresses the interaction among parameters that affect the response by changing them simultaneously, was generated using an analysis of variance (ANOVA). In addition, the coefficient of determination (R2) was used to describe the adequacy of the model [Citation37].
Table 1. Variables and levels of factors used in the experiments
Table 2. Real value of the variables and response variable
2.3.2. Fermentation
Batch experiments were conducted to produce biogas by anaerobic fermentation using poplar leaves pretreated with optimized pretreatment conditions, as stated in the previous section. The groups with pretreatment were: T1, T2, T3, T4, T5, T6, T7, T8, and T9, while the control groups without pretreatment were: U1, U2, U3, U4, U5, U6, U7, U8, and U9. The total solids concentrations (TS) of the fermentation broth, fermentation temperature, and pH value were evaluated as factors affecting the fermentation experiments. Temperature and pH value were adjusted prior to each experiment. The daily biogas production was measured using water displacement to explore changes in the biogas generation rate and the cumulative biogas production for each group [Citation38]. Based on the experimental results, the operational parameters for biogas production were analyzed to optimally control the fermentation process.
2.3.3. Kinetic model prediction
To more effectively evaluate the anaerobic digestion process, the Modified Gompertz model [Citation39] was chosen as the best model to describe the kinetics of methane production from fermentation, as shown in EquationEquation (1)(1)
(1) :
where P(t) is the cumulated methane production (ml∙g−1 VS) at a given time t (days); P is the methane production potential (ml∙g−1 VS); Rmax is the maximum methane production rate (ml∙d−1∙g−1 VS); is the Euler’s number; and λ is the lag phase time (days).
3. Results and analysis
3.1. Pretreatment optimization
3.1.1. Statistical analysis of the regression model
shows the matrix of the Box-Behnken design for pretreatment optimization. The volume of biogas produced was determined using the water displacement method. A response analysis was conducted to explore the relationship and interaction among the alkali concentration (A), the bacterial concentration (B), and the composting time (C). A second order polynomial equation was fitted to the experimental results using a multiple regression analysis. Thus, the equation generated based on the mathematical regression models in terms of coded factors is expressed as follows:
The equation in terms of actual factors eliminated insignificant (P > 0.05) combinations of factors (AC and B2) is expressed as follows:
Biogas Production=−1043.70833+8729.5625 (Alkali Concentration)– 97,315 (Bacterial Concentration) + 3801.375 (Composting Time) + 14,487.5 (Alkali Concentration*Bacterial Concentration)– 64 (Alkali Concentration*Composting Time) + 23,815 (Bacterial Concentration*Composting Time)– 1214.125 (Alkali Concentration2)– 1.047*105 (Bacterial Concentration2)– 622.16667 (Composting Time2). (3)
An analysis of variance (ANOVA) was performed in which the model fitness was evaluated using an F-test, as shown in . The ‘model F-value’ of 34.90 implies the model is significant, and there is only a 0.01% probability that the value of 34.90 could occur due to noise. However, the p-value of each model term indicates the significance of variables and combinations individually. After eliminating insignificant terms (P > 0.05) [Citation37] from the equation, a quadratic model was presented with the appearance of quadratic model terms and interactive model terms. The high value of the determination coefficient (R2) indicates the model fits well. Hence, R2adj and R2pred are both good signs of model fitting. This was also confirmed by a ‘lack of fit F-value’ of 0.22, which implies that the ‘lack of fit’ was not significant relative to the pure error. Moreover, the low value of the percentage of coefficient of variation (CV%) (5.56%) represents a high reliability of the experiments [Citation40]. Adequate precision is a signal to noise ratio, and a value greater than four represents an adequate signal. This means that the model can be used to navigate the design space.
Table 3. Analysis of variance (ANOVA) of the response surface quadratic model
3.1.2. Effect of interactions among pretreatment parameters
The three-dimensional response surface plots shown in were generated to illustrate the interaction of two variables, while keeping the third variable at the zero level. As shown in ), the interaction between the alkali concentration and the bacterial concentration had clear synergism. The maximum response occurred at the highest bacterial concentration and the central level of the alkali concentration (4.66%). Cellulose is primarily protected by lignin during anaerobic digestion [Citation21]. The addition of alkali improved the biodegradability of the leaves by removing lignin, and this resulted in an increase in biogas production. However, when the concentration of alkali exceeded a certain point, which in this case was 4.66%, the bacterial activity may have been inhibited due to the acidity-alkalinity of the fermentation. This would result in a decrease in biogas production. An upward trend in biogas production was found with an increase in the bacterial concentration. This was because the bacteria decomposed the macromolecular organics in the poplar leaves into small molecular sugars and acids, which improved the digestion process.
Figure 1. Response surface curves for biogas production as a function of alkali concentration and bacterial concentration. (a) Alkali concentration and composting time (b); and bacterial concentration and composting time (c)
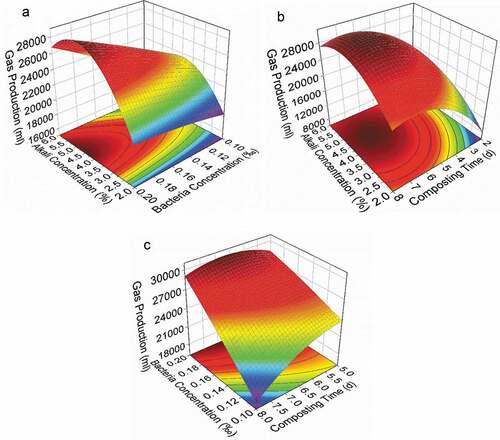
The response surface curves as a function of alkali concentration and composting time are presented in ). The biogas production increased to its peak and then decreased when the alkali concentration was set at a fixed value. It is clear that the biogas production during a short composting time began at a low biogas production rate and increased to a peak point and then decreased. A similar trend was found in ), when the concentration of bacteria was fixed. A prolonged composting time provided enough time for the growth of bacteria and the degradation of leaves. However, with an increased composting time, more leaves were consumed, which may lead to a lack of raw material for biogas production during anaerobic digestion.
Based on this analysis, the optimal condition was calculated by solving the partial derivatives of Equation (3). The results were an alkali concentration of 4.61%, a bacterial concentration of 0.20‰, and a compositing time of 6.6 days, resulting in a biogas production of 30,580.7 ml. Three parallel experiments were conducted under the optimal condition for evaluation, and the results proved that the model is reliable in its predictive capacity.
3.2 Fermentation optimization
3.2.1. Changes in biogas production with fermentation time
The daily biogas production of each group (treated and untreated) under different digestion conditions was measured using the water displacement method; that is, by measuring the water discharge volume. The total amount of biogas produced during the experimental period of both treated and untreated groups is shown in . The total biogas production in the treated groups increased by an average of 523% (range 480% to 547%) compared to the untreated groups. shows the change in the daily based biogas accumulation with fermentation time of all of the groups. The total biogas production during the fermentation process and the daily biogas production of the treated groups were approximately five times higher on average than those of the untreated groups. In addition, all of the treated groups had peaks that appeared one day earlier on average during fermentation than that of the untreated groups.
Figure 2. Changes in the daily biogas production with fermentation time of the treated groups (t) and the untreated groups (u). (T1/U1: pH 6, TS 8%, Temperature 25°C. T2/U2, pH 6, TS 10%, Temperature 30°C. T3/U3, pH 6, TS 12%, Temperature 35°C. T4/U4, pH 7, TS 8%, Temperature 30°C. T5/U5, pH 7, TS 10%, Temperature 35°C. T6/U6, pH 7, TS 12%, Temperature 25°C. T7/U7, pH 8, TS 8%, Temperature 35°C. T8/U8, pH 6, TS 10%, Temperature 25°C. T9/U9, pH 8, TS 12%, Temperature 30°C.)
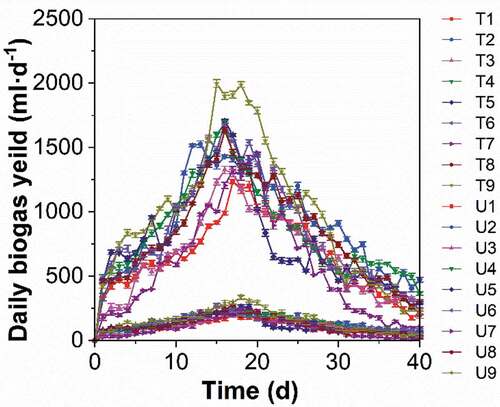
Table 4. Total biogas production of the treated and untreated groups under different fermentation conditions
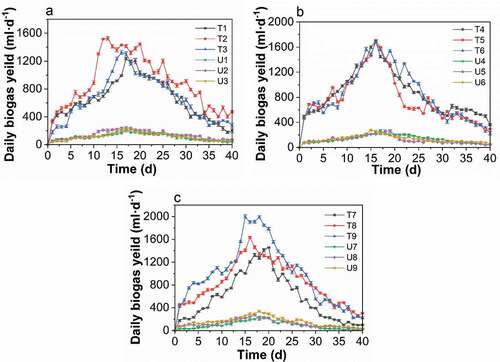
– present the variations in the biogas generation rate for the treated and untreated groups with different TS values, pH value, and temperatures. As shown in , temperature played the most important role in affecting the biogas generation at the same level of TS, with the highest amount produced at 30°C. In contrast, the biogas production was affected the most by the TS at the same temperature level, which peaked at 12% for the TS of fermentation broth. By increasing the TS from 8% to 12%, biogas production continuously rose (), which indicated the activation of microbial metabolism. Biogas production was first increased when the pH value increased from 6 to 7, but this was followed by a decline as the pH changed from 7 to 8, as shown in . In connection with –, the factor that had the greatest affect during anaerobic digestion was the fermentation temperature. This was followed by the TS of the fermentation broth and then pH value. The entire process of poplar leaf anaerobic digestion in both the treated and untreated groups had a fermentation period of 40 days, and the biogas generation trend was similar, where the biogas production increased rapidly in the early stage and gradually decreased after reaching the peak. In addition, the peak of the daily biogas yield for the treated groups was narrower and higher than in the untreated groups.
Figure 3. Changes in the biogas generation rate in the treated and untreated groups at different temperatures. A: 25°C, B: 30°C, and C:35°C. (T1/U1: pH 6, TS 8%, Temperature 25°C. T2/U2, pH 6, TS 10%, Temperature 30°C. T3/U3, pH 6, TS 12%, Temperature 35°C. T4/U4, pH 7, TS 8%, Temperature 30°C. T5/U5, pH 7, TS 10%, Temperature 35°C. T6/U6, pH 7, TS 12%, Temperature 25°C. T7/U7, pH 8, TS 8%, Temperature 35°C. T8/U8, pH 6, TS 10%, Temperature 25°C. T9/U9, pH 8, TS 12%, Temperature 30°C.)
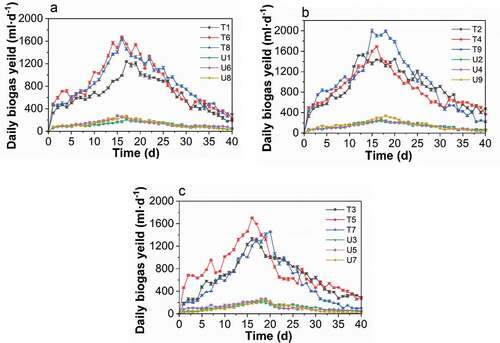
Figure 4. Changes in the biogas generation rate in the treated and untreated groups with different TS levels. A: 8%, B: 10%, and C: 12%. (T1/U1: pH 6, TS 8%, Temperature 25°C. T2/U2, pH 6, TS 10%, Temperature 30°C. T3/U3, pH 6, TS 12%, Temperature 35°C. T4/U4, pH 7, TS 8%, Temperature 30°C. T5/U5, pH 7, TS 10%, Temperature 35°C. T6/U6, pH 7, TS 12%, Temperature 25°C. T7/U7, pH 8, TS 8%, Temperature 35°C. T8/U8, pH 6, TS 10%, Temperature 25°C. T9/U9, pH 8, TS 12%, Temperature 30°C.)
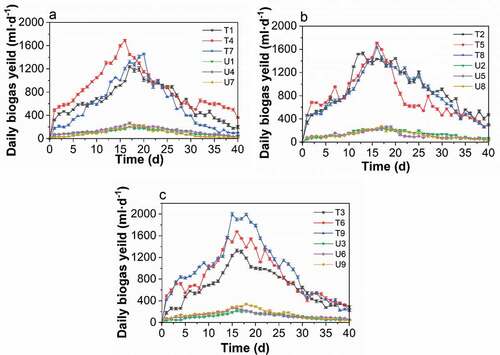
Figure 5. Changes in the biogas generation rate in the treated and untreated groups at different pH value. A: pH 6, B: pH 7, and C: pH 8. (T1/U1: pH 6, TS 8%, Temperature 25°C. T2/U2, pH 6, TS 10%, Temperature 30°C. T3/U3, pH 6, TS 12%, Temperature 35°C. T4/U4, pH 7, TS 8%, Temperature 30°C. T5/U5, pH 7, TS 10%, Temperature 35°C. T6/U6, pH 7, TS 12%, Temperature 25°C. T7/U7, pH 8, TS 8%, Temperature 35°C. T8/U8, pH 6, TS 10%, Temperature 25°C. T9/U9, pH 8, TS 12%, Temperature 30°C.)
3.2.2 Kinetics analysis of optimized fermentation
An experimental trial in the optimized condition, which was 30°C with a pH 7 and 10% solid concentration, was performed to analyze the kinetics of methane production. The kinetic parameters of the cumulated methane production model were provided by fitting the experimental data to the modified Gompertz model (EquationEquation 1(1)
(1) ). This is summarized in . The fitted curve is shown in , and it exhibits good agreement between the kinetic fitting data and the observed data. The calculated correlation coefficient (R2) was greater than 0.99, suggesting that the modified Gompertz model was able to sufficiently describe methane production. In addition, this indicated a good fit of the model predictions with the experimental data.
Figure 6. Fitting of the modified Gompertz model to the experimental data of optimized fermentation
The experimental methane production was 231.59 ml∙g-1 VS. A comparison of the different pre-treatments to increase methane production using two agricultural substrates was performed. When compared with other mono-digestion techniques, methane yield was higher in the untreated rice straw (178.3 ml∙g-1 VS) [Citation41], the 3% H2O2 treated corn straw (216.7 ml∙g-1 VS) [Citation42], the 5% NaOH treated corn stover (82 ml∙g-1 VS) [Citation43], the 5.0% NaOH treated poplar processing residue (271.9 ml∙g-1 VS) [Citation27], and the 3.0% NaOH treated poplar waste (81.1 ml∙g-1 VS) [Citation28].
4. Conclusion
Operational parameters during the pretreatment and digestion process of poplar leaves were optimized. The optimal pretreatment condition for poplar leaves fermentation was: an alkali concentration of 4.61%, a bacterial concentration of 0.20‰, and a composting time of 6.6 days. Among the operational parameters in this research, temperature was the most affected factor. Temperature was followed by the TS and pH value. The optimal condition for anaerobic digestion for poplar leaves was 30°C with a pH of 7 and a 10% solid concentration. The results of the contrasting tests were confirmed using the pretreatment experiment, which showed the cumulative biogas production increased by 480–547%. The peak periods of biogas production for the treated groups were one day earlier than those of the untreated groups. The experimental results for biogas production from optimized trial were well predicted using the modified Gompertz model, and the methane production was higher than during the mono-digestion of untreated rice straw or chemically treated corn straw and stover. This result indicates that the combined pretreatment was effective. Also, poplar leaves show promise as a fermentation raw material. The information produced by this study is important for the further exploration of poplar anaerobic digestion.
Disclosure statement
No potential conflict of interest was reported by the authors.
References
- Davis J, Hasse S, Warren A (2011). Waste-to-energy evaluation: US Virgin Islands. National Renewable Energy Laboratory (NREL).
- Santibañez-Aguilar JE, Ponce-Ortega JM, Betzabe González-Campos J, et al. Optimal planning for the sustainable utilization of municipal solid waste. Waste Manage. 2013;33(12):2607–2622.
- Mao G, Zou H, Chen G, et al. Past, current and future of biomass energy research: A bibliometric analysis. Renew Sust Energ Rev. 2015;52:1823–1833.
- Ghaly AE. A comparative study of anaerobic digestion of acid cheese whey and dairy manure in a two-stage reactor. Bioresour Technol. 1996;58(1):61–72.
- Bond T, Templeton MR. History and future of domestic biogas plants in the developing world. Energy Sustainable Dev. 2011;15(4):347–354.
- Braber K. Anaerobic digestion of municipal solid waste: A modern waste disposal option on the verge of breakthrough. Biomass Bioenergy. 1995;9(1–5):365–376.
- Svensson LM, Christensson K, Björnsson L. Biogas production from crop residues on a farm-scale level: is it economically feasible under conditions in Sweden? Bioprocess Biosyst Eng. 2005;28(3):139–148.
- Angelidaki I, Ellegaard L. Codigestion of manure and organic wastes in centralized biogas plants. Appl Biochem Biotechnol. 2003;109:95–105.
- Champagne P. Feasibility of producing bio-ethanol from waste residues: a Canadian perspective: feasibility of producing bio-ethanol from waste residues in Canada. ResouConserv Recycl. 2007;50(3):211–230.
- Us E, Perendeci NA. Improvement of methane production from greenhouse residues: optimization of thermal and H2SO4 pretreatment process by experimental design. Chem Eng J. 2012;181–182:120–131.
- Wang L, Shen F, Yuan H, et al. Anaerobic co-digestion of kitchen waste and fruit/vegetable waste: lab-scale and pilot-scale studies. Waste Manage. 2014;34(12):2627–2633.
- Xu Q, Tian Y, Kim H, et al. Comparison of biogas recovery from MSW using different aerobic-anaerobic operation modes. Waste Manage. 2016;56:190–195.
- Shukla AK, Sudhakar K, Baredar P. Renewable energy resources in South Asian countries: challenges, policy and recommendations. Resour-Effic Technol. 2017;3(3):342–346.
- FAO. Poplars and other fast-growing trees - renewable resources for future green economies. Synthesis of Country Progress Reports. 25th Session of the International Poplar Commission. September 12-16; Berlin, Germany. 2016. pp.92–93.
- Yao Y, He M, Ren Y, et al. Anaerobic digestion of poplar processing residues for methane production after alkaline treatment. Bioresour Technol. 2013;134:347–352.
- Kong DZ, Li WL, Wang PF, et al. Urban fallen leaves economy and sustainable utilization of green space. Henan Sci. 2005;23(6): 823–825. (In Chinese).
- Chaudhry AS. Rumen degradation in sacco in sheep of wheat straw treated with calcium oxide, sodium hydroxide and sodium hydroxide plus hydrogen peroxide. Anim Feed Sci Technol. 2000;83(3–4):313–323.
- Brown D, Li YB. Solid state anaerobic co-digestion of yard waste and food waste for biogas production. Bioresour Technol. 2013;127:275–280.
- Karimi S, Karimi K. Efficient ethanol production from kitchen and garden wastes and biogas from the residues. J Clean Prod. 2018;187:37e45.
- Wannapokin A, Ramaraj R, Whangchai K, et al. Potential improvement of biogas production from fallen teak leaves with co-digestion of microalgae. 3 Biotech. 2018;8(2):123.
- Zhu J, Wan C, Li Y. Enhanced solid-state anaerobic digestion of corn stover by alkaline pretreatment. Bioresour Technol. 2010;101(19):7523–7528.
- Paudel SR, Banjara SP, Choi OK, et al. Pretreatment of agricultural biomass for anaerobic digestion: current state and challenges. Bioresour Technol. 2017;245:1194–1205.
- Romero-Güiza MS, Wahid R, Hernández V, et al. Improvement of wheat straw anaerobic digestion through alkali pre-treatment: carbohydrates bioavailability evaluation and economic feasibility. SciTotal Environ. 2017;595:651–659.
- Kim JS, Lee YY, Kim TH. A review on alkaline pretreatment technology for bio-conversion of lignocellulosic biomass. Bioresour Technol. 2016;199:42–48.
- Rodrigues CIS, Jackson JJ, Montross MD. A molar basis comparison of calcium hydroxide, sodium hydroxide, and potassium hydroxide on the pretreatment of switchgrass and miscanthus under high solids conditions. Ind Crop Prod. 2016;92:165–173.
- Chang M, Li D, Wang W, et al. Comparison of sodium hydroxide and calcium hydroxide pretreatments on the enzymatic hydrolysis and lignin recovery of sugarcane bagasse. Bioresour Technol. 2017;244:1055–1058.
- Yao Y, Chen S, Kafle GK. Importance of “weak-base” poplar wastes to process performance and methane yield in solid-state anaerobic digestion. J Environ Manage. 2017;193:423–429.
- Yao Y, He M, Ren Y, et al. Anaerobic digestion of poplar processing residues for methane production after alkaline treatment. Bioresour Technol. 2013;134:347–352.
- Geng YC, Zhang B, Du LZ, et al. Improving methane production during the anaerobic digestion of waste activated sludge: caO-ultrasonic pretreatment and using different seed sludges. Procedia Environ Sci. 2016;31(1):743–752.
- Zheng Y, Zhao J, Xu FQ, et al. Pretreatment of lignocellulosic biomass for en-hanced biogas production. Prog Energy Combust Sci. 2014;42(1):35–53.
- Zhang L, Jahng D. Enhanced anaerobic digestion of piggery wastewater by ammonia stripping: effects of alkali types. J Hazard Mater. 2010;182(1):536–543.
- Wang T, Ai Y, Peng L, et al. Pyrolysis characteristics of poplar sawdust by pretreatment of anaerobic fermentation. Ind Crops Prod. 2018;125:596–601.
- Guan R, Li X, Wachemo AC, et al. Enhancing anaerobic digestion performance and degradation of lignocellulosic components of rice straw by combined biological and chemical pretreatment. SciTotal Environ. 2018;637-638:9–17.
- Ji J, Zhang J, Yang L, et al. Impact of co-pretreatment of calcium hydroxide and steam explosion on anaerobic digestion efficiency with corn stover. Environ Technol. 2017;38(12):1465–1473.
- Li W, Zhang L, Xu G. Enhancement of biogas yield of poplar leaf by high-solid codigestion with swine manure. Appl Biochem Biotechnol. 2016;179(2):270–282.
- Zhang RH, Zhang ZQ. Biogasification of rice straw with an anaerobic phased solids digester system. Bioresour Technol. 1999;68(3):235–245.
- Liu EH, Liu SY. Process optimization and study of biogas fermentation with a mixture of duck manure and straw. Renew Sust Energ Rev. 2017;72:439–444.
- Lay J, Li Y, Noike T. Effect of moisture content and chemical nature on methane fermentation characteristics of municipal solid wastes. J Environ Sys Eng. 1996;552(7):101–108.
- Montgomery DC, ed. Design and analysis of experiments. London: John Wiley & Sons; 2008.
- Wang X, Gaihe Y, Li F, et al. Response surface optimization of methane potentials in anaerobic co-digestion of multiple substrates: dairy, chicken manure and wheat straw. Waste Manage Res. 2012;31:60–66.
- Gu Y, Chen X, Liu Z, et al. Effect of inoculum sources on the anaerobic digestion of rice straw. Bioresour Technol. 2014;158:149–155.
- Song Z, GaiheYang L, Yan X, et al. Comparison of seven chemical pretreatments of corn straw for improving methane yield by anaerobic digestion. PloS One. 2014;9(4):e93801.
- Zhu J, Wan C, Li Y. Enhanced solid-state anaerobic digestion of corn stover by alkaline pretreatment. Bioresour Technol. 2010;101(19):7523–7528.