
ABSTRACT
This work highlights the potential of corncob biochar (CCBC) and Brevibacillus parabrevis for the decolorization of brilliant green (BG) dye from synthetically prepared contaminated wastewater. The CCBC was characterized by proximate, Fourier-transform infrared spectroscopy, scanning electron microscopy, X-ray diffraction, and Brunauer–Emmett–Teller analysis, respectively. Different parameters affecting the adsorption process were evaluated. The experimental results were analyzed by the Langmuir and Freundlich isotherm models. Kinetic results were examined by different models; pseudo-second-order model has shown the best fit to the experimental data. Anew positive values of ΔHo (172.58 kJ/mol) and ΔSo (569.97 J/K/mol) in the temperature range of 303–318 K revealed that the adsorption process was spontaneous and endothermic. The present investigation showed that the bacteria immobilized with CCBC showed better BG dye degradation. The kinetic parameters, μmax, Ks, and μmax, were found to be 0.5 per day, 39.4 mg/day, and 0.012 L/mg/day using Monod model, respectively. The adsorbent with bacteria showed good potential for the removal of cationic BG dye and can be considered for the remediation of industrial effluent.
Graphical abstract
1. Introduction
Pollution due to rapid population growth and industrial development has largely contributed to the deterioration of water quality [Citation1]. Textile industries are the main culprit of environmental deterioration. The textile sector consumes large volumes of water and generates wastewater that are usually contaminated with coloring material, salt, and other fixing agents [Citation2,Citation3]. The disposal of industrial effluents into water bodies, that is, without treatment or inadequate treatment, has shown to cause adverse impact on the environment and human health [Citation4].The annual global production of dyes is 7 × 10⁵ tones [Citation5,Citation6], and in India, over 1.5 million liter of effluent containing dyes are released by the industries every day [Citation7]. Azo dyes are one of the largest class of dyes with production estimated between 60 and 70% of all the dyeing materials produced annually [Citation8]. Approximately 10–12% of the dyes are lost during the processing and disposed into industrial wastewater [Citation9]. The availability of high-quality water is a prerequisite for good health, ecosystem, and sustainable economy [Citation10]. In developing and developed countries, lack of accessibility to clean water is a topic of serious concern. The occurrence of dye in trace amounts (< 1 mg/l) is visible and undesirable in water which makes the water unfit for irrigation, domestic uses, and human consumption [Citation11]. The colored water reduces sunlight penetration in water bodies, lowers its photosynthetic activities, causes eutrophication, oxygen deficiency, and disturbs the entire aquatic balance [Citation12,Citation13]. Dyes and their intermediate products adversely affect the health of human beings due to its carcinogenic, cytotoxic, mutagenic, and immune suppression effects [Citation14].
Brilliant green (BG) cationic dye is widely used in the pulp and paper and dying industries [Citation15]. The cationic dyes are more toxic when compared to the anionic dyes [Citation15]. BG is utilized in manufacturing of ink and staining component for media. It is a highly toxic dye as its fatal dose is in the range of 50–500 mg/kg for human beings [Citation16]. Additionally, studies showed that it causes adverse effect on rats by affecting their renal and reproductive systems [Citation17]. Hence, BG has been linked to causing several health-related disorders, for example, skin and respiratory tract irritation, coughing, breath shortness, and irritation to the gastrointestinal tract, with symptoms of nausea, abdominal pain, and diarrhea.
Many physical–chemical methods such as ozonation [Citation18], electro-flotation [Citation19], electro-oxidation [Citation20], nano-filtration membrane [Citation21], reverse osmosis [Citation22], coagulation-flocculation [Citation23], ion-exchange [Citation13], and adsorption [Citation24,Citation25] have been used for treating dye containing wastewaters. However, these technologies have some drawbacks: (i) complex operating procedures, (ii) intensive energy requirement, (iii) high operational cost, and (iv) production of secondary wastes [Citation26–Citation28]. Cost is an important parameter to select a proper adsorbent. Among the several techniques, adsorption using agricultural biomass has received considerable attention because of the following reasons: (i) agro-based wastes are available in large quantities at a cheaper price, (ii) demonstrate high dye removal rates, (iii) ability to treat concentrated dye containing effluent, and (iv) its reuse and recyclability [Citation29–Citation31]. In literature, different agro-wastes have been used for dye removal from effluents such as jute sticks [Citation32], Jamun leaves [Citation33], rice straw [Citation34], wheat straw [Citation35], banana peel [Citation36], pine wood [Citation37], etc. Maize (Zea mays L.; family: Poaceae), also known as corn, is a third largest food crop in India with an annual production of 24.3 million metric tons [Citation38]. Huge quantities of corncobs are produced as agricultural waste during its processing [Citation39]. Most of the corncob wastes are discarded or burnt and such non-engineering practices pollutes the environment [Citation40,Citation41].
The degradation of dyes using biocatalysts (ie microorganisms) is cost-effective and efficient wherein less sludge is produced; however, as the microbial processes are slow, its application is limited for the treatment of dye containing wastewater at the industrial scale [Citation42]. Among the different microbes, bacteria exhibit fast and better degradation ability and they are capable of operating under harsh conditions. Datta et al. [Citation43] reported 80% biodegradation of BG dye by Micrococcus luteus and Pseudomonas syringae. There is no previous research till date in the literature on the use of corncob biochar (CCBC) and Brevibacillus parabrevis for the removal of cationic dye BG. The operation of a continuous packed bed reactor is more efficient for real-time industrial effluent treatment [Citation44].
The present study has been designed with an aim to determine the compatibility of using corncob and Brevibacillus parabrevis for removal of BG dye in batch and continuous packed bioreactors. The performance of the reactors was compared under free cell and immobilized cell condition and the reactors process parameters were optimized.
2. Materials and methods
2.1 Collection of corncobs and biochar preparation
Corncobs were collected from the local corncob vendor shop in Varanasi (after the grains were removed). The corncobs were initially washed several times with tap water and thrice with distilled water to remove contaminants from its surface. Then, they were cut into pieces and kept under sun light for 5–6 days to decrease moisture content. A pyrolysis reactor was used for biochar production from corncob. The nitrogen gas was purged in the reactor for maintenance of inert condition and it checks the ash production. The dehydrated corncobs were grinded and sieved to 210 μm particle size. Then, 2.0 kg of the corncob was pyrolyzed at 500°C for 4 h. Pyrolysis produces the solid carbon content known as biochar, liquid (bio-oil), and gaseous residue. The pyrolyzed biochar was treated with Milli-Q water and dried at 70°C for 2 h in an oven. The prepared biochar was kept in airtight plastic container.
2.2. Proximate analysis and characterization of biochar (FTIR, BET, SEM, and XRD analysis)
Proximate analysis of CCBC was evaluated to check its sturdiness toward thermochemical process. Then, 2 g biochar was placed in a crucible at 110°C in hot air oven for 1 h for calculation of moisture content. For volatile content, 2.0 g biochar was taken in a closed crucible and was kept in a muffle furnace at 900°C for 10 min. For the determination of ash content, 2.0 g of biochar was kept in an open crucible at 775°C for 1 h in the muffle furnace. Fixed carbon content was calculated according to the formula shown in Eq. (1):
The presence of functional groups on CCBC before and after the adsorption of BG dye were determined by Fourier-transform infrared spectroscopy (FTIR) (NICOLET 5700 FT-IR, Tokyo, Japan) in wave number range of 400–4000 cm−1 using KBr pellet method.
Brunauer–Emmett–Teller (BET) (ASAP 2020 Micromeritics, USA) analysis was conducted to know surface area, pore size, and adsorption volume of CCBC. Morphology of CCBC surface was analyzed by scanning electron microscope (SEM) (QUANTA 200 F, The Netherlands).
X-ray diffraction (XRD) analysis was performed to identify the composition of minerals present and formed during the treatment using biochar by computer-controlled X-ray diffractometer (Philips Electronic Instruments, Tokyo, Japan) equipped with a stepping motor and graphite crystal monochromator. Crystalline minerals in the samples were identified by comparing diffraction data against a database compiled by the Joint Committee on Powder Diffraction and Standards [Citation45].
2.3. Preparation of the Brilliant Green dye stock solution
BG was procured from Sigma-Aldrich Chemicals, India. BG, cationic dye, is derivative of triarylmethane dye (). The stock solution (1000 ppm) of BG dye was made initially and it was diluted to produce dye solution of required concentrations. The concentration of BG dye was measured at 626 nm using an UV-Vis double beam spectrophotometer (Elico SL 169, Hyderabad, India).
Table 1. Physico-chemical characteristics of Brilliant green (BG) dye used in the experiment including proximate and BET surface area analysis for corncob and corncob biochar.
2.4. Batch adsorption studies
2.4.1 Batch adsorption experiment
In batch experiments, effects of different parameters including dye concentration (50–200 ppm), biochar dose (0.5–2.5 g), pH (5.0 to 9.0), and exposure time (30–210 min) were investigated at 120 rpm agitation speed for BG dye removal on produced CCBC. The 100 ml of BG dye solutions (50, 100, 150, and 200 ppm) were kept in four different Erlenmeyer flasks with different biochar amount (0.5, 1.0, 1.5, 2.0, and 2.5 g). Flasks were kept in incubator shaker at 120 rpm and OD was taken at λmax = 626 nm for determining BG dye concentration in supernatant.
where, Co and Ct are initial and final concentrations of BG dye at time t in mg/l.
2.4.2. Point zero of charge
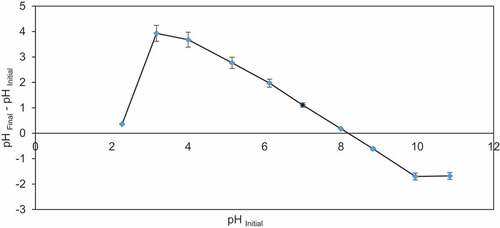
Point zero of charge was analyzed by the procedure of Rivera-Utrilla et al. [Citation46]. The 100 ml of NaCl (0.01 M) solutions were prepared and their pH ranging from 2.0 to 12.0 was maintained by 0.10 M NaOH or HCl [Citation16]. Then, 1.0 g of adsorbent was introduced into each solution and stirred at room temperature for 24 h before determining the pHfinal. The pHPZC was calculated on the basis of curve pHfinal – pHinitial = f(pHinitial).
2.4.3. Adsorption kinetics and isotherm studies
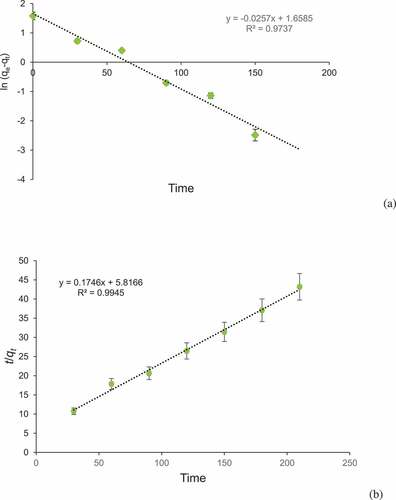
The kinetic parameters provide rate of adsorption, equilibrium time, and help in the modeling of adsorption processes [Citation47]. Pseudo-first-order and pseudo-second-order models were used for the determination of kinetics involved in adsorption process. Pseudo-first-order reaction can be expressed as [Citation48]:
where qe and qt are BG dye amount adsorbed at equilibrium and time t and k1 is pseudo-first-order adsorption rate constant (min 1). Pseudo-second-order reaction can be calculated by equation of Ho and McKay [Citation49]:
where qe is BG dye adsorbed on the adsorbent at equilibrium and k2 is pseudo-second-order adsorption rate constant (g/mg/min).
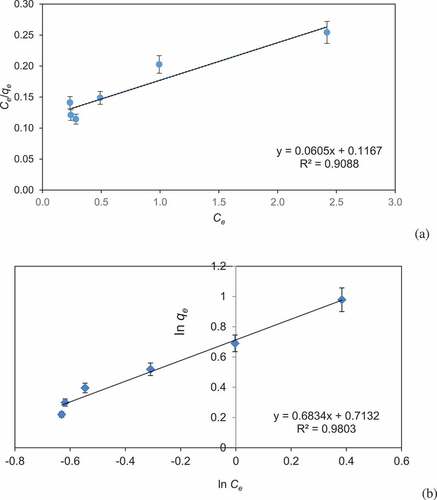
Two isotherms were applied to evaluate adsorption equilibrium. BG dye (50 mg/l) 100 ml solution were taken with different adsorbent dosages to check the feasibility of the isotherm by comparing the adsorption capacity. Langmuir isotherm model exhibits that adsorption process occurs in a monolayer manner and energy of adsorption is uniform on the adsorbent surface at constant temperature [Citation8]. Langmuir equation is given as:
where qe (mg/g) = BG dye adsorbed at equilibrium, qm (mg/g) = amount of dye adsorbed, Ce = dye concentration (mg/l) at equilibrium, and K1 = Langmuir constant.
Freundlich isotherm explains distribution of solute molecules between aqueous and solid phases at equilibrium. The Freundlich equation is expressed as:
where, Kf and n are Freundlich constants. Value of n shows nature of process if n < 1, chemical; n = 1, a linear; n > 1, a physical process.
2.4.4. Determination of activation energy
Reaction rate depends on temperature and with increasing temperature molecular collision takes place. The relation between temperature and rate constant can be explained by equation:
where k = rate constant, Z = proportionality constant, Ea = activation energy for reaction, and R = gas constant.
The following equation is retrieved by using natural logarithm on both sides:
2.4.5. Thermodynamic analysis
Changes in free energy, enthalpy, and entropy were determined for adsorption of BG on the CCBC.
After rearranging the equation, log Kd =-
. Using curve fitting method, the values of enthalpy (∆Ho) and entropy (∆So) were calculated.
2.5. Biodegradation of dye by bacterial cells by isolated bacteria
Bacterial species were isolated from the industrial effluent obtained from neighboring areas of the carpet industries in Bhadohi region, Uttar Pradesh, India. Nutrient agar medium was used as a growth medium. The solution (100 ml) was prepared by mixing 95 ml of nutrient agar; 5.0 ml of BG dye (50 mg/l) and 2.0 ml of isolated bacterial inoculum were also added and incubated at 30°C for 2 days. Diluted culture was spread on petri plate and bacterial colonies were observed after 48 h. These colonies were further sub-cultured six times to obtain pure strains. Two different bacterial isolates were labeled as B1 and B2. Control nutrient agar medium was also used without dye and bacterial culture. Two bacterial strains were assessed for BG degradation by by measuring the OD values using an UV-Vis spectrophotometer.
2.5.1. Screening of best bacterial isolate and its biodegradation kinetics in free cell
Two bacterial samples were isolated from wastewater released from carpet industry and the isolate labeled as B2 showed better growth and degradation of BG dye during analysis with UV-Vis spectrophotometer at 626 (peak for testing BG dye) and 600 nm (to check bacterial growth). B2 was identified as Brevibacillus parabrevis by DNA sequencing technique.
The small amount of bacterial inoculum was added to different concentrations of BG dye for its degradation. The sample (3 ml) was centrifuged and filtered and its OD was taken by UV-Vis spectrophotometer at 626 nm. Decolorization (%) was calculated by using the following formula:
The kinetics of biodegradation was studied using the Monod’s model [Citation50].
where μ and μmax are specific and maximum specific growth rate of bacteria; Ks = half velocity constant (mg/l); X = bacteria concentration; S = limiting substrate concentration; t = time taken for degradation. The equation can be written as follows [Citation51]:
2.5.2 Effect of inoculum size in free cell and packed bed bioreactor
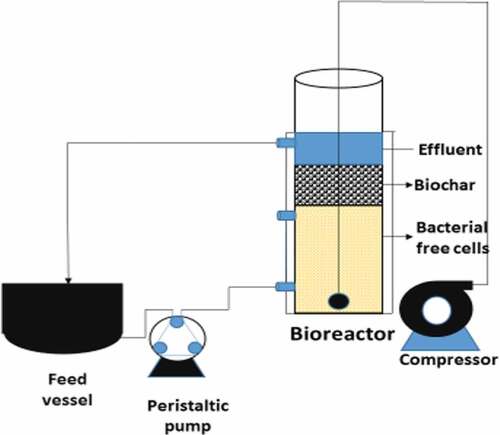
The effect of inoculum on dye degradation was studied by varying it from 1.0 × 10⁵ to 5.0 × 10⁵ CFU/ml at 35 ± 2°C for 24 h for BG dye (50.0 mg/l). The 3.0 × 10⁵ CFU/mL was considered as an optimum inoculum size as dye degradation percentage was significantly increased at this inoculum size and degradation becomes constant beyond this range. A cylindrical borosilicate glass packed bed bioreactor (L = 48 cm and D = 8.3 cm) with flat bottom and proper grooving to hold the beds was designed. The feed was given from the top of the reactor through silicon tubes. CCBC was added between two grooves of the tube (6.0 cm) and was supported by metal sieves tied with muslin cloth above the packing material. Two outlet ports were provided, one below and the other above the packing for collection of the samples. The third outlet port at the base of the bioreactor serves the purpose of proper circulation of BG dye. The temperature of bioreactor was controlled by thermostat. The aerobic condition was maintained in the bioreactor by supplying decontaminated air through a diffuser placed at the bottom of the bioreactor.
3. Results and discussion
3.1. Proximate analysis and characterization of corncob biochar
Proximate analysis was conducted to analyze fixed carbon, volatile matter, moisture, and ash content in a CCBC. Proximate analysis data showed that adsorbent has 70.7% fixed carbon, 22.3% volatile matter, 1.2% moisture content, and 5.8% ash content ().
The functional groups present on CCBC surface were determined by FTIR spectroscopy. On comparing the FTIR spectra analysis of the corncob before and after BG dye adsorption, it was clear that the large number of functional groups present on the corncob surface facilitated BG dye adsorption (data not shown schematically). The broad peak with rounded tip at 3034 cm−1 in CCBC spectrum is assigned to O–H stretching of an alcoholic group of adsorbents. The peak at 2341 cm−1 might be due to O = C = O stretching of carbon dioxide. A band at 1257 cm−1 is allocated to C-O stretching of alkyl aryl ether group. At 3042 cm−1, peak corresponds to O–H stretching of alcoholic group. A clear peak at 1565 cm−1 indicates N-O stretching of nitro group and peak at 1176 cm−1 exhibits C–O stretching of tertiary alcohol group. Result also exhibits the presence of C-Cl and C-I stretching of halo compounds at wave numbers 846 and 455 cm−1, respectively (Figure S1a and S1b). The BET (Micromeritics, AAP 2020, surface area and porosity analyzer) analysis of CCBC was conducted. The result indicates that BET surface area is 770.69 m2/g, pore volume is 0.406 cm3/g, and adsorption average pore diameter is 2.873 nm ().
3.2. Surface studies using scanning electron microscopy and XRD analysis
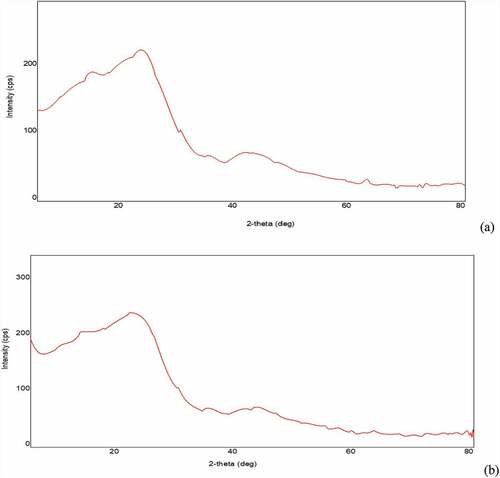
SEM technique makes it possible to visualize the morphology of the surface of the biochar. Micrographic images of CCBC obtained from SEM before and after adsorption BG dye adsorption have been displayed in and b, c, respectively. The corncob surface was very irregular, porous with cave type openings. The large number of pores were observed on the biochar surfaces, which promote BG adsorption [Citation52]. SEM images clearly indicate that corncob can easily adsorb BG dye due to its adequate morphology. XRD measurements deal with the crystallinity of the sample. The X-ray diffraction pattern of CCBC indicates that biochar is amorphous in texture and contains silica ( a and b). The presence of sharper peak was due to the presence of silica, whereas group of small peaks indicated the presence of cellulose [Citation53].
Figure 1. SEM images of corncob biochar (CCB): (a) before adsorption of Brilliant green dye on corncob biochar and (b) and (c) after adsorption of Brilliant green dye on corncob biochar.
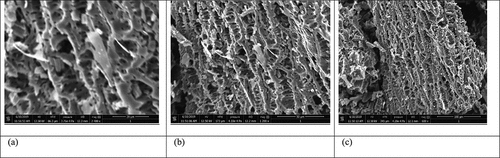
Figure 2. XRD images of corncob biochar (CCBC): (a) before adsorption of Brilliant green dye and (b) after adsorption of Brilliant green dye.
3.3. Investigation of Brilliant green dye adsorption by corncob biochar
3.3.1 Effect of pH
Impact of pH on BG was examined by altering pH from 5.0 to 9.0 at 27 ± 2°C with 50–200 mg/l BG dye solution. Maximum 99.9% removal of BG dye (50 mg/l) was observed by CCBC at high pH of 8.0, whereas 97.5, 99.4, and 99.4% dye removal were observed at pH 5.0, 6.0, and 7.0, respectively (). The pH controls the surface charge of the biochar and acts as indicator for adsorption of BG dye. Significant removal of BG dye was observed at high pH due to involvement of H+ ions in system. Increasing pH of the medium between 5.0 and 9.0 leads to a significant increase in the adsorption capacity of biochar (). Due to electrostatic force quick adsorption of BG dye by CCBC at high pH, negative charge increases on biochar surface with increase in pH and it causes deprotonation of the functional groups available on biochar. Deprotonated functional groups act as sites for binding of cationic dye. The pHpzc of corncob adsorbent was 8.1 (). The point of zero charge is related to pH value for which net electric charge of the surface of the material is neutral [Citation45]. If the value of pH < pHpzc, it shows positively charged biochar surface and pH > pHpzc indicates negatively charged surface [Citation54]. Thus, pHpzc value of 8.1 illustrates that CCBC can adsorb cationic dye if pH of the solution is more than point of zero charge.
Table 2. Effect of different parameters for brilliant green dye adsorption by corncob in batch tests.
Figure 3. A graphical plot and calculation of the point zero of charge of corncob biochar (CCBC).
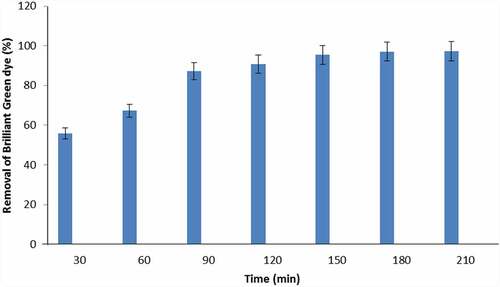
3.3.2 Effect of contact time and initial concentration of dye
Effect of exposure time on BG adsorption was explored to know the equilibrium time of the process. As demonstrated in , BG percentage removals 55.9, 67.2, 87.2, 90.7, and 95.4% were observed after 30, 60, 90, 120, and 150 min for 50 ppm dye concentration, respectively. Significant increase in BG dye removal rate was found by increasing adsorbent and adsorbate exposure time. Equilibrium time for adsorption process was found to be 180 min. A significant increase in adsorption capacity was reported at initial exposure period and it might occur due to the presence of vacant sites on the biochar. Mild increase in adsorption at later stage was due to the unavailability of sites [Citation55]. Table 2 shows that adsorption capacity of biochar increases with dye concentration as it provides driving force and transfers BG dye to CCBC.
Figure 4. Effect of contact time on the removal of Brilliant green dye by corncob biochar (CCBC).
3.3.3 Effect of adsorbent amount
Impact of CCBC amount on BG removal was examined by changing the biochar amount from 0.5 to 2.5 g. BG dye removal was increased from 98.1 to 98.8% when the biochar amount was increased from 0.5 to 2.5 g in 50 mg/l BG dye concentration as shown in . Maximum BG dye removal of 98.8% was observed with 2.0 g of CCBC. The surface area, structure of pores, and functional groups on biochar surface are the main factors that govern their abilities to adsorb dye. Increase in dye removal percentage with high adsorbent dose provides enhanced surface area with functional groups available for adsorption, which helps in easy piercing of dye on the adsorption sites [Citation56]. However, adsorption capacity significantly reduced from 9.8 to 1.98 mg/g when biochar amount is increased from 0.5 to 2.5 mg/l. This illustrates aggregation of CCBC, which reduces surface area of adsorbent.
Table 3. Kinetic models (Pseudo-first-order and pseudo-second-order models) and adsorption isotherms (Langmuir and Freundlich) constants for the Brilliant green dye by corncob biochar.
3.3.4 Effect of temperature
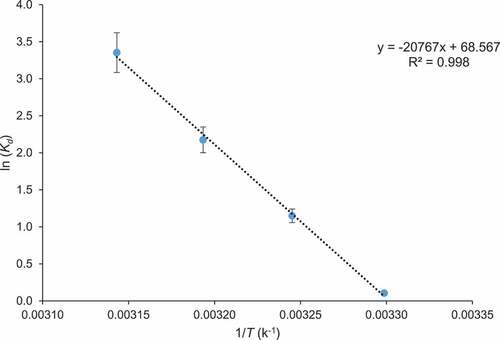
The adsorption of BG on CCBC was investigated at different temperatures such as 303, 308, 313, and 318 K after 180 min exposure period. BG dye (200 mg/l) showed 43.27 and 45.35% adsorption at 303 and 308 K, respectively. Additionally, BG dye adsorption was significantly increased to 99.17% at 318 K (). Temperature promotes adsorption process by enhancing diffusion rate of dye molecules in CCBC pores. By enhancing mobility of dye ions, adsorption capacity of adsorbent increases because retarding forces working on the diffusing ions decrease [Citation57]. Increase in BG dye adsorption at high temperature was due to the positive value of ΔHo which suggests adsorption process was endothermic. Tavlieva et al. [Citation58] also reported same results during adsorption of BG by white rice husk ash.
3.4. Adsorption isotherm and isotherm kinetics
Adsorption isotherm model provides valuable facts on adsorption mechanism, adsorption capacity, and surface property of biochar. The isotherm modeling plays an important role in designing of effluent treatment system. Equilibrium results have been analyzed with Langmuir and Freundlich isotherm models ( and b). In the present study, Freundlich model exhibited a better fitting model in comparison with Langmuir due to its higher correlation coefficient (R2 = 0.9803). This exhibits multilayer coverage of BG dye on CCBC and the value of n was less than one, which shows physical nature of the adsorption process. Langmuir constants as calculated from equation showed the following values: qm = 16.53 mg/g and k = 0.52 mg−1, (R2 = 0.9088) and Freundlich constants were Kf = 2.04 and n = 1.46 (R2 = 0.9803).
Figure 5. Adsorption isotherm of (a) Langmuir isotherm and (b) Freundlich isotherm for the adsorption of Brilliant green dye by corncob biochar (CCBC).
The kinetic studies provide knowledge regarding efficiency of adsorption process and reaction pathway. Pseudo-first-order and pseudo-second-order models were applied to examine adsorption of BG by corncob. The coefficient of determination (r2) was 0.9737 for pseudo-first-order and 0.9945 for pseudo-second-order model. Pseudo-second-order kinetic model was best obeyed due to its high correlation coefficient value ( and b). The results showed that adsorption process was managed by sorption between dye molecules and corncob surface. The pseudo-second-order model was reported by different workers such as adsorption of crystal violet dye by wheat bran [Citation59], tea dust [Citation60], and Tectona grandis sawdust [Citation61]. Adsorption of direct red dye on rice husks [Citation62] and methylene blue on fruit shell of tamarind [Citation63].
Figure 6. Adsorption kinetics of: (a) Pseudo first order reaction and (b) pseudo second order model fit for the adsorption of Brilliant green dye by corncob biochar (CCBC).
3.5. Activation energy and thermodynamic analysis of the adsorption process
Activation energy used in the adsorption process was evaluated by Arrhenius equation and value of Ea was 588.46 kJ/mol, which indicates that CCBC possesses sites for binding of dye. The changes in Gibb’s free energy (ΔGo), enthalpy (ΔHo), and entropy (ΔSo) were analyzed to predict nature of adsorption. Experiments were conducted at different absolute temperatures such as 303, 308, 313, and 318 K. The results of thermodynamic studies are shown in and . The negative value of ΔGo at different temperature verified impetuous nature of adsorption of BG dye on CCBC. Furthermore, when the temperature increased from 303 to 318 K, the Gibbs free energy (ΔGo) decreased from 0.276 to 8.870 kJ mol−1, indicating that at high temperature adsorption process was impetuous [Citation64]. The positive value of ΔHo (172.58 kJ/mol) verified endothermic nature of BG dye adsorption on biochar. The positive value of ΔSo (569.97 J/K mol) showed the affinity of the CCBC for dye and suggested fast adsorption process [Citation65]. A conclusion can be drawn that BG dye adsorption onto CCBC was endothermic and spontaneous process which was consistent with the results observed in adsorption isotherm study.
Figure 7. Thermodynamic parameters for the adsorption of Brilliant green dye by corncob biochar (CCBC).
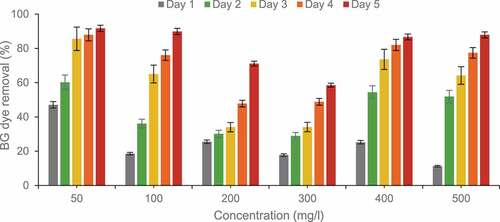
3.6. Effect of concentration and time
Time directly affects the growth of bacteria and its application in dye degradation. Bacteria have a slower growth rate and require days for complete dye degradation. BG dye (50 mg/l) degradation rate was 47.1% after 24h. Degradation increased considerably to 85.6% after 72 h and maximum degradation 91.7% was observed in 5 days ().
Figure 8. Effect of concentration and time on Brilliant green dye removal by free cells in batch experiments using corncob biochar.
3.7. Kinetic studies with Monod model
Monod model was applied to study the kinetics of the bioprocess. A plot between μ and S showed a curvilinear relationship between specific growth rate and substrate concentration. The kinetic parameters, μmax and Ks, were calculated from the graph and found to be 0.5/day and 39.4 mg/day, respectively. The low value of μmax and high value of Ks showed a favorability of the reaction. µmax/Ks shows the ability of degradation of bacteria in a bio-reactor [Citation66]. The value of µmax/Ks was 0.012 L/mg/day (). Brevibacillus parabrevis was able to degrade the high concentration of BG dye as its efficiency was observed by kinetic studies. The adsorption capacity of CCBC for BG dye adsorption was compared with the previous studies (). This indicates that corncob waste is cheap, promising, and valuable adsorbent for cationic dyes. Monod model was used to study the kinetic of the congo red dye using coconut shell biochar by plotting graph between µ v/s S and reported a curvilinear relationship between specific growth rate (µ) and substrate concentration. The kinetic parameters, µmax and Ks, were calculated from the graph and found to be 0.461/day and 39.44 mg/day, respectively [Citation67]. The low value of µmax and high value of Ks showed a favoring ability of the reaction. Future studies in this research direction could also combine the treatment of wastewater contaminated with metals and different bioreactor configurations such as a bio-filter or a fluidized bed bioreactor should be tested to ascertain the performance in continuous systems [Citation68–Citation70].
Table 4. Literature reports on the adsorption capacity achieved by different biochar-based materials for the removal of Brilliant green dye.
4. Conclusions
The present work clearly shows the synergistic effect of corncob biochar and Brevibacillus parabrevis for removal of BG dye from textile industry effluent. Thermodynamic study indicated that the dye adsorption on CCBC was spontaneous and endothermic process. Results reflected that immobilized system was better than free cell system for the treatment of dye contaminated effluent. Hence, due to high efficiency and low treatment cost, this process can be recommended for effluent treatment at large scale.
Highlights
Brilliant green (BG) from wastewater was adsorbed using agro-waste corncob.
Corncob biochar (CCBC) possessed a maximum surface area of 770.69 m2/g and a pore volume of 0.41 cm3/g.
Maximum multi-layered adsorption capacity of BG on CCBC was 16.5 mg/g.
Synergistic effect of CCBC and Brevibacillus parabrevis for dye removal was found to be favorable.
Acknowledgements
The authors are highly thankful to the Director, CSIR-Indian Institute of Toxicology Research (IITR), Lucknow (India), for his valuable encouragement and intra-institutional financial support (MLP002) for this research work. The authors thank IIT (BHU), Varanasi and SPARC, MHRD, IIT Kharagpur for providing funding support. Eldon R. Rene thanks IHE Delft Institute of Technology for providing “staff time” support under the project “Support to Society” to collaborate with researchers from India.
Disclosure statement
No potential conflict of interest was reported by the authors.
Correction Statement
This article has been republished with minor changes. These changes do not impact the academic content of the article.
References
- Ramírez Calderón OA, Abdeldayem OM, Pugazhendhi A, et al. Current updates and perspectives of biosorption technology: an alternative for the removal of heavy metals from wastewater. Curr Pollut Rep. 2020;6:8–27.
- Secondes MFN, Naddeo V, Belgiorno V, et al. Removal of emerging contaminants by simultaneous application of membrane ultrafiltration, activated carbon adsorption, and ultrasound irradiation. J Hazard Mater. 2014;264:342–349.
- Qamruzzaman NA. Degradation of acephate by colloidal manganese dioxide in the absence and presence of surfactants. Desalin Water Treat. 2015;55:2155–2164.
- Tripathi R, Gupta A, IS T. An integrated approach for phycoremediation of wastewater and sustainable biodiesel production by green microalgae, Scenedesmus sp. ISTGA1. Renewable Energy. 2019;135:617–625.
- Wu Z, Zhong H, Yuan X, et al. Adsorptive removal of methylene blue by rhamnolipid-functionalized graphene oxide from wastewater. Water Res. 2014;67:330–344.
- Kumar N, Sinha S, Mehrotra T, et al. Biodecolorization of azo dye Acid Black 24 by Bacillus pseudomycoides: process optimization using Box Behnken design model and toxicity assessment. Bioresour Technol Rep. 2019;8(100311):1–11.
- Shafqat M, Khalid A, Mahmood T, et al. Evaluation of bacteria isolated from textile wastewater and rhizosphere to simultaneously degrade azo dyes and promote plant growth. J Chem Technol Biotechnol. 2017;92:2760–2768.
- Bruschweiler BJ, Merlot C. Azo dyes in clothing textiles can be cleaved into a series of mutagenic aromatic amines which are not regulated yet. Regul Toxicol Pharmacol. 2017;88:214–226.
- Bharathi KS, Ramesh SPT. Fixed-bed column studies on biosorption of crystal violet from aqueous solution by Citrullus lanatus rind and Cyperus rotundus. Appl Water Sci. 2013;3:673–687.
- Ahmed T, Imdad S, Yaldram K, et al. Emerging nanotechnology-based methods for water purification: a review. Desalin Water Treat. 2014;52:4089–4101.
- Zaman A, Das P, Banerjee P. Biosorption of dye molecules. In: Rathoure AK, Dhatwalia VK, Global IGI, editors; 2016. p. 51–74.
- Deshannavar UB, Ratnamala GM, Kalburgi PB, et al. Optimization, kinetic and equilibrium studies of disperse yellow 22 dye removal from aqueous solutions using Malaysian teak wood sawdust as adsorbent. Indian Chem Eng. 2016;58(1):12–28.
- Nasar A, Shakoor S. Remediation of dyes from industrial wastewater using low-cost adsorbents. In: Inamuddin, Al-Ahmed A, editors. Applications of Adsorption and Ion Exchange Chromatography in Waste Water Treatment. Materials Research Forum; 2017. p. 1–33.
- Y S C, J Y S, Lee H, et al. Decolorization and detoxification of wastewater containing industrial dyes by Bjerkandera adusta KUC9065. Water Air Soil Pollut. 2014;225(1801):1–10.
- Nandi BK, Goswami A, Purkait MK. Adsorption characteristics of brilliant green dye on kaolin, J. Hazard Mater. 2009;161:387–395.
- Pohanish RP. Sittig’s Handbook of Toxic and Hazardous Chemicals and Carcinogens, sixth ed. Waltham: William Andrew; 2012.
- Roy K, Verma KM, Vikrant K, et al. Removal of patent blue (V) dye using Indian bael shell biochar: characterization, application and kinetic studies. Sustainability. 2018;10(8):2669.
- Lin SH, Lin CM. Treatment of textile waste effluents by ozonation and chemical coagulation. Water Res. 1993;27:1743–1748.
- Chen X, Chen G, Yue PL. Novel electrode system for electroflotation of wastewater. Environ Sci Technol. 2002;36:778–783.
- Wang A, Qu J, Liu H, et al. Degradation of azo dye acid red 14 in aqueous solution by electrokinetic and electrooxidation process. Chemosphere. 2004;55:1189–1196.
- Ahmad AL, Tan LS, Shukor SRA. Dimethoate and atrazine retention from aqueous solution by nanofiltration membranes. J Hazard Mater. 2008;151:71–77.
- Greenlee LF, Lawler DF, Freeman BD, et al. Reverse osmosis desalination: water sources, technology, and today’s challenges. Water Res. 2009;43:2317–2348.
- Butani SA, Mane SJ. Coagulation/flocculation process for cationic, anionic dye removal using water treatment residuals – a review. Int J Sci Technol Manag. 2017;6(4):1–5.
- Anastopoulos I, Bhatnagar A, B H H, et al. A review on waste-derived adsorbents from sugar industry for pollutant removal in water and wastewater. J Mol Liq. 2017;240:179–188.
- Kumar M, Giri BS, K H K, et al. Performance of a biofilter with compost and activated carbon-based packing material for gas-phase toluene removal under extremely high loading rates Bioresource. Technol. 2019;285:121317.
- Al-Sakkari EG, Abdeldayem OM, Genina EE, et al. New alginate-based interpenetrating polymer networks for water treatment: A response surface methodology-based optimization study. Int J Biol Macromol. 2020;155:772–785.
- El Haddad M, Regti A, Laamari MR, et al. Calcined mussel shells as a new and eco-friendly biosorbent to remove textile dyes from aqueous solutions. J Taiwan Inst Chem Eng. 2014;45:533–540.
- Guerrero-Coronilla I, Morales-Barrera L, Cristiani-Urbina E. Kinetic, isotherm and thermodynamic studies of amaranth dye biosorption from aqueous solution onto water hyacinth leaves. J Environ Manage. 2015;152:99–108.
- Deaconu M, Senin R, Stoica R, et al. Adsorption decolorization technique of textile/leather – dye containing effluents. Int J Waste Resour. 2016;6(2):1–7.
- Aranda-García E, Cristiani-Urbina E. Effect of pH on hexavalent and total chromium removal from aqueous solutions by avocado shell using batch and continuous systems. Environ Sci Pollut Res. 2018;26(4):3157–3173.
- Al-Sakkari EG, Fouad M. Waste to Energy Trends and Prospects Waste-to-Energy Trends and Prospects: A Review. In: Ghosh S, editor. Waste Management and Resource Efficiency. Singapore: Springer; 2019. p. 673–684.
- Asadullah M, Asaduzzaman M, Kabir MS, et al. Chemical and structural evaluation of activated carbon prepared from jute sticks for Brilliant Green dye removal from aqueous solution. J Hazard Mater. 2010;174(1–3):437–443.
- Rehman R, Abbas A, Ayub A, et al. Comparative study of brilliant green dye adsorption from water by radish peels, jamun stem and coal. E. J. Environ. Agri. Food Chem. 2011;10:2531–2543.
- Yakout SM, Daifullah AAM, El-Reefy SA. Adsorption of naphthalene, phenanthrene and pyrene from aqueous solution using low-cost activated carbon derived from agricultural wastes. Adsorp Sci Technol. 2013;31(4):293–302.
- Pirbazari AE, Saberikhah E. Fe3O4- wheat straw: preparation, characterization and its application for methylene blue adsorption. Water Res Ind. 2014;7-8:23–37.
- de Carvalho HP, Huang J, Zhao M, et al. Improvement of methylene blue removal by electrocoagulation/banana peel adsorption coupling in a batch system. Alexandria Eng J. 2015;54:777–786.
- Lonappan L, Rouissi T, Das RK, et al. Adsorption of methylene blue on biochar microparticles derived from different waste materials. Waste Manage. 2016;49:537–544.
- Yadav OP, Hossain F, Karjagi CG, et al. Genetic improvement of maize in India – retrospect and prospects. Agric Res. 2015;4:325–338.
- El-Sayed G, Yehia MM, Asaad AA. Assessment of activated carbon prepared from corncob by chemical activation with phosphoric acid. Water Res Ind. 2014;7-8:66–75.
- Vafakhah S, Bahrololoom ME, Bazarganlari Dan R, et al. Removal of copper ions from electroplating effluent solutions with native corn cob and corn stalk and chemically modified corn stalk. J Environ Chem Eng. 2014;2:356–361.
- Tang S, Chen Y, Xie R, et al. Preparation of activated carbon from corn cob and its adsorption behavior on Cr(VI) removal. Water Sci Technol. 2016;73:2654–2661.
- Rathour R, Gupta J, Tyagi B, et al. . Biodegradation of pyrene in soil microcosm by Shewanella sp. ISTPL2, a psychrophilic, alkalophilic and halophilic bacterium. Bioresour. Technol Rep. 2018;4:129–136.
- Dutta S, Hossain MD, Hassan MM, et al. Decolourization of two industrial dyes by bacteria from paper and pulp mill effluents. Int Res J Biol Sci. 2014;3(12):51–55.
- Giri BS, Goswami M, Singh RS. Review on application of agro-waste biomass biochar for adsorption and bioremediation dye. Biomed J Sci Technol Res. 2017;1(7):1–3.
- Joint Committee on Powder Diffraction Standards. International Centre for Diffraction Data. Newt. Square, PA, Card; 1987. p. 25–1280.
- Rivera-Utrilla J, Bautista-Toledo I, Ferro-Garc´ıa MA, et al. Activated carbon surface modifications by adsorption of bacteria and their effect on aqueous lead adsorption. J Chem Technol Biotechnol. 2001;76(12):1209–1215.
- Sivarajasekar N, Baskar R. Adsorption of basic red 9 on activated waste Gossypium hirsutum seeds: process modeling, analysis and optimization using statistical design. J Ind Eng Chem. 2014b;20:2699–2709.
- RK S, Giri BS, Geed SR, et al. Combination of UV-Fenton oxidation process with biological technique for treatment of polycyclic aromatic hydrocarbons using Pseudomonas pseudoalcaligenes NRSS3 isolated from petroleum contaminated site. Indian J Experimental Biol. 2019;56(7):460–469.
- Ho YS, Mckay G. Pseudo-second order model for sorption processes. Process Biochem. 1999;34(5):451–465.
- Monod J. The growth of bacterial cultures. Annu Rev Microbiol. 1949;3:371–394.
- Bharti V, Shahi A, Geed SR, et al. Biodegradation of reactive orange 16 (RO-16) dye in packed bed bioreactor using seeds of Ashoka and Casuarina as packing medium. Indian J Biotechnol. 2017;16(2):216–221.
- Nwadiogbu JO, Ajiwe VIE, Okoye PAC. Removal of crude oil from aqueous medium by sorption on hydrophobic corncobs: equilibrium and kinetics studies. J Taibah Univ Sci. 2016;10:56–63.
- Kim SW, Koo BS, Ryu JW, et al. Bio-oil from the pyrolysis of palm and Jatropha wastes in a fluidized bed. Fuel Process Technol. 2013;108:18–124.
- Haddad E, Mamouni R, Saffaj N, et al. Removal of a cationic dye-basic red 12 from aqueous solution by adsorption onto animal bone meal. J Assoc Arab Univ Basic Appl Sci. 2018;12(1):48–54.
- Gao J, Kong D, Wang Y, et al. Production of mesoporous activated carbon from tea fruit peel residues and its evaluation of methylene blue removal from Aqueous Solutions. Bio, Resour. 2013;8:2145–2160.
- Anbia M, Salehi S. Removal of acid dyes from aqueous media by adsorption onto amino-functionalized nanoporous silica SBA-3. Dyes Pigm. 2012;94(1):1–9.
- Mane VS, Mall ID, Srivastava VC. Kinetic and equilibrium isotherm studies for the adsorptive removal of Brilliant Green dye from aqueous solution by rice husk ash, J. Environ Manage. 2007;84:390–400.
- Tavlieva MP, Genieva SD, Georgieva VG, et al. Kinetic study of brilliant green adsorption from aqueous solution onto white rice husk ash. J Colloid Int Sci. 2013;409:112–122.
- Wang XS, Zhou Y, Jiang Y, et al. The removal of basic dyes from aqueous solutions using agricultural by-products. J Hazard Mater. 2008;157(2–3):374–385.
- Khan T, Isa MH, Mustafa MRU, et al. Cr(VI) adsorption from aqueous solution by an agricultural waste based carbon. RSC Adv. 2016;6:56365–56374.
- Mashkoor F, Nasar A, Inamuddin, et al. Exploring the reusability of synthetically contaminated wastewater containing Crystal violet dye using Tectona grandis sawdust as a very low-cost adsorbent. Sci Rep. 2018;8:8314.
- Safa Y, Bhatti HN. Kinetic and thermodynamic modeling for the removal of Direct Red-31 and Direct Orange-26 dyes from aqueous solutions by rice husk. Desalination. 2011;272:313–322.
- Saha P. Assessment on the removal of methylene blue dye using tamarind fruit shell as bio-sorbent. Water Air Soil Pollut. 2010;213:287–299.
- Gan C, Liu Y, Tan X, et al. Effect of porous zinc-biochar nanocomposites on Cr(VI) adsorption from aqueous solution. Rsc Adv. 2015;5(44):35107–35115.
- Kolodynska D, Krukoswska-Bak J, Kazmierczak-Razna J, et al. Uptake of heavy metal ions from aqueous solutions by sorbents obtained from the spent ion exchange resins. Micropor Mesopor Mater. 2017;244:127–136.
- Geed SR, Kureel MK, Giri BS, et al. Performance evaluation of Malathion biodegradation in batch and continuous packed bed bioreactor. Bioresour Technol. 2017;227:56–65.
- Abu Talha M, Goswami M, Giri BS, et al. Bioremediation of Congo red dye in immobilized batch and continuous packed bed bioreactor by Brevibacillus parabrevis using coconut shell bio-char. Bioresour Technol. 2018;252:37–43.
- Janyasuthiwong S, Rene ER, Esposito G, et al. Effect of pH on Cu, Ni and Zn removal by biogenic sulfide precipitation in an inversed fluidized bed bioreactor. Hydrometallurgy. 2015;158:94–100.
- Marra A, Cesaro A, Rene ER, et al. Bioleaching of metals from WEEE shredding dust. J Environ Manage. 2018;210:180–190.
- Mohammad BT, Rene ER, Veiga MC, et al. Performance of a thermophilic gas-phase biofilter treating high BTEX loads under steady-and transient-state operation. Int Biodeter Biodeg. 2017;119:289–298.