
ABSTRACT
The screening and treatment of laryngeal squamous cell carcinoma (LSCC) still perplexes clinicians, making it necessary to explore new markers. To this end, this research examined the underlying molecular mechanism of LSCC based on high-throughput datasets (n = 249) from multiple databases. It also identified transcription factors (TFs) independently associated with LSCC prognosis. Through Gene Ontology and Kyoto Encyclopedia of Genes and Genomes analyses, differential expression genes of LSCC were deemed relevant to the extracellular matrix and its related structures or pathways, suggesting that the extracellular matrix plays an important role in LSCC. At the same time, several hub genes that may also have important roles in LSCC were identified via protein–protein interaction analysis, including CDC45, TPX2, AURKA, KIF2C, NUF, MUC1, MUC7, MUC4, MUC15, and MUC21. Eight unreported LSCC prognostic TFs – BCAT1, CHD4, FOXA2, GATA6, HNF1A, HOXB13, MAFF, and TCF4 – were screened via Kaplan–Meier curves. Cox analysis determined for the first time that HOXB13 expression and gender were independently associated with LSCC prognosis. Compared to control tissues, elevated expression of HOXB13 was found in LSCC tissues (standardized mean difference = 0.44, 95% confidence interval [0.13–0.76]). HOXB13 expression also makes it feasible to screen LSCC from non-LSCC (area under the curve = 0.77), and HOXB13 may play an essential role in LSCC by regulating HOXB7. In conclusion, HOXB13 may be a novel marker for LSCC clinical screening and treatment.
Introduction
Laryngeal carcinoma (LC) accounts for approximately 27% of head and neck cancer in the world [Citation1], and its main pathological subtype is laryngeal squamous cell carcinoma (LSCC). In China, there were 26,400 new cases of LC and 14,500 related deaths in 2015 [Citation2]. In 2018, the number of newly confirmed global cases of LC was more than 177,000, with more than 90,000 related deaths [Citation1]. In recent years, improvements in LC morbidity and mortality have not inspired optimism. Taking the United States as an example, from 1975 to 2011, the five-year survival rate for those with LC decreased from 66% to 63%, and, based on data from 2012, it is predicted that new incidences of and deaths from LC will have risen slightly again in 2020 [Citation3,Citation4].
At present, clinical strategies for treating LC include surgery, radiotherapy, chemotherapy, and systemic treatment [Citation5–8]. Early treatment has achieved good results with the 5-year disease-specific survival >75% [Citation9–11]. For patients with advanced LC, total laryngectomy may be the only option [Citation5,Citation12]; however, problems caused by this surgery (such as loss of speech and swallowing dysfunction) greatly reduce patient quality of life. Even worse, early LC screening is difficult due to the lack of obvious specific symptoms in most cases, which is conducive to tumor growth and spread [Citation13]. More than 70% of LC patients are diagnosed at stage III or IV [Citation14,Citation15], presenting further severe treatment challenges.
Current studies concerning LSCC pathogenesis have indicated that its occurrence and development may be related to drinking [Citation16], smoking [Citation15], asbestos exposure [Citation17], and human papillomavirus (HPV) infection [Citation18]. Other research has shown that LSCC pathogenesis may be related to multiple molecules, such as Shp2 [Citation19] and HPV16 [Citation18], and various forms of long noncoding RNA and microRNA [Citation18,Citation20]. The latter involve signaling pathway changes, such as Ras/Raf/Mek/Erk [Citation21], PTEN/Akt [Citation22], and PI3K/Akt [Citation23]. These indicate the complexity of LSCC pathogenesis, and the molecular pathological mechanisms of its occurrence and development are far from fully elucidated. Therefore, further study is needed to determine LSCC’s molecular pathological mechanism and explore new markers suitable for early clinical screening and treatment.
Transcription factors (TFs) help initiate eukaryote transcription and can regulate gene expression by interacting with cis-acting elements. Thus, they play an important role in tumorigenesis and development. Previous studies have shown multiple TFs associated with tumor prognosis. For example, SIX1 can promote the growth of breast cancer by enhancing the expression of multiple glycolytic genes; it is also considered a good predictor of breast cancer prognosis [Citation24]. GATA4 can promote the aging of lung cancer cells, and reduced GATA4 expression levels are associated with poor lung cancer prognosis [Citation25]. In this vein, studies concerning LSCC and TF have suggested that SOX2 overexpression may indicate poor patient prognosis [Citation26]; ATF-3 [Citation27] and Forkhead Box M1 [Citation28] are also closely related to LSCC prognosis. The potential importance of TFs in LSCC development makes exploring TFs related to LSCC prognosis (PRTFs) essential for elucidating the molecular pathological mechanism of LSCC and exploring new markers for screening and treatment of the disease.
Presently, high-throughput sequencing technologies (gene chips, RNA-Seq, etc.) are widely used in the biomedicine field. In this research, we collected high-throughput datasets from ArrayExpress (https://www.ebi.ac.uk/arrayexpress/), Gene Expression Omnibus (GEO, https://www.ncbi.nlm.nih.gov/geo/), Oncomine (https://www.oncomine.org/resource/login.html), and the Cancer Genome Atlas (TCGA). Based on analyses of these datasets and published reports by scholars, we explored the potential molecular mechanism of LSCC. Moreover, from the TF level, we identified new markers that may be suitable for clinical LSCC screening and treatment.
Materials and methods
Collection of gene chip data
LSCC-related datasets were retrieved and screened from the ArrayExpress, GEO, Oncomine, and TCGA. The overall retrieval strategy set to: ‘(laryn * OR glotti * OR (vocal muscle)) AND (mRNA OR gene).’
The inclusion criteria were as follows [1]: the research species was Homo sapiens [2]; the samples were taken from human larynx tissue [3]; the samples were pathologically diagnosed as LSCC; and [4] the dataset contained at least three of both LSCC and control samples. The exclusion criteria were as follows [1]: the study contained no cancer or control samples; and [2] the data were duplicated or incomplete.
Collection of RNA-Seq data and corresponding sample clinical information
The RNA-Seq dataset of TCGA was included and downloaded from the Genomic Data Commons Data Portal (https://portal.gdc.cancer.gov/repository). Clinical information about corresponding samples in the dataset was collected from the University of California, Santa Cruz, Xena database (http://xena.ucsc.edu/).
Underlying molecular mechanism of LSCC
Gene chip data were log2 (x + 1) log-transformed to screen for differential expression genes (DEGs). For RNA-Seq, raw count data was prepared for DEGs screening, while log2 (x + 1) log-transformed data were prepared to screen for and identify prognostic TFs. DEGs were screened by using the limma [Citation29] and edgeR [Citation30] packages of R (v3.6.1). The screening conditions were ‘| log2 (fold change) | ≥1,’ adjusted p value <0.05. The frequency of occurrence for upregulated-DEGs (up-DEGs) and downregulated-DEGs (down-DEGs) in all datasets was counted and sorted to select high-frequency DEGs in all datasets.
Gene Ontology (GO) analysis [Citation31] and Kyoto Encyclopedia of Genes and Genomes (KEGG) pathway enrichment analysis [Citation32] were conducted via the clusterProfiler package [Citation33] in R for the identified up-DEGs and down-DEGs, respectively. The visualization of GO and KEGG analyses were performed with the GOplot package [Citation34] in R. The protein–protein interaction (PPI) analysis for up-DEGs and down-DEGs was performed in the Search Tool for the Retrieval of Interacting Genes/Proteins database (https://string-db.org/cgi/input.pl?sessionId=Ya5dxqsyKmY7&input_page_show_search=off). Hub genes in the up-DEGs and down-DEGs were screened according to the Maximal Clique Centrality algorithm of the CytoHub plug-in in Cytoscape (v3.7.2) [Citation35].
Identification of TF markers for screening and treatment of LSCC
Binding Analysis for Regulation of Transcription (BART, https://faculty.virginia.edu/zanglab/bart/) contains more than 6,000 chromatin immunoprecipitation sequencing (ChIP-Seq) data. As a bioinformatics analysis tool, BART can be utilized to predict TFs of genes based on ChIP-Seq data [Citation36]. Through BART, we explored TFs of the up-DEGs with a p < 0.01, while these TFs were identified as upregulated-TFs (up-TFs). Similarly, downregulated-TFs (down-TFs) based on the down-DEGs were also selected.
Based on the median expression level of TFs, LSCC samples in the RNA-Seq dataset were divided into high-expression and low-expression groups. With these groups, the Kaplan–Meier curve, univariate Cox analysis, and multivariate Cox analysis were performed to identify LSCC PRTFs and TFs independently related to prognosis (PIRTFs). Forest plots with standardized mean difference (SMD) were applied to evaluate the expression of PIRTFs in LSCC and non-LSCC samples. Funnel plots with Egger’s test were utilized to evaluate publication bias of SMD results. The area under the curve (AUC) of the summary receiver-operating curve (sROC) was used to evaluate the screening effect of PIRTFs in distinguishing LSCC from non-LSCC samples. Forest plots, funnel plots, and sROC were drawn in Stata 15.
Prediction of potential PIRTF targets
Primary PIRTF targets were drawn from Cistrome Data Browser [Citation37] with scores of not less than two. Secondary PIRTF targets were based on the intersection of primary targets, up-DEGs of LSCC, and positively co-expressed genes (PCEGs, Pearson coefficient ≥0.3, p < 0.05) of PIRTFs. The JASPAR database [Citation38,Citation39] and MEME Suite online tool [Citation40] were utilized to explore matched sequences between PIRTF motifs and promoter regions of secondary targets. Through secondary targets, potential PIRTF targets were screened via ChIP-Seq data in Cistrome Data Browser [Citation37].
Statistical analysis
A 95% confidence interval (CI) of SMD that does not contain zero indicates that the SMD result is statistically significant. An Egger’s test p value of greater than 0.1 indicates no publication bias of SMD results. The range of AUC is 0 to 1, and the closer the AUC is to 1, the greater the effect of PIRTFs in screening LSCC. Unless otherwise specified, a p value lower than 0.05 in this study indicates statistically significant difference.
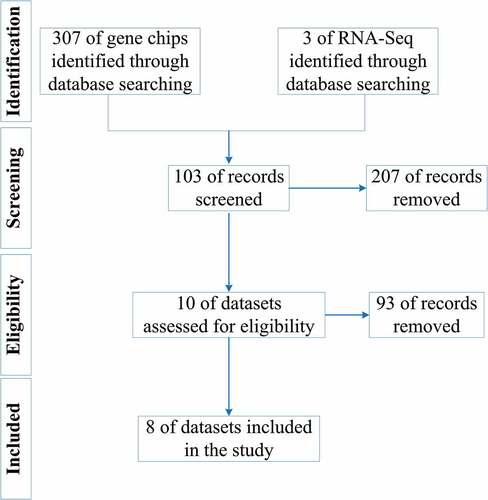
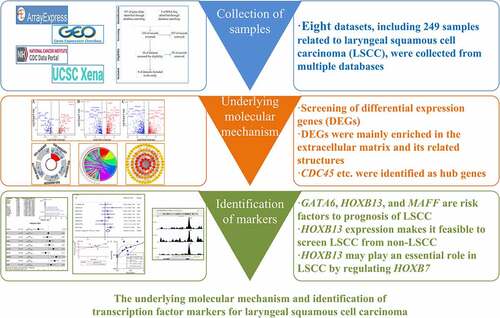
shows the overall study design. The processes for selecting the gene chips and RNA-Seq datasets are illustrated in .
Figure 1. Flow chart of this study. LSCC: laryngeal squamous cell carcinoma; GO: Gene Ontology; KEGG: Kyoto Encyclopedia of Genes and Genomes; PPI: protein-protein interaction; DEGs: differential expression genes; TF: transcription factor; ChIP-Seq, chromatin immunoprecipitation sequencing
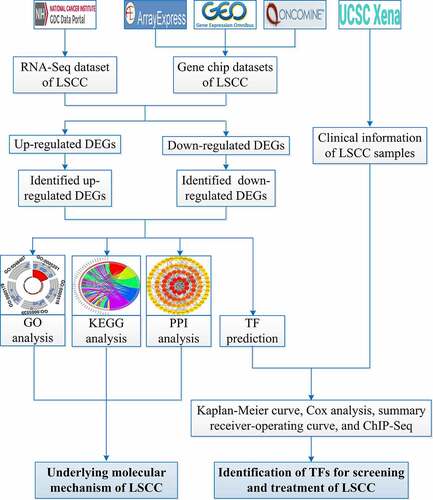
Figure 2. Screening processes for datasets included in the study
Results
Collection of gene chip data
As of 30 March 2020, seven gene chip datasets (E-MEXP-44, GSE29330, GSE51985, GSE58911, GSE59102, GSE84957, and GSE107591) were included in the research, containing 70 LSCC samples and 56 non-LSCC control samples. The basic information for each gene chip is shown in .
Table 1. Basic information of each dataset
Collection of RNA-Seq data and corresponding sample clinical information
The RNA-Seq data, containing 123 samples – 111 LSCC samples and 12 non-LSCC control samples – and clinical information for these samples, were downloaded from the Xena database; basic information about the RNA-Seq dataset is shown in .
DEGs identification
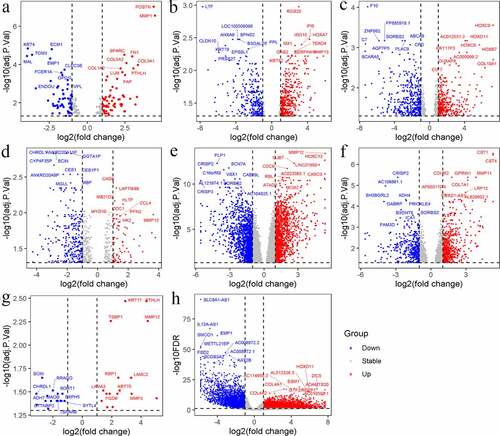
The up-DEGs and down-DEGs of each dataset were screened (, ). The researchers excluded genes with inconsistent expression differences between datasets – that is, genes whose expressions were upregulated in one dataset and downregulated in another. To be categorized as an identified up-DEG or down-DEG, genes were required to have been found in no fewer than three of the eight datasets. Using this metric, 458 identified up-DEGs and 493 identified down-DEGs were selected.
Figure 3. Volcano plots of differential expression genes in E-MEXP-44 (a), GSE29330 (b), GSE51985 (c), GSE58911 (d), GSE59102 (e), GSE84957 (f), GSE107591 (g) and TCGA (h). Up: up-regulated genes; Down: down-regulated genes
GO analysis
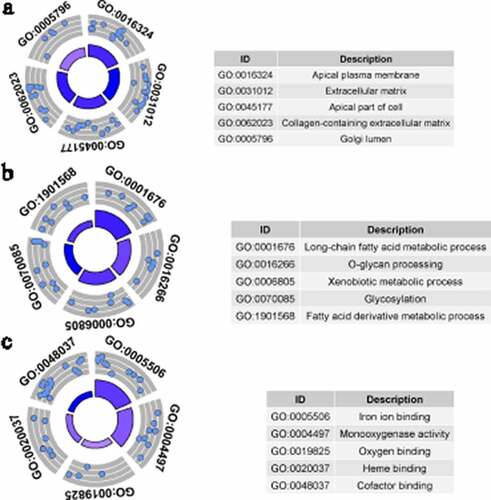
GO analysis was conducted by studying three types of GO terms: cellular components (CC), biological processes (BP), and molecular functions (MF). GO terms with p < 0.05, and at least five enriched genes, were considered statistically significant. display the five most enriched GO terms based on analysis of identified up-DEGs and down-DEGs. Based on identified up-DEGs, the top-enriched GO term of CC was ‘extracellular matrix,’ while those of BP and MF were ‘extracellular structure organization’ and ‘extracellular matrix structural constituent,’ respectively. For identified down-DEGs, the three top-enriched GO terms were ‘apical plasma membrane’ (CC), ‘long-chain fatty acid metabolic process’ (BP), and ‘iron ion binding’ (MF).
Figure 4. Gene Ontology (GO) analysis for identified up-regulated differential expression genes. Cellular components (a), biological processes (b) and molecular functions (c) of identified up-regulated differential expression genes. The blue nodes in the concentric circles represent genes clustered in specific GO terms. The larger size and darker color of the internal departments represent the more significant enrichment of GO term
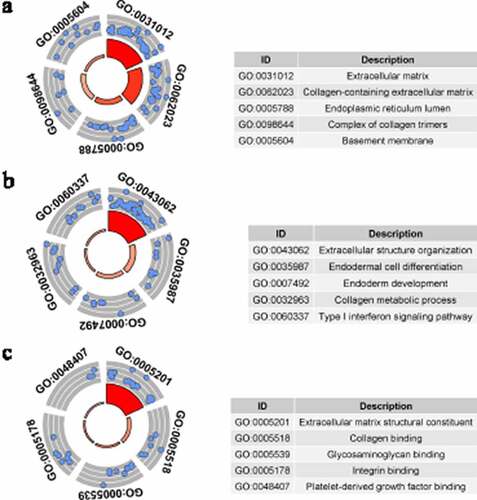
Figure 5. Gene Ontology (GO) analysis for identified down-regulated differential expression genes. Cellular components (a), biological processes (b) and molecular functions (c) of identified down-regulated differential expression genes. The blue nodes in the concentric circles represent genes clustered in specific GO terms. The larger size and darker color of the internal departments represent the more significant enrichment of GO term
KEGG pathway enrichment analysis
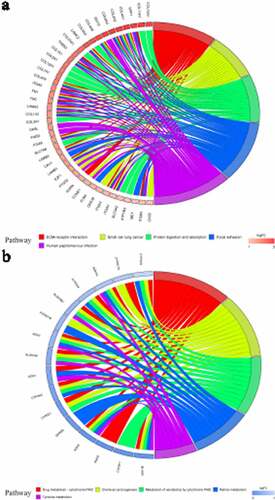
Through KEGG pathway enrichment analysis, quite a few enriched signaling pathways were related to tumorigenesis and tumor development (). For example, the ‘ECM-receptor interaction’ and ‘focal adhesion’ signaling pathways were found for identified up-DEGs, while ‘chemical carcinogenesis’ and ‘tyrosine metabolism’ were found for identified down-DEGs. ) display the five most enriched KEGG signaling pathways for identified up-DEGs and down-DEGs, respectively.
Figure 6. Kyoto Encyclopedia of Genes and Genomes (KEGG) analysis of identified up-regulated differential expression genes (a) and identified down-regulated differential expression genes (b). Different color bands correspond to different KEGG enrichment pathways
PPI analysis
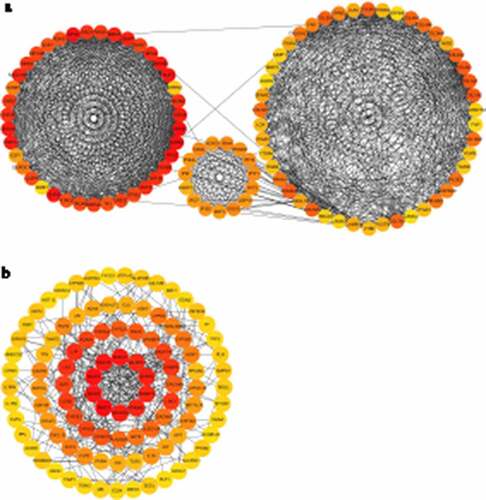
PPI analysis based on the identified up-DEGs showed that the top five hub genes related to LSCC were CDC45, TPX2, AURKA, KIF2C, and NUF2 ()). PPI analysis based on identified down-DEGs indicated that the top five LSCC-related hub genes were all mucin genes: MUC1, MUC7, MUC4, MUC15, and MUC21 ()).
Figure 7. Protein-protein interaction (PPI) analysis for identified up-regulated differential expression genes (a) and identified down-regulated differential expression genes (b)
Transcription factor prediction
By using the BART tool to predict TFs related to the identified up-DEGs and down-DEGs, a total of 81 up-TFs and 101 down-TFs were screened, according to the threshold p < 0.01. After excluding seven duplicate TFs, 175 TFs were finally predicted for subsequent analysis.
Identification of PRTFs and PIRTFs
Each of the eight datasets contained some of the predicted 175 TFs. Therefore, the researchers used the RNA-Seq dataset to identify PRTFs and PIRTFs, as it included most of the genes (69 of the 81 up-TFs and 96 of the 101 down-TFs) and the most complete clinical information. The 105 samples (Supplementary Material 1) with complete clinical information were included for prognosis analyses.
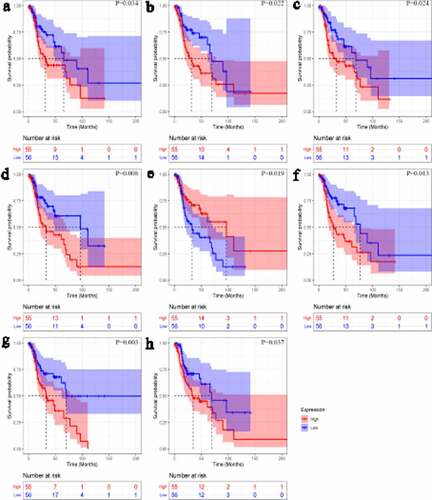
Kaplan–Meier curves showed that one up-TF (CHD4) and seven down-TFs (BCAT1, FOXA2, GATA6, HNF1A, HOXB13, MAFF, and TCF4) were significantly related to the overall survival rate of LSCC patients (p < 0.05, ). All eight TFs were identified as PRTFs.
Figure 8. Kaplan-Meier curves of transcription factors related to laryngeal squamous cell carcinoma prognosis. CHD4 (a); BCAT1 (b); FOXA2 (c); GATA6 (d); HNF1A (e); HOXB13 (f); MAFF (g); TCF4 (h)
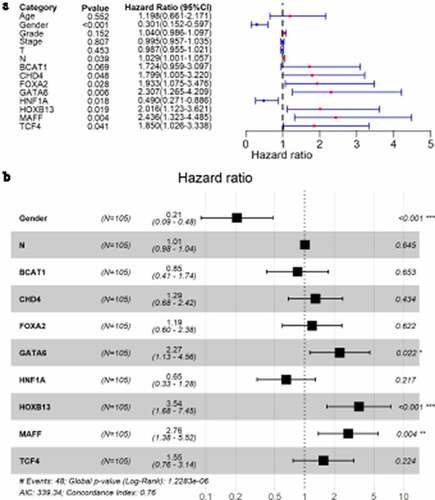
Through univariate Cox analysis, LSCC patients with low HNF1A expression had a higher risk of death than those with high HNF1A expression (hazard ratio <1; )), suggesting HNF1A may be a protective factor to LSCC prognosis. The other six (except BCAT1, with 95% CI of its hazard ratio including 1) PRTFs – CHD4, FOXA2, GATA6, HOXB13, MAFF, and TCF4 – were risk factors to LSCC prognosis (hazard ratios >1; )). Moreover, in clinical parameters, gender (male) was identified as a protective factor against LSCC prognosis. In multivariate Cox analysis, the results showed that three PRTFs – GATA6, HOXB13 and MAFF – were LSCC PIRTFs and therefore risk factors (p < 0.05; )).
Figure 9. Forest plots for identifying transcription factors independently related to LSCC prognosis. A: univariate Cox analysis; B: multivariate Cox analysis. N: number of samples; * p < 0.05; ** p < 0.005; *** p < 0.001
PIRTF expression in LSCC and their effects on LSCC screening
No difference in GATA6 or MAFF expression could be seen between LSCC tissues and control tissues (95% CI contained zero; Supplementary materials 2A and 3A). No obvious publication bias was found in the SMD results (p value of Egger’s test >0.1; Supplementary materials 2B and 3B). Unlike GATA6 and MAFF, HOXB13 was significantly upregulated in LSCC tissues (SMD > 0, 95% CI [0.13–0.76]; )). A p value of Egger’s test >0.1 indicated no obvious publication bias in the SMD results ()).
Figure 10. Expression of HOXB13 and its screening effect in laryngeal squamous cell carcinoma (LSCC). A: forest plot with standard mean difference (SMD) for evaluating deferential expression of HOXB13 between LSCC tissues and non-LSCC tissues. B: funnel plot with Egger’s test; C: summary receiver-operating curve
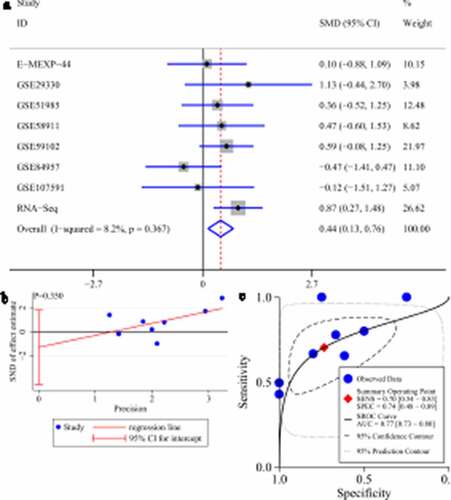
Due to the differential expression of HOXB13 between LSCC tissues and non-LSCC tissues, we performed sROC analysis based on HOXB13 expression to detect its effect in screening LSCC. The AUC value of the sROC revealed that HOXB13 expression made it feasible to distinguish LSCC tissues from non-LSCC tissues ()), suggesting a screening effect in LSCC.
Prediction of potential HOXB13 targets
As HOXB13 was found to be a highly expressed PIRTF of LSCC that made LSCC screening feasible, HOXB13 may play an important role in LSCC. To analyze the mechanism of HOXB13 in LSCC, we explored potential HOXB13 targets.
In Cistrome Data Browser, the high-quality and HOXB13-related samples (n = 18) revealed 17 genes – ADD3, DNAH5, EHF, HOXA3, HOXA5, HOXA6, HOXA7, HOXA9, HOXC4, HOXC5, HOXC6, HOXC8, KLK2, LOC107984512, PHTF2, SLC36A1, and TMEM60 – as primary potential HOXB13 targets with regulatory potential scores ≥2 (data not shown). Based on these eight datasets, 462 PCEGs of HOXB13 were selected (data not shown), provided that they showed positive co-expression with HOXB13 in more than three-eighths of the datasets. As shown above, we selected 458 identified up-DEGs. Among the 17 genes, three secondary targets – HOXB7, HOXC8, and HOXC9 – were identified through the intersection of the potential targets of HOXB13, PCEGs of HOXB13, and identified up-DEGs (Supplementary material 4).
A matched sequence was found between the motif of HOXB13 and the promoter region of HOXB7 (Supplementary material 5). In addition, six matched sequences were identified between the motif of HOXB13 and the promoter region HOXC9 (Supplementary material 5), while no matched sequence was identified between the motif of HOXB13 and the promoter region of HOXC8. In the three genes, some ChIP-Seq peaks of HOXB13 were located upstream of the transcription start site of HOXB7 (Supplementary material 6). This strongly suggests that HOXB7 was likely a target of HOXB13.
As with HOXB13, HOXB7 was upregulated in LSCC (SMD > 0; Supplementary material 7A). There was a trend that LSCC patients with high HOXB13 and HOXB7 expression had poorer prognoses than other LSCC patients. For example, compared with LSCC patients with low expression of both HOXB13 and HOXB7, those with high HOXB13 and HOXB7 expression showed poorer prognosis (p = 4.161e-04; Supplementary material 7B).
Discussion
Current research has revealed that multiple TFs play an important role in tumor occurrence and development, and they may be key to screening and treating tumors [Citation41–43]. Therefore, as this study explored and identified LSCC PIRTFs, it was encouraging to discover new markers suitable for early clinical LSCC screening and treatment.
The results have indicated that identified LSCC DEGs were enriched in several tumor-related KEGG signaling pathways, suggesting that these pathways may have importance regarding LSCC. At the same time, some hub genes obtained via PPI analysis were reported in other tumor-related studies, suggesting their possible importance in LSCC development. The researchers screened eight PRTFs and three PIRTFs of LSCC via Kaplan-Meier curves and Cox analyses, which were unreported in LSCC. Moreover, HOXB13 expression made it feasible to distinguish LSCC tissues from non-LSCC tissues through an sROC. Overall, TF HOXB13 was found to be a potential and novel marker for LSCC screening and treatment.
Based on GO, KEGG, and PPI analyses, the researchers studied the underlying molecular mechanism of LSCC, producing results that showed some identified DEGs might play important roles in LSCC. While the top GO terms for identified down-DEGs were appreciably different, those of identified up-DEGs were relevant to the extracellular matrix. Such results indicate that extracellular matrices may be a future research direction for LSCC. The KEGG analysis showed that identified up-DEGs were enriched in ‘the ECM-receptor interaction’ and ‘focal adhesion’ signaling pathways. Identified down-DEGs were enriched in ‘chemical carcinogenesis’ and ‘tyrosine metabolism.’ Interestingly, previous research has shown these signaling pathways to be closely related to tumor development [Citation44–46], so the current researchers speculated that changes in these pathways might be important factors in LSCC. PPI analysis of the identified up-DEGs found that CDC45, TPX2, AURKA, KIF2C, and NUF2 might act as hub genes during LSCC development. Moreover, MUC1, MUC7, MUC4, MUC15, and MUC21 were found to be hub genes among the identified down-DEGs. It is also interesting that some of these hub genes are closely related to tumors, such as CDC45 [Citation47], TPX2 [Citation48], ARID1A [Citation49], MUC1, and MUC4 [Citation50]. Thus, some identified DEGs may be key in LSCC occurrence and development, but experimental research is required to confirm this.
To further explore key TFs for LSCC, the researchers separately predicted the TFs related to identified up-DEGs and down-DEGs. In these TFs, PRTFs of LSCC were selected. Eight PRTFs – BCAT1, CHD4, FOXA2, GATA6, HNF1A, HOXB13, MAFF, and TCF4 – had a statistically significant connection to the overall survival rate of patients with LSCC. Among them, as far as we know, in addition to GATA6 [Citation51], HOXB13 [Citation52], and TCF4 [Citation53], there were no reports on the remaining five PRTFs in the published LSCC research. This indicates novelty of our study to some extent. Furthermore, with independent prognostic value in LSCC, the three PIRTFs – GATA6, HOXB13 and MAFF – were further analyzed in the current research.
GATA6, a member of the GATA family [Citation54], is closely associated with the occurrence and development of multiple cancers. For instance, reduced GATA6 expression may inhibit gastric cancer progression [Citation55]. GATA6 expression is related to poor prognosis in ovarian cancer [Citation56]. However, GATA6 may also exert an inhibitory effect on lung adenocarcinoma [Citation57], indicating varying effects in tumors across cancer types. Previous reports concerning LSCC have also suggested that the evaluated expression of GATA6 promotes the development of LSCC [Citation51,Citation58]. The current study further shows that GATA6 is an independent risk factor for LSCC prognosis, making it a possible marker for LSCC treatment.
Another PIRTF of LSCC, MAFF, has also been reported in several cancers other than LSCC. For example, bladder cancer patients with high MAFF expression have a higher survival rate [Citation59], suggesting a cancer suppression effect, yet it remains controversial whether MAFF has a tumor suppressor effect in hepatocellular carcinoma. For example, Tsuchiya et al. identified that knocking down MAFF expression would inhibit the invasion of hepatocellular carcinoma cells [Citation60]; while Wu et al. believed that MAFF exerts a tumor suppressor effect via the circ-ITCH/miR-224-5p axis in hepatocellular carcinoma [Citation61]. In this study, MAFF was identified as a risk factor for LSCC prognosis, which has not, to the best of our knowledge been reported before. This controversy over whether MAFF has a cancer-promoting or anti-tumor effect makes it necessary to confirm our findings with larger samples and experiments.
Although GATA6 and MAFF are closely related to the prognosis of LSCC patients, there is no differential expression of either PIRTF between LSCC tissues and control tissues. High expression of GATA6 in LSCC has been reported [Citation51,Citation58], but this study’s larger samples did not show GATA6 was differentially expressed in LSCC tissues and control tissues. Similarly, no differential expression of MAFF was detected in LSCC. These findings suggest that, GATA6 and MAFF may have screening limitations for LSCC, although they were independent risk factors of the prognosis of LSCC patients. By contrast, a PIRTF of LSCC, HOXB13, had not only an upregulated expression in LSCC, but also had a certain effect on LSCC screening.
HOXB13 plays an important role in the occurrence and development of multiple tumors, including LSCC. It is located on human chromosome 17q21.32, and the TF it encodes is one of the members of the homeobox gene family [Citation62]. High HOXB13 expression is associated with poor survival rates for patients with glioblastoma, which may be due to the upregulation of long noncoding RNA HOXC-AS3 transcription [Citation63]. In malignant striated muscle tumors, HOXB13 plays a role in promoting cancer by interfering with the differentiation of mesenchymal stem cells [Citation64]. Previous research found HOXB13 was upregulated in LSCC [Citation52], which is consistent with the findings of this study via SMD calculation. Our study further revealed that high HOXB13 expression is a risk factor for LSCC prognosis. Due to HOXB13 expression, drug resistance can be seen in some cancers, such as breast cancer [Citation65] and glioblastoma [Citation63]. These findings suggest the cancer-promoting effect of HOXB13. However, other scholars believed that HOXB13 may exert a tumor suppression effect given its relation to poor prognosis of right colon cancer [Citation66] and gastric cancer [Citation67]. In short, these reports provide a certain direction for studying the role and molecular mechanism of HOXB13 in the above-mentioned tumors, indicating that HOXB13 may be a potential screening and treatment marker for them. However, the mechanism of HOXB13 in LSCC still needs to be further studied.
The current research suggests that HOXB13 may play an essential role in LSCC by regulating HOXB7. We reported for the first time that HOXB7 is a potential target of HOXB13. HOXB7 is not only positively correlated with HOXB13 expression, but a binding sequence between its promoter region and the HOXB13 motif can also be seen. In addition, there is a ChIP-Seq peak of HOXB13 in the promoter region of HOXB7. These strongly suggest the potential regulatory relationship of HOXB13 to HOXB7. In addition, compared with LSCC patients with low HOXB13 and HOXB7 expression, those with high expression of both HOXB13 and HOXB7 showed poorer prognosis. Collectively, the current research strongly indicates that HOXB13 may affect the occurrence and development of LSCC by regulating HOXB7. Nevertheless, this has not been reported before and requires confirmation by further research.
This study did have some limitations, including a relatively small sample size and limited available data, preventing the molecular mechanisms of LSCC PIRTFs from being explored in detail. In future, in vivo and in vitro experiments on LSCC PIRTFs, especially HOXB13, will be necessary to confirm their roles and molecular mechanisms.
Conclusion
This research indicates that identified DEGs may play an important role in LSCC via the extracellular matrix and its related structures or pathways. CDC45, TPX2, AURKA, KIF2C, and NUF2 – as well as the mucin family (MUC1, MUC7, MUC4, MUC15, and MUC21) – are likely LSCC hub genes. The authors also screened eight LSCC PRTFs for the first time – BCAT1, CHD4, FOXA2, GATA6, HNF1A, HOXB13, MAFF and TCF4. HOXB13 was determined to be an essential LSCC PIRTF, and it may be used as a new marker for the early clinical screening and treatment of LSCC.
Research highlights
1. Explored the potential molecular mechanism of LSCC via differential expression genes.
2. GATA6, HOXB13 and MAFF were risk factors in LSCC prognosis.
3. HOXB13 may be a novel marker for LSCC clinical screening and treatment.
4. HOXB13 may play an essential role in LSCC by regulating HOXB7.
5. The male gender was identified as an independent prognostic factor for LSCC patients.
Authors’ contributions
Guo-Sheng Li, Wei-Ying He and Li-Yuan Xie: data curation, statistical analysis, and manuscript preparation.
Bin-Yu Mo, Su-Ning Huang, Zhu-Xin Wei, Ya-Si Su, Yue Liang, Li Yang, Cheng Ye, Wen-Bin Dai and Lin Ruan: funding acquisition, study design, supervision, and manuscript revision.
Ethical approval
Not applicable for the research.
Suppelemtary material
Supplemental data for this article can be accessed here.
Abbreviations
LC: laryngeal carcinoma; LSCC: laryngeal squamous cell carcinoma; TF: transcription factor; GEO: Gene Expression Omnibus; TCGA: the Cancer Genome Atlas; PRTF: transcription factor related to prognosis; DEG: differential expression gene; up-DEG: upregulated-differential expression gene; down-DEGs.: downregulated-differential expression gene; GO: Gene Ontology; KEGG: Kyoto Encyclopedia of Genes and Genomes; PPI: protein–protein interaction; BART: Binding Analysis for Regulation of Transcription; ChIP-Seq: chromatin immunoprecipitation sequencing; up-TF: upregulated-transcription factor; down-TF: downregulated-transcription factor; PIRTF: transcription factor independently related to prognosis; SMD: standardized mean difference; AUC: area under the curve; sROC: summary receiver-operating curve; PCEGs: positive co-expression genes; CI: confidence interval; CC: cellular components; BP: biological processes; MF: molecular functions
Acknowledgements
The results shown in the study are in part based upon data generated by the Cancer Genome Atlas Program Research Network: https://www.cancer.gov/tcga. We sincerely thank the anonymous reviewers for their careful work and thoughtful suggestions that helped improve this paper substantially.
Data availability statement
All datasets used in the research can be found in ArrayExpress (https://www.ebi.ac.uk/arrayexpress/, containing the dataset of E-MEXP-44), Gene Expression Omnibus (https://www.ncbi.nlm.nih.gov/geo/, containing datasets of GSE29330, GSE51985, GSE58911, GSE59102, GSE84957, GSE107591), and the Genomic Data Download from Commons Data Portal (https://portal.gdc.cancer.gov/repository, containing an RNA-Seq dataset related to laryngeal squamous cell carcinoma) databases.
Disclosure statement
The authors report no conflict of interest.
Additional information
Funding
References
- Bray F, Ferlay J, Soerjomataram I, et al. Global cancer statistics 2018: GLOBOCAN estimates of incidence and mortality worldwide for 36 cancers in 185 countries. CA Cancer J Clin. 2018;68(6):394–424.
- Chen W, Zheng R, Baade PD, et al. Cancer statistics in China, 2015. CA Cancer J Clin. 2016;66(2):115–132.
- Siegel R, Naishadham D, Jemal A. Cancer statistics, 2012. CA Cancer J Clin. 2012;62(1):10–29.
- Siegel RL, Miller KD, Jemal A. Cancer statistics, 2020. CA Cancer J Clin. 2020;70(1):7–30.
- Steuer CE, El-Deiry M, Parks JR, et al. An update on larynx cancer. CA Cancer J Clin. 2017;67(1):31–50.
- Dietz A, Wichmann G, Kuhnt T, et al. Induction chemotherapy (IC) followed by radiotherapy (RT) versus cetuximab plus IC and RT in advanced laryngeal/hypopharyngeal cancer resectable only by total laryngectomy-final results of the larynx organ preservation trial DeLOS-II. Ann Oncol. 2018;29(10):2105–2114.
- Wang K, Tang J, Liu X, et al. UBR5 regulates proliferation and radiosensitivity in human laryngeal carcinoma via the p38/MAPK signaling pathway. Oncol Rep. 2020;44(2):685–697.
- Wang W, Sun Y, Li X, et al. Dihydroartemisinin prevents distant metastasis of laryngeal carcinoma by inactivating STAT3 in cancer stem cells. Med Sci Monit. 2020;26:e922348.
- Haapaniemi A, Koivunen P, Saarilahti K, et al. Laryngeal cancer in Finland: a 5-year follow-up study of 366 patients. Head Neck. 2016;38(1):36–43.
- Pedregal-Mallo D, Sanchez Canteli M, Lopez F, et al. Oncological and functional outcomes of transoral laser surgery for laryngeal carcinoma. Eur Arch Otorhinolaryngol. 2018;275(8):2071–2077.
- Cetinayak O, Dogan E, Kuru A, et al. Outcome of early-stage glottic laryngeal carcinoma patients treated with radical radiotherapy using different techniques. J Oncol. 2019;2019:8640549.
- Zhu X, Zhao M, Zhou L, et al. Significance of examined lymph nodes number and metastatic lymph nodes ratio in overall survival and adjuvant treatment decision in resected laryngeal carcinoma. Cancer Med. 2020;9(9):3006–3014.
- Nocini R, Molteni G, Mattiuzzi C, et al. Updates on larynx cancer epidemiology. Chin J Cancer Res. 2020;32(1):18–25.
- Ciolofan MS, Vlaescu AN, Mogoanta CA, et al. Clinical, histological and immunohistochemical evaluation of larynx cancer. Curr Health Sci J. 2017;43(4):367–375.
- Menach OP, Patel A, Oburra HO. Demography and histologic pattern of laryngeal squamous cell carcinoma in kenya. Int J Otolaryngol. 2014;2014:507189.
- Praud D, Rota M, Rehm J, et al. Cancer incidence and mortality attributable to alcohol consumption. Int J Cancer. 2016;138(6):1380–1387.
- Kang DM, Kim JE, Kim YK, et al. Occupational burden of asbestos-related diseases in Korea, 1998-2013: asbestosis, mesothelioma, lung cancer, laryngeal cancer, and ovarian cancer. J Korean Med Sci. 2018;33(35):e226.
- Yang D, Shi Y, Tang Y, et al. Effect of HPV infection on the occurrence and development of laryngeal cancer: a review. J Cancer. 2019;10(19):4455–4462.
- Zhang J, Zhang F, Niu R. Functions of Shp2 in cancer. J Cell Mol Med. 2015;19(9):2075–2083.
- Lan L, Cao H, Chi W, et al. Aberrant DNA hypermethylation-silenced LINC00886 gene accelerates malignant progression of laryngeal carcinoma. Pathol Res Pract. 2020;216(4):152877.
- Gu J, Han T, Ma RH, et al. SHP2 promotes laryngeal cancer growth through the Ras/Raf/Mek/Erk pathway and serves as a prognostic indicator for laryngeal cancer. Int J Oncol. 2014;44(2):481–490.
- Wang S, Guo D, Li C. Downregulation of miRNA-26b inhibits cancer proliferation of laryngeal carcinoma through autophagy by targeting ULK2 and inactivation of the PTEN/AKT pathway. Oncol Rep. 2017;38(3):1679–1687.
- Tian L, Tao ZZ, Ye HP, et al. Over-expression of MEOX2 promotes apoptosis through inhibiting the PI3K/Akt pathway in laryngeal cancer cells. Neoplasma. 2018;65(5):745–752.
- Li L, Liang Y, Kang L, et al. Transcriptional regulation of the warburg effect in cancer by SIX1. Cancer Cell. 2018;33(3):368–85 e7.
- Gao L, Hu Y, Tian Y, et al. Lung cancer deficient in the tumor suppressor GATA4 is sensitive to TGFBR1 inhibition. Nat Commun. 2019;10(1):1665.
- Yang N, Hui L, Wang Y, et al. Overexpression of SOX2 promotes migration, invasion, and epithelial-mesenchymal transition through the Wnt/beta-catenin pathway in laryngeal cancer Hep-2 cells. Tumour Biol. 2014;35(8):7965–7973.
- Feng J, Sun Q, Wu T, et al. Upregulation of ATF-3 is correlated with prognosis and proliferation of laryngeal cancer by regulating Cyclin D1 expression. Int J Clin Exp Pathol. 2013;6(10):2064–2070.
- Jiang LZ, Wang P, Deng B, et al. Overexpression of Forkhead Box M1 transcription factor and nuclear factor-kappaB in laryngeal squamous cell carcinoma: a potential indicator for poor prognosis. Hum Pathol. 2011;42(8):1185–1193.
- Ritchie ME, Phipson B, Wu D, et al. limma powers differential expression analyses for RNA-sequencing and microarray studies. Nucleic Acids Res. 2015;43(7):e47.
- Robinson MD, McCarthy DJ, Smyth GK. edgeR: a Bioconductor package for differential expression analysis of digital gene expression data. Bioinformatics. 2010;26(1):139–140.
- Gene Ontology Consortium. Gene ontology consortium: going forward. Nucleic Acids Res. 2015;43(Databaseissue):D1049–D56.
- Kanehisa M, Furumichi M, Tanabe M, et al. KEGG: new perspectives on genomes, pathways, diseases and drugs. Nucleic Acids Res. 2017;45(D1):D353–D61.
- Yu G, Wang L-G, Han Y, et al. clusterProfiler: an R package for comparing biological themes among gene clusters. OMICS. 2012;16(5):284–287.
- Walter W, Sánchez-Cabo F, Ricote M. GOplot: an R package for visually combining expression data with functional analysis. Bioinformatics. 2015;31(17):2912–2914.
- Shannon P, Markiel A, Ozier O, et al. Cytoscape: a software environment for integrated models of biomolecular interaction networks. Genome Res. 2003;13(11):2498–2504.
- Wang S, Zang C, Xiao T, et al. Modeling cis-regulation with a compendium of genome-wide histone H3K27ac profiles. Genome Res. 2016;26(10):1417–1429.
- Zheng R, Wan C, Mei S, et al. Cistrome data browser: expanded datasets and new tools for gene regulatory analysis. Nucleic Acids Res. 2019;47(D1):D729–D35.
- Stormo GD. Modeling the specificity of protein-DNA interactions. Quant Biol. 2013;1(2):115–130.
- Wasserman WW, Sandelin A. Applied bioinformatics for the identification of regulatory elements. Nat Rev Genet. 2004;5(4):276–287.
- Grant CE, Bailey TL, Noble WS. FIMO: scanning for occurrences of a given motif. Bioinformatics. 2011;27(7):1017–1018.
- Cox OT, Edmunds SJ, Simon-Keller K, et al. PDLIM2 is a marker of adhesion and beta-catenin activity in triple-negative breast cancer. Cancer Res. 2019;79(10):2619–2633.
- Xu Y, Yu W, Yang T, et al. Overexpression of BCAT1 is a prognostic marker in gastric cancer. Hum Pathol. 2018;75:41–46.
- Wu CJ, Sundararajan V, Sheu BC, et al. Activation of STAT3 and STAT5 signaling in epithelial ovarian cancer progression: mechanism and therapeutic opportunity. Cancers (Basel). 2019;12(1). DOI:10.3390/cancers12010024
- Sun L, Zhang L, Chen J, et al. Activation of tyrosine metabolism in CD13+ cancer stem cells drives relapse in hepatocellular carcinoma. Cancer Res Treat. 2020;52(2):604–621.
- Bao Y, Wang L, Shi L, et al. Transcriptome profiling revealed multiple genes and ECM-receptor interaction pathways that may be associated with breast cancer. Cell Mol Biol Lett. 2019;24:38.
- Shen J, Cao B, Wang Y, et al. Hippo component YAP promotes focal adhesion and tumour aggressiveness via transcriptionally activating THBS1/FAK signalling in breast cancer. J Exp Clin Cancer Res. 2018;37(1):175.
- Huang J, Li Y, Lu Z, et al. Analysis of functional hub genes identifies CDC45 as an oncogene in non-small cell lung cancer - a short report. Cell Oncol (Dordr). 2019;42(4):571–578.
- Yan L, Li Q, Yang J, et al. TPX2-p53-GLIPR1 regulatory circuitry in cell proliferation, invasion, and tumor growth of bladder cancer. J Cell Biochem. 2018;119(2):1791–1803.
- Wu C, Lyu J, Yang EJ, et al. Targeting AURKA-CDC25C axis to induce synthetic lethality in ARID1A-deficient colorectal cancer cells. Nat Commun. 2018;9(1):3212.
- Bhatia R, Gautam SK, Cannon A, et al. Cancer-associated mucins: role in immune modulation and metastasis. Cancer Metastasis Rev. 2019;38(1–2):223–236.
- Zhao X, Zhang W, Ji W. miR-181a targets GATA6 to inhibit the progression of human laryngeal squamous cell carcinoma. Future Oncol. 2018;14(17):1741–1753.
- Sun C, Han C, Wang P, et al. HOXB9 expression correlates with histological grade and prognosis in LSCC. Biomed Res Int. 2017;2017:3680305.
- Kayisaier K, Abulajiang T, Tang L, et al. Effect of miR-340-5p on proliferation of laryngeal cancer Hep2 cells and its intrinsic molecular mechanism. Lin Chung Er Bi Yan Hou Tou Jing Wai Ke Za Zhi. 2020;34(2):140–145.
- Sun Z, Yan B. Multiple roles and regulatory mechanisms of the transcription factor GATA6 in human cancers. Clin Genet. 2020;97(1):64–72.
- Guoping M, Ran L, Yanru Q. miR-143 inhibits cell proliferation of gastric cancer cells through targeting GATA6. Oncol Res. 2018;26(7):1023–1029.
- Shen W, Niu N, Lawson B, et al. GATA6: a new predictor for prognosis in ovarian cancer. Hum Pathol. 2019;86:163–169.
- Liang G, Meng W, Huang X, et al. miR-196b-5p-mediated downregulation of TSPAN12 and GATA6 promotes tumor progression in non-small cell lung cancer. Proc Natl Acad Sci U S A. 2020;117(8):4347–4357.
- Yue W, Zhao R, Yu T. The expression and significance of Dickkopf-1 and GATA-6 in laryngeal carcinoma. Lin Chung Er Bi Yan Hou Tou Jing Wai Ke Za Zhi. 2014;28(9):643–646.
- Guo Z, Zhu H, Xu W, et al. Alternative splicing related genetic variants contribute to bladder cancer risk. Mol Carcinog. 2020;59(8):923–929.
- Tsuchiya H, Oura S. Involvement of MAFB and MAFF in retinoid-mediated suppression of hepatocellular carcinoma invasion. Int J Mol Sci. 2018;19(5):1450.
- Wu M, Deng X, Zhong Y, et al. MafF is regulated via the circ-ITCH/miR-224-5p axis and acts as a tumor suppressor in hepatocellular carcinoma. Oncol Res. 2020;28(3):299–309.
- Bhatlekar S, Fields JZ, Boman BM. HOX genes and their role in the development of human cancers. J Mol Med (Berl). 2014;92(8):811–823.
- Wang X, Sun Y, Xu T, et al. HOXB13 promotes proliferation, migration, and invasion of glioblastoma through transcriptional upregulation of lncRNA HOXC-AS3. J Cell Biochem. 2019;120(9):15527–15537.
- Aspuria PJ, Cheon DJ, Gozo MC, et al. HOXB13 controls cell state through super-enhancers. Exp Cell Res. 2020;393(1):112039.
- Liu B, Wang T, Wang H, et al. Oncoprotein HBXIP enhances HOXB13 acetylation and co-activates HOXB13 to confer tamoxifen resistance in breast cancer. J Hematol Oncol. 2018;11(1):26.
- Xie B, Bai B, Xu Y, et al. Tumor-suppressive function and mechanism of HOXB13 in right-sided colon cancer. Signal Transduct Target Ther. 2019;4:51.
- Sui BQ, Zhang CD, Liu JC, et al. HOXB13 expression and promoter methylation as a candidate biomarker in gastric cancer. Oncol Lett. 2018;15(6):8833–8840.