
ABSTRACT
Gastric cancer (GC) is a common malignant gastrointestinal tumor with high mortality. Previous study has reported that the overexpression of lncRNA HCP5 was observed in gastric cancer tissues. The purpose of this study was to investigate the molecular mechanism underlying the effect of lncRNA HCP5 on the proliferative, migratory, and invasive abilities of GC cells. The relative mRNA expression of HCP5, miR-299-3p, and SMAD5 were determined by RT-qPCR. The expressions of proteins associated with apoptosis and invasion were detected by western blot. The interaction of HCP5 with miR-299-3p and SMAD5 with miR-299-3p was confirmed by luciferase reporter assay. The cellular behaviors of AGS cells were, respectively, detected by CCK-8 assays, colony formation assays, migration and invasion assays, and flow cytometry. In our study, lncRNA HCP5 was highly expressed in GC cell lines compared with normal gastric epithelial cell. LncRNA HCP5 silencing inhibited AGS cells proliferation, migration, and invasion, while promoted cell apoptosis. Moreover, miR-299-3p downregulation could abolish the effect of HCP5 knockdown on cellular behaviors of AGS cells. Interestingly, SMAD5 is identified as the downstream target of miR-299-3p, and its expression was inhibited by miR-299-3p. More importantly, SMAD5 silencing inhibited proliferation, migration, and invasion of GC cells, and promoted cell apoptosis. In a word, lncRNA HCP5 silencing inhibits GC cell proliferation, invasion, and migration while promoting its apoptosis via regulation of miR-299-3p/SMAD5 axis. Hence, lncRNA HCP5 could be a novel and promising target for GC treatment.
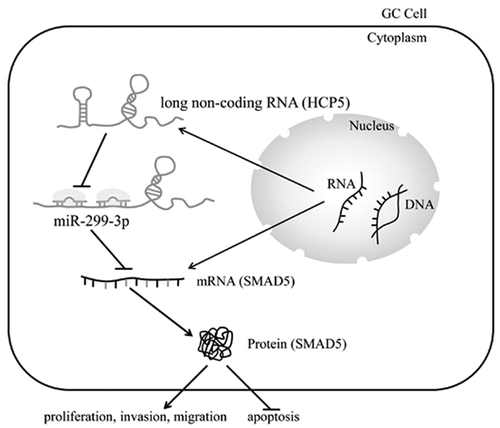
Graphical abstract
1. Introduction
Gastric cancer (GC) is a common malignant gastrointestinal tumor with high mortality, accounting for a huge amount of cancer-related deaths worldwide [Citation1,Citation2]. GC is recognized as an important health challenge because people are at high risk of developing GC, particularly the elderly [Citation3]. Regardless of the development of medical interventions for GC, patients in China still have to face a low 5-year-survival rate of this cancer, particularly at the advanced stages [Citation4,Citation5]. The tumorigenesis of GC is a complicated process, involving complex molecular signaling [Citation6]. Hence, the specific mechanism underlying GC pathogenesis is largely unknown. Therefore, it is desirable to explore the molecular mechanism involving the development and progression of GC.
Long non-coding RNA (lncRNA) is known as a type of endogenous non-coding RNA longer than over 200 nucleotides [Citation7]. LncRNAs have regulative effect on gene expression through participation in physiological processes, including nuclear transportation, alternative splicing, and epigenetics [Citation8]. Research has demonstrated that the level of LncRNA HLA complex P5 (HCP5) was negatively associated with the survival rate of cervical cancer patients. Moreover, lncRNA HCP5 overexpression promoted the progression of cervical cancer via MACC1 overexpression through microRNA-15a adsorption [Citation9]. LncRNA HCP5 was also found to be higher in triple-negative breast cancer tissues and cell lines, and silencing HCP5 led to suppression of cell proliferation and induction of cell apoptosis [Citation10]. Additionally, HCP5 downregulation induced apoptosis and suppressed the proliferative capability of prostate cancer cells [Citation11]. Moreover, a previous study reported that lncRNA HCP5 expression was significantly upregulated in GC tissues compared with those in paired non-tumor tissues [Citation12]. However, the role of lncRNA HCP5 in proliferation, invasion, and migration of GC cells remains undefined. The aim of the present study was to investigate the underlying mechanism implicated the role of lncRNA HCP5 in cellular behaviors of GC cells.
In our study, AGS cell line was used to investigate the relationship between HCP5 and GC. The suppressive effect of HCP5 silencing on cell proliferation, invasion, and migration can be observed, suggesting lncRNA HCP5 may present as an effective target for GC treatment.
2. Materials and methods
2.1. Cell culture and transfection
Five GC cell lines including NCI-N87, AGS, SNU-1, SNU-16, and HGC-27 and one normal gastric epithelial cell line GES-1 were purchased from American Type Culture Collection (ATCC, Manassas, VA, USA). These cell lines were cultured in DMEM (Gibco, MD, USA) containing 10% FBS (Gibco, MD, USA) and 100 U/ml penicillin/streptomycin in a humidified incubator containing 5% CO2 at 37°C.
Small interfering (si) RNA against HCP5 (siRNA-HCP5) or SMAD5 (siRNA-SMAD5), corresponding control siRNA, miR-299-3p inhibitors, and inhibitor-NC were from GenePharma (Shanghai, China). The si-HCP5 (100 nM), si-SMAD5 (100 nM) or negative controls (si-NC), miR-299-3p inhibitors (1 μM) and inhibitor-NC were transfected into the AGS cells using lipofectamine 3000 reagent (Invitrogen, Carlsbad, CA) according to the manufacturer’s instructions. After 48 h of incubation, the transfected AGS cells were used for further experiments and qRT-PCR was performed to confirm transfection efficiency.
2.2. RT-qPCR
Total RNA was extracted in transfected cells using TRIzol Reagent (Life Technologies). The mRNAs were reversely transcribed to cDNAs using PrimeScript RT reagent kit (TaKaRa, Japan), followed by the qRT-PCR reactions according to the instructions of SYBR® Green Realtime PCR Master Mix (Toyobo, Japan). The 2ΔΔCt method was applied to calculate the relative mRNA levels of target genes and house-keeping genes.
2.3. Cell viability assessment
After transfection, cell viability assay was performed to detect the cell viability. After incubation for 0 h, 24 h, 48 h, and 72 h, cell counting kit-8 (CCK-8) solution (Dojindo, Kumamoto, Japan) was added (10 µl/well) and maintained with AGS cells for another 2 h. The absorbance at 450 nm was measured with a microplate reader (Bio-Rad).
2.4. Colony formation assay
After transfection, AGS cells were planted in 6-well plates. The cells were cultured for 2 weeks at 37°C without disturbance during the period of incubation. Afterward, cell colonies were fixed with 4% paraformaldehyde and stained with 0.1% crystal violet solution before being photographed and counted.
2.5. Migration assay
The cell migration rate was evaluated by the wound-healing assay. AGS cells were seeded in a six-well plate and cultured with DMEM for 24 h. A straight linear wound was created by scraping the monolayers with the sterile pipette tips, and the floating cells were removed by washing with PBS. Wound closure was captured by a microscope (Nikon) photographing five random fields. The recovered wound area (%) at 24 h was calculated according to the following formula: [(wound width at 0 h) – (wound width at 24 h)]/wound width at 0 h.
2.6. Invasion assay
The ability of cell invasion was determined by Transwell chamber assay. In brief, cells (2 × 10⁴ cells/well) were suspended in DMEM containing 1% FBS and added to the upper chamber, matrigel mix was coated at the underside of the upper chamber. Culture medium (500 μl) supplemented with 10% FBS was added to lower chambers to stimulate invasion. The cells remaining on the upper surface were gently removed after 24 h of incubation, while the cells at the lower surface of the membrane were stained with 0.5% crystal violet for 15 min. Finally, the cells were captured in randomly selected fields with an inverted microscope.
2.7. Western blot
Proteins were extracted from transfected cells by RIPA lysis buffer containing protease inhibitors, and the protein concentration was quantified using the BCA assay kits. Equal amounts of protein were fractionated with corresponding SDS-PAGE and transferred to PVDF membranes. Primary antibodies against the following proteins were used: Bcl-2, Bax, Caspase3, pro-Caspase3, matrix metalloproteinases3 (MMP3), MMP9, and SMAD5. The band density was analyzed by ImageJ software and normalized to GAPDH.
2.8. Flow cytometry
AGS cells were planted in 6-well plates (1 × 10⁵cells/well). The Annexin V-FITC/PI Apoptosis Kit (Thermo Fisher Scientific) was employed to evaluate cell apoptosis following the manufacturer’s instructions. Cells were briefly digested with 0.25% trypsin and then resuspend with 1× Binding Buffer (500 µL). Thereafter, Annexin V-FITC (5 µL) was added and incubated for 20 min, followed by 10 µL PI staining solution. After incubation under darkness for 20 min, the apoptosis rate was analyzed using a flow cytometer.
2.9. Luciferase reporter assay
Before transfection, AGS cells were seeded in 24-well plates and cultured at 37°C. The mutant (MUT) sequences or wild type (WT) sequences of HCP5 and SMAD5 in 3ʹ-UTR containing the miR-299-3p binding site were constructed and subcloned into the pGL3 basic plasmid. Thereafter, cells were co-transfected with WT or MUT HCP5 and SMAD5 reporter plasmids and miR-299-3p mimics or its vector using Lipofectamine 3000. After incubation for 48 h, the firefly luciferase activity was detected and normalized to that of firefly and Renilla using the Dual-Luciferase Reporter Assay System (Promega, Madison, WI, USA). All reporter genes and RNA oligonucleotide sequences were all synthesized by GenePharma (Shanghai, China).
2.10. Statistical analysis
Statistical data analysis was carried out with GraphPad Prism 5.0. All data were expressed as the means ± standard error (SEM). Differences among the means were analyzed using One-way ANOVA followed by Tukey test. For comparison between two groups, Student’s t-test was used. Differences at P < 0.05 were considered statistically significant differences.
3. Results
3.1. LncRNA HCP5 silencing inhibited the proliferation of AGS cells
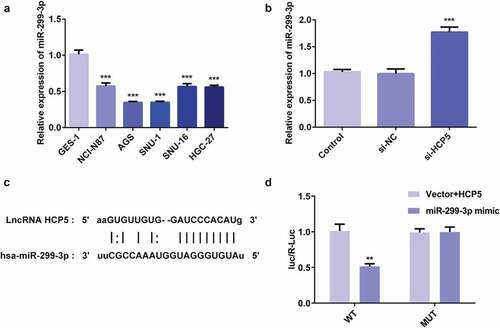
To investigate the association between HCP5 and GC pathophysiology, the level of HCP5 was quantified with RT-qPCR. The HCP5 level in GC patient tumor samples is increased compared to normal samples ()). Moreover, HCP5 was noticeably upregulated in human GC cell lines including NCI-N87, AGS, SNU-1, SNU-16, and HGC-27 compared with that in normal gastric epithelial cell line GES-1 ()), suggesting that HCP5 is closely related to GC progression. The AGS cell line, in which HCP5 was expressed at the highest level, was selected for the next experiments. Afterward, siRNA-HCP5 was constructed to downregulate the expression of HCP5. The RT-qPCR results demonstrated that lower expression of HCP5 was detected in siRNA-HCP5-2 group than siRNA-HCP5-1 group ()). Therefore, siRNA-HCP5-2 was employed for further study.
Figure 1. LncRNA HCP5 silencing inhibits the proliferation of AGS cells. (a) The expression level of HCP5 in GC tumor samples and normal samples predicted by GEPIA website. (b,c) The expression of HCP5 was detected by RT-qPCR. (d) The survival rate of cells was evaluated with cell viability assay. (e) The cell proliferation was assessed by colony formation assay, and quantification (f). Error bars represent the mean ± SEM from three independent experiments. **P< 0.01, ***P< 0.001 vs. Control
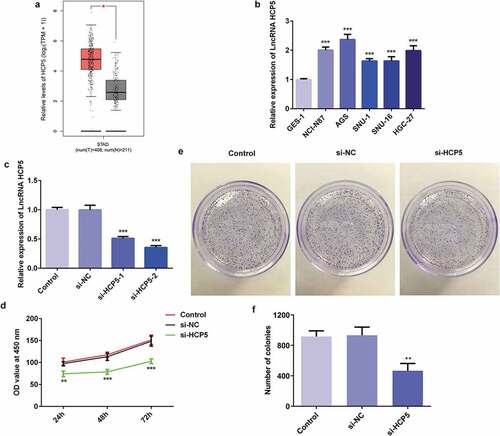
To investigate the underlying mechanism of HCP5 in the onset and development of GC, cell viability, and colony formation assays were performed. CCK8 results showed that the AGS cells transfected with si-HCP5 had lower survival rate compared with the controls ()). Meanwhile, the proliferative ability of AGS cells was inhibited by si-HCP5 transfection ()). These results suggested that lncRNA HCP5 silencing inhibited AGS cells proliferation.
3.2. LncRNA HCP5 silencing inhibited the migratory and invasive abilities of AGS cells
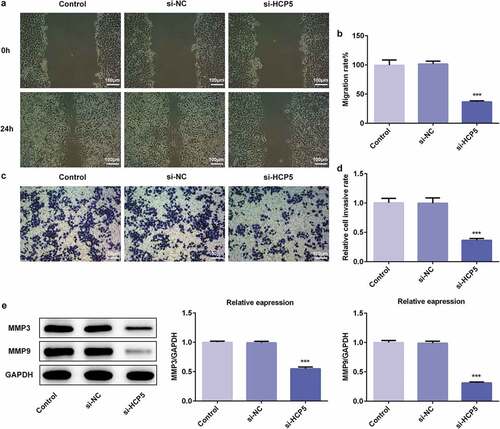
To further investigate the underlying mechanism of HCP5 in the development and progression of GC, the migratory and invasive abilities of AGS cells were measured by migration and invasion assays, respectively. As shown in ,), HCP5 silencing significantly inhibited the migratory ability of AGS cells compared with the controls. Interestingly, HCP5 knockdown also led to reduction in the invasive ability of AGS cells transfected with si-HCP5 compared with the controls (,)). Thereafter, western blot was performed to quantify the expression levels of matrix metalloproteinases (MMP)-3 and MMP-9, which were involved in tumor invasion and metastasis [Citation13,Citation14]. The western blot results showed that si-HCP5 transfection remarkably suppressed the expression levels of MMP-3 and MMP-9 compared with the controls ()). These results implied that lncRNA HCP5 silencing inhibited the migratory and invasive abilities of AGS cells.
Figure 2. LncRNA HCP5 silencing inhibits the migratory and invasive abilities of AGS cells. (a,b) The cell migration was analyzed by wound-healing assay. Scale bars = 100 μm. (c,d) The cell invasion was determined using transwell assay. Scale bars = 100 μm. (e) The expression levels of MMP3 and MMP9 were determined by western blot. Error bars represent the mean ± SEM from three independent experiments. ***P< 0.001 vs. Control
3.3. LncRNA HCP5 silencing promoted the apoptosis of AGS cells
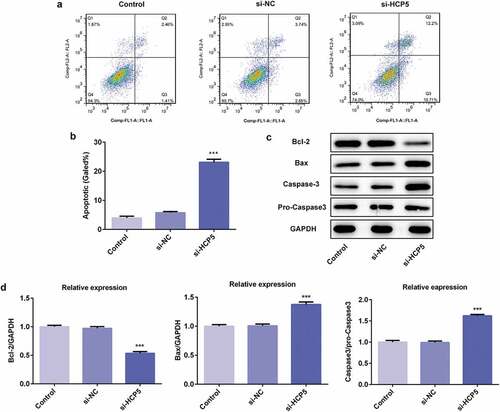
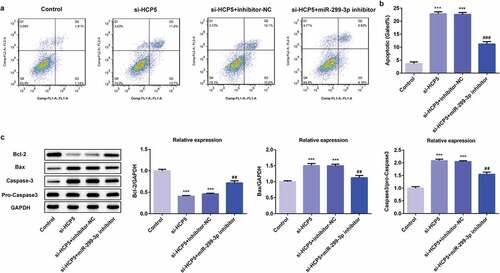
To further study the role of HCP5 in the development and progression of GC, the apoptosis of AGS cells was measured by flow cytometry after Annexin V staining. As shown in ,), AGS cells transfected with si-HCP5 showed higher mortality than the controls. The western blot results demonstrated that lncRNA HCP5 silencing caused reduction of anti-apoptotic proteins (Bcl-2) [Citation15] while upregulation of pro-apoptotic proteins (Bax) [Citation16] and caspase3 (,)), suggesting HCP5 knockdown promoted the apoptosis of AGS cells.
Figure 3. LncRNA HCP5 silencing promotes the apoptosis of AGS cells. (a,b) The cell apoptosis rate was determined by flow cytometry. (c,d) The expression levels of Bcl-2, Bax, Caspase-3 and pro-Caspase-3 were determined by western blot, the GAPDH was set as the internal normalization control. Error bars represent the mean ± SEM from three independent experiments. ***P< 0.001 vs. Control
3.4. LncRNA HCP5 silencing led to increase in miR-299-3p expression
Firstly, it was observed that the level of miR-299-3p was decreased in human GC cell lines including NCI-N87, AGS, SNU-1, SNU-16, and HGC-27 compared with that in GES-1cells, as demonstrated by RT-qPCR ()). Then, the upregulation of miR-299-3p was observed under the condition of HCP5 silencing ()). Interestingly, the interaction between HCP5 and miR-299-3p can be predicted on the Starbase website (http://starbase.sysu.edu.cn/index.php), as presented in ). Afterward, Luciferase reporter assay was performed to confirm whether miR-299-3p is the direct target of HCP5. As shown in ), the relative luciferase activity was significantly lower in AGS cells co-transfected with wild-type luciferase plasmids and miR-299-3p mimic, compared with controls. These results indicated that miR-299-3p specifically binds to the 3ʹUTR of the HCP5, and its expression was reduced by HCP5.
Figure 4. LncRNA HCP5 silencing leads to increase in miR-299-3p expression. (a,b) The relative expression of miR-299-3p was detected by RT-qPCR. (c) 3ʹ-UTR regions of HCP5 is partially complementary to miR-299-3p. (d) The relative luciferase activities in AGS cells transfected with wild-type (WT) or mutated (MUT) HCP5 reporter plasmids and miR-299-3p mimics or vector. Error bars represent the mean ± SEM from three independent experiments. **P< 0.01, ***P< 0.001 vs. Control
1.1. LncRNA HCP5 silencing inhibited the proliferation, invasion, migration while promoted apoptosis via upregulation of miR-299-3p in AGS cells
To explore the molecular mechanism related the role of HCP5 in GC progression, the proliferation, invasion, migration, and apoptosis of AGS cells were examined after the combination of HCP5 knockdown and miR-299-3p inhibition in AGS cells. Firstly, the miR-299-3p inhibitor was synthesized to downregulate the miR-299-3p expression. The RT-qPCR showed that miR-299-3p inhibitor-1 was more effective in inhibiting miR-299-3p expression than miR-299-3p inhibitor-2 ()), therefore miR-299-3p inhibitor-1 was selected for further experiments. As shown in ), miR-299-3p inhibitor-induced HCP5 upregulation. CCK8 and colony formation assays results showed that the miR-299-3p downregulation blocked the inhibitive effect of HCP5 silencing on viability and proliferation of AGS cells (,)). In addition, migration assay showed that miR-299-3p downregulation reversed the suppressive effect of HCP5 knockdown on the migratory ability of AGS cells (,)). Moreover, the invasion assay suggested that miR-299-3p downregulation abolished the suppressive effect of HCP5 silencing on invasive ability of AGS cells (,)), as well as the expression of MMP3 and MMP9 ()). Finally, flow cytometry results presented that miR-299-3p downregulation reversed the promotive effect of HCP5 knockdown on AGS cells apoptosis (,)), and western blot results showed that miR-299-3p inhibitor abolished the effect of HCP5 knockdown on the expressions of apoptosis-related proteins ()). These results indicated that miR-299-3p downregulation accelerated the GC process, and HCP5 silencing inhibits the proliferation, invasion, migration, and promotes the apoptosis via upregulation of miR-299-3p in AGS cells.
Figure 5. LncRNA HCP5 silencing inhibits proliferation, invasion and migration via upregulation of miR-299-3p in AGS cells. (a) The relative expression of miR-299-3p was detected by RT-qPCR. (b) The relative mRNA level of HCP5 was analyzed by RT-qPCR. (c) The survival rate of cells transfected with or without si-HCP5 and miR-299-3p inhibitor was evaluated with cell viability assay. (d) The cell proliferation was assessed by colony formation assay, and quantification (e). (f,g) The cell migration was analyzed by wound-healing assay. Scale bars = 100 μm. (h,i) The cell invasion was determined using transwell assay. Scale bars = 100 μm. (j) The expression levels of MMP3 and MMP9 were analyzed by western blot. Error bars represent the mean ± SEM from three independent experiments. **P< 0.01, ***P< 0.001 vs. Control; #P< 0.05, ###P< 0.001 vs. si-HCP5
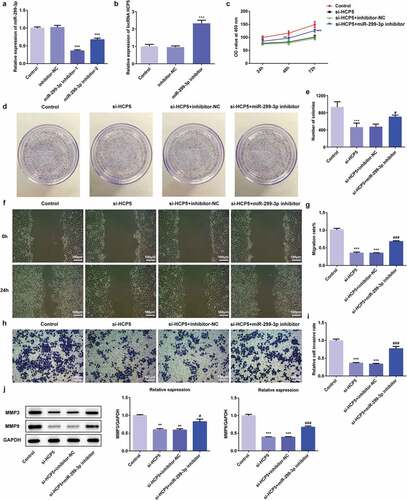
Figure 6. LncRNA HCP5 silencing promotes apoptosis via upregulation of miR-299-3p in AGS cells. (a,b) The cell apoptosis rate was determined by flow cytometry. (c) The expression levels of Bcl-2, Bax, Caspase-3 and pro-Caspase-3 were determined by western blot, the GAPDH was set as the internal normalization control. Error bars represent the mean ± SEM from three independent experiments. ***P< 0.001 vs. Control; ##P< 0.01, ###P< 0.001 vs. si-HCP5
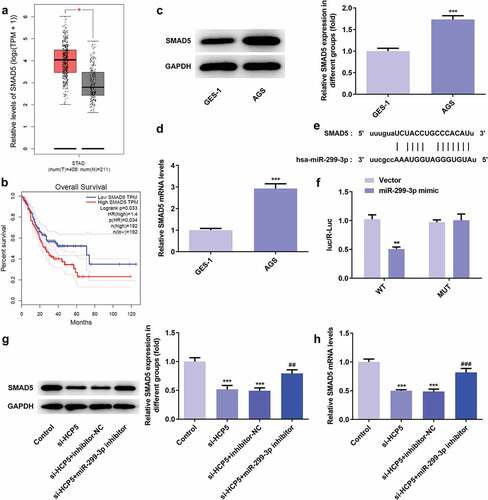
3.5 SMAD5 expression is increased both in vivo and vitro and regulated by miR-299-3p
To identify the downstream target of miR-299-3p, the interaction between miR-299-3p and SMAD5 were predicted on the Starbase website. The binding site of has-miR-299-3p on SMAD5 was shown in ). Importantly, SMAD5 expression was increased both in GC patient tumor samples compared to normal samples, and its expression level is related to poor survival rate of GC patients on GEPIA website (,)), suggesting SMAD5 is closely related to GC progression. Moreover, it is detected that the protein and mRNA expression of SMAD5 were upregulated in AGS cells compared to GES-1 cells (Figure C-D). The relative luciferase activity was notably lower in AGS cells co-transfected with wild-type luciferase plasmids and miR-299-3p mimic compared with controls ()), suggesting that miR-299-3p specifically binds to the 3ʹUTR of the SMAD5. As shown in , the protein and mRNA of SMAD5 were suppressed by HCP5 silencing, and upregulated by miR-299-3p inhibitor. These results suggested that the downstream target of miR-299-3p is SMAD5, which is closely related to GC progression.
Figure 7. SMAD5 expression is increased both in vivo and vitro and regulated by miR-299-3p. (a) The expression level of SMAD5 in GC tumor samples and normal samples predicted by GEPIA website. (b) The overall survival in STAD patients predicted by GEPIA websites. (c) The proteins expression of SMAD5 was determined by western blot. (d) The mRNA level of SMAD5 was quantified by RT-qPCR. (e) The binding site of has-miR-299-3p on SMAD5. (f) The interaction of SMAD5 with miR-299-3p was confirmed by luciferase reporter assay. (g) The proteins expression of SMAD5 were determined by western blot. (h) The mRNA level of SMAD5 were quantified by RT-qPCR. Error bars represent the mean ± SEM from three independent experiments. **P< 0.01, ***P< 0.001 vs. Control; ##P< 0.01, ###P< 0.001 vs. si-HCP5
3.6 SMAD5 silencing inhibited the proliferation, invasion, migration while promoted apoptosis of AGS cells
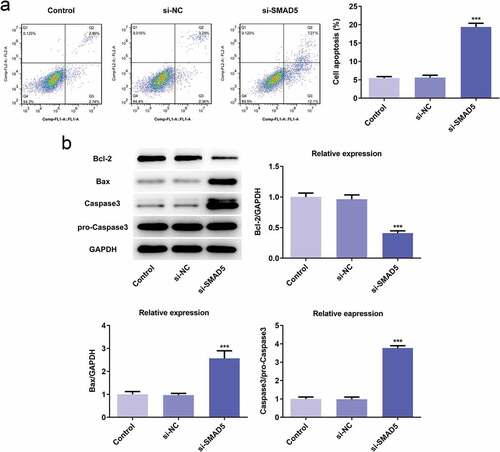
To investigate the role of SMAD5 in GC progression, the cellular behaviors of AGS cells were analyzed when SMAD5 expression is downregulated. Firstly, si-SMAD5-1 and si-SMAD5-2 were conducted to achieve SMAD5 silencing. As shown in ,), the protein and mRNA level of SMAD5 were downregulated by transfection with si-SMAD5-1 and si-SMAD5-2. Due to better transfection efficiency, the si-SMAD5-2 was selected in subsequent experiments. The results of cell viability and colony formation assays showed that SMAD5 silencing suppressed the viability and proliferation of AGS cells (,)). Moreover, the migratory and invasive capabilities were depressed in si-SMAD5 group compared to that in control group (,)), as well as MMP3 and MMP9 expressions ()). Additionally, SMAD5 silencing induced higher apoptosis rate of AGS cells compared to controls ()). The expression levels of Bax and Caspase3 were increased, while Bcl-2 was decreased in si-SMAD5 group compared control group ()). These results implied that SMAD5 silencing inhibited the proliferation, invasion, migration while promoted apoptosis of AGS cells.
Figure 8. SMAD5 silencing inhibited AGS cell proliferation. (a) The proteins expression of SMAD5 was determined by western blot. (b) The mRNA level of SMAD5 was quantified by RT-qPCR. (c) The viability of AGS cells transfected with or without si-SMAD5 was evaluated with cell viability assay. (d) The cell proliferation was assessed by colony formation assay, and quantification (e). Error bars represent the mean ± SEM from three independent experiments. ***P< 0.001 vs. Control
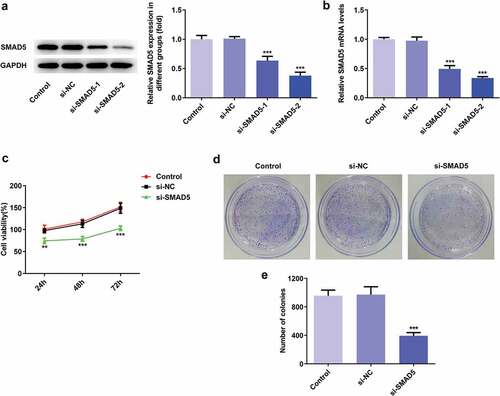
Figure 9. SMAD5 silencing inhibited AGS cells invasion and migration. (a) The cell migration was analyzed by wound-healing assay. Scale bars = 100 μm. (b) The cell invasion was determined by transwell assay. Scale bars = 100 μm. (c) The expression levels of MMP3 and MMP9 were analyzed by western blot. Error bars represent the mean ± SEM from three independent experiments. **P< 0.01, ***P< 0.001 vs. Control
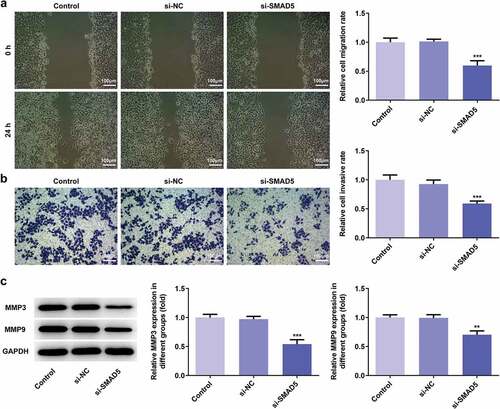
Figure 10. SMAD5 silencing promoted AGS cells apoptosis. (a) The cell apoptosis rate was determined by flow cytometry. (b) The expression levels of Bcl-2, Bax, Caspase-3 and pro-Caspase-3 were determined by western blot, the GAPDH was set as the internal normalization control. Error bars represent the mean ± SEM from three independent experiments. ***P< 0.001 vs. Control
4. Discussion
GC is a common malignancy of the digestive system with no remarkable symptoms, which is recognized as one of the primary causes for cancer-related death in the world [Citation17]. Recently, it has been well established that lncRNAs with abnormal expression is closely related to tumorigenesis and cancer progression [Citation18–20], such as gastric cancer, colon cancer, and breast cancer. Accumulating studies have noted that some lncRNAs were differentially expressed in GC tissues compared to adjacent normal tissues. For example, Chen et al. identified that lncRNA PCAT18 was poorly expressed in GC tissues and cells [Citation21]. Shi et al. reported that the expression of lncRNA CADM1-AS1 was significantly decreased in tumor tissues of GC, and its expression was positively relative to the survival rate and prognosis after clinical treatment [Citation22]. Interestingly, by analysis of microarray detection data, a recent study reported that HCP5 is one of the upregulated lncRNAs in GC tissues [Citation12]. It is also found the HCP5 level in GC patient tumor samples is increased compared to normal samples on GEPIA website. However, the specific mechanism involving the role of HCP5 in GC pathogenesis remains largely unknown. The aim of this study was to investigate the relationship between HCP5 and GC and explore its molecular mechanism in GC progression.
In our study, HCP5 was highly expressed in human GC cell lines compared with that in normal gastric epithelial cells, which was consistent with previous study. Previous study suggested that overexpression of HCP5 promoted the proliferative, migratory, invasive, and angiogenic capabilities of follicular thyroid carcinoma cells [Citation23]. Interestingly, the data indicated that lncRNA HCP5 silencing inhibited the proliferation, migration, and invasion of GC cells. In addition, HCP5 knockdown promoted the apoptosis of AGS cells. Our findings suggested HCP5 may be a tumor regulator in the GC progression.
To further explore the molecular mechanism underlying HCP5 in the development and progression of GC, the putative HCP5 binding sites were predicted on the Starbase website. Interestingly, miR-299-3p was found to be one of the potential targets of HCP5. The interaction between miR-299-3p and HCP5 was confirmed as revealed by luciferase reporter assay data. Moreover, HCP5 downregulation induced significant overexpression of miR-299-3p, suggesting miR-299-3p mediated the role of HCP5 in the tumorigenesis and progression of GC. It was reported that miR-299-3p was notably decreased in thyroid cancer tissues and cells, and miR-299-3p upregulation could suppress cell proliferation and cell cycle progression, while remarkably promote cell apoptosis in thyroid cancer cells [Citation24]. Yu et al. suggested that the expression level of miR-299-3p was downregulated in cervical cancer cell lines, and miR-299-3p inhibited cervical cancer cell growth and invasion [Citation25]. Furthermore, the inhibitory role of miR-299-3p in the migration, invasion, and proliferation of cancer cells was also reported in hepatocellular carcinoma [Citation26]. Importantly, the suppressive effect of miR-299-3p on the viability, migration, and invasion of cancer cells was also confirmed by our results. Our data also demonstrated that miR-299-3p downregulation reversed the suppressive effect of HCP5 knockdown on the proliferation, migration, and invasion of GC cells. In addition, miR-299-3p downregulation abolished the promotive effect of HCP5 silencing on the apoptosis of GC cells. Our finding indicated that lncRNA HCP5 silencing inhibits proliferation, invasion, and migration while promotes the apoptosis via upregulation of miR-299-3p in GC cells.
To identify the downstream target of miR-299-3p, the potential targets of miR-299-3p were predicted by Starbase website. It is found that miR-299-3p can directly target SMAD5 and downregulate its expression. Interestingly, SMAD5 expression was increased both in vivo and vitro, and its expression level is related to poor survival rate of GC patients. Hence, SMAD5 may play an important role in GC progression. SAMD5 mRNA has been reported to be up-regulated in prostate cancer samples, and its high expression is related to poor prognosis after radical prostatectomy [Citation27]. SMAD5 downregulation inhibited cell proliferation, invasion and migration, and reversed EMT, enhanced apoptosis of nasopharyngeal carcinoma cells [Citation28], which is consistent with our study. In our study, SMAD5 silencing inhibited proliferation, migration, and invasion of AGS cells, and enhanced cell apoptosis rate, suggesting SMAD5 was mediated the effect of miR-299-3p in GC progression.
Overall, HCP5 silencing inhibits proliferation, migration, and invasion, and promotes apoptosis via regulation of miR-299-3p/SMAD5 axis in GC cells. Hence, lncRNA HCP5 may presented as an effective and promising target for GC therapies.
5. Conclusion
In summary, high HCP5 expression could be an independent risk for the overall survival of GC patients. HCP5 knockdown suppressed the proliferation, migration, and invasion, while promotes the apoptosis of GC cells. HCP5 knockdown induced significant miR-299-3p overexpression and SMAD5 downregulation. Interestingly, miR-299-3p downregulation reversed the effect of HCP5 knockdown on cellular behaviors of GC cells, so as to affect GC progression. As the downstream target of miR-299-3p, SMAD5 silencing inhibited proliferation, migration, and invasion of GC cells, and promoted cell apoptosis. Therefore, HCP5 affected development and progression of GC via regulation of miR-299-3p/SMAD5 axis.
Author contribution
DY and XL participated in the conception of the study and writing of the manuscript. All of the authors have read and approved the final manuscript.
Supplemental Material
Download ()Disclosure statement
The author(s) declared no potential conflicts of interest with respect to the research, authorship, and/or publication of this article.
Supplementary material
Supplemental data for this article can be accessed here.
References
- Bray F, Ferlay J, Soerjomataram I, et al. Global cancer statistics 2018: GLOBOCAN estimates of incidence and mortality worldwide for 36 cancers in 185 countries. CA Cancer J Clin. 2018;68(6):394–424.
- Siegel RL, Miller KD, Jemal A. Cancer statistics, 2018. CA Cancer J Clin. 2018;68(1):7–30.
- Hamilton TD, Mahar AL, Haas B, et al. The impact of advanced age on short-term outcomes following gastric cancer resection: an ACS-NSQIP analysis. Gastric Cancer. 2018;21(4):710–719.
- Zong L, Abe M, Seto Y, et al. The challenge of screening for early gastric cancer in China. Lancet. 2016;388(10060):2606.
- Yao J, Zhang H, Liu C, et al. miR-450b-3p inhibited the proliferation of gastric cancer via regulating KLF7. Cancer Cell Int. 2020;20(1):47.
- Astudillo P. Wnt5a signaling in gastric cancer. Front Cell Dev Biol. 2020;8:110.
- Fernandes JCR, Acuna SM, Aoki JI, et al. Long non-coding RNAs in the regulation of gene expression: physiology and disease. Noncoding RNA. 2019;5(1). DOI:10.3390/ncrna5010017
- Ponting CP, Oliver PL, Reik W. Evolution and functions of long noncoding RNAs. Cell. 2009;136(4):629–641.
- Yu Y, Shen HM, Fang DM, et al. LncRNA HCP5 promotes the development of cervical cancer by regulating MACC1 via suppression of microRNA-15a. Eur Rev Med Pharmacol Sci. 2018;22(15):4812–4819.
- Wang L, Luan T, Zhou S, et al. LncRNA HCP5 promotes triple negative breast cancer progression as a ceRNA to regulate BIRC3 by sponging miR-219a-5p. Cancer Med. 2019;8(9):4389–4403.
- Hu R, Lu Z. Long noncoding RNA HCP5 promotes prostate cancer cell proliferation by acting as the sponge of miR4656 to modulate CEMIP expression. Oncol Rep. 2020;43(1):328–336.
- Mo X, Wu Y, Chen L, et al. Global expression profiling of metabolic pathway-related lncRNAs in human gastric cancer and the identification of RP11-555H23.1 as a new diagnostic biomarker. J Clin Lab Anal. 2019;33(2):e22692.
- Barajas-Casta ١ ed a LM, Cortﺃﺏs-Gutiﺃﺏrrez E, Garcﺃﺝa-Rodrﺃﺝguez FM, et al. Overexpression of MMP-3 and uPA with diminished PAI-1 related to metastasis in ductal breast cancer patients attending a public hospital in Mexico City. J Immunol Res. 2016;2016:8519648.
- Bodey B, Bodey B Jr., Grﺃ٦ger AM, et al. Invasion and metastasis: the expression and significance of matrix metalloproteinases in carcinomas of the lung. Vivo. 2001;15(2):175–180.
- Raghav PK, Kumar R, Kumar V, et al. Docking-based approach for identification of mutations that disrupt binding between Bcl-2 and Bax proteins: inducing apoptosis in cancer cells. Mol Genet Genomic Med. 2019;7(11):e910.
- Bumbat M, Wang M, Liang W, et al. Effects of Me(2)SO and trehalose on the cell viability, proliferation, and Bcl-2 family gene (BCL-2, BAX, and BAD) expression in cryopreserved human breast cancer cells. Biopreserv Biobank. 2020;18(1):33–40.
- Nie ML, Han J, Huang HC, et al. The novel lncRNA p4516 acts as a prognostic biomarker promoting gastric cancer cell proliferation and metastasis. Cancer Manag Res. 2019;11:5375–5391.
- Dai Q, Zhang T, Li C. LncRNA MALAT1 regulates the cell proliferation and cisplatin resistance in gastric cancer via PI3K/AKT pathway. Cancer Manag Res. 2020;12:1929–1939.
- Zaheed O, Samson J, Dean K. A bioinformatics approach to identify novel long, non-coding RNAs in breast cancer cell lines from an existing RNA-sequencing dataset. Noncoding RNA Res. 2020;5(2):48–59.
- Zhang P, Shi L, Song L, et al. LncRNA CRNDE and lncRNA SNHG7 are promising biomarkers for prognosis in synchronous colorectal liver metastasis following hepatectomy. Cancer Manag Res. 2020;12:1681–1692.
- Chen P, Zhao X, Wang H, et al. The Down-Regulation of lncRNA PCAT18 Promotes the Progression of Gastric Cancer via MiR-107/PTEN/PI3K/AKT Signaling Pathway. Onco Targets Ther. 2019;12:11017–11031.
- Shi XY, Sun YZ, Li M, et al. LncRNA CADM1-AS1 serves as a new prognostic biomarker for gastric cancer. Eur Rev Med Pharmacol Sci. 2019;23(3 Suppl):232–238.
- Liang L, Xu J, Wang M, et al. LncRNA HCP5 promotes follicular thyroid carcinoma progression via miRNAs sponge. Cell Death Dis. 2018;9(3):372.
- Chen X, Qi M, Yang Q, et al. MiR-299-3p functions as a tumor suppressor in thyroid cancer by regulating SHOC2. Eur Rev Med Pharmacol Sci. 2019;23(1):232–240.
- Yu Y, Zhao JD, Yang H. MiR-299-3p inhibits proliferation and invasion of cervical cancer cell via targeting TCF4. Eur Rev Med Pharmacol Sci. 2019;23(13):5621–5627.
- Dang S, Zhou J, Wang Z, et al. MiR-299-3p functions as a tumor suppressor via targeting Sirtuin 5 in hepatocellular carcinoma. Biomed Pharmacother. 2018;106:966–975.
- Li F, Xu Y, Liu RL. SAMD5 mRNA was overexpressed in prostate cancer and can predict biochemical recurrence after radical prostatectomy. Int Urol Nephrol. 2019;51(3):443–451.
- Li S, Zhao B, Zhao H, et al. Silencing of long non-coding RNA SMAD5-AS1 reverses epithelial mesenchymal transition in nasopharyngeal carcinoma via microRNA-195-dependent inhibition of SMAD5. Front Oncol. 2019;9:1246.