
 ?Mathematical formulae have been encoded as MathML and are displayed in this HTML version using MathJax in order to improve their display. Uncheck the box to turn MathJax off. This feature requires Javascript. Click on a formula to zoom.
ABSTRACT
In this study, Xuzhou, a typical industrial city in the north of Jiangsu Province, was chosen to investigate the pollution level of atmospheric particulates. The proportion of fine particles (PM2.5) in PM10 is larger than that of coarse particles (about 58%). The physicochemical properties of PM2.5 were analyzed by SEM and EDS. DGGE was used to study the distribution characteristics of bacterial community structure on atmospheric particulates (TSP, PM2.5 and PM10) in different functional areas of Xuzhou city during the winter haze. It was found that the microbial populations of atmospheric particles were mainly divided into three groups: Proteobacteria, Bacteroidetes, and Pachytenella. The community structure of bacteria in fine particle size was more abundant than that in coarse particle size. When haze occurs, the concentration of all kinds of pathogens in fine particle size will increase. Therefore, it is necessary to focus on the monitoring and management of fine particles.
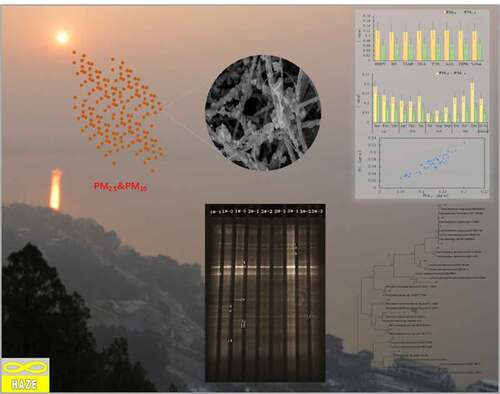
GRAPHICAL ABSTRACT
Introduction
In recent years, most cities frequently have severe haze weather in China, and atmospheric particles are an important factor to cause haze weather [Citation1,Citation2]. The source, composition, migration, and transformation of particulates (total suspended particle, TSP and particulate matter, PM10 and PM2.5) in the air have attracted extensive attention [Citation3–7]. Many of them focus on the physical and chemical properties of atmospheric particles, but little is known about the composition and characteristics of microorganisms in atmospheric particles. Therefore, it is necessary to carry out research on the source, composition, population structure, and distribution characteristics of microorganisms in atmospheric particulates.
Microorganisms in the air mainly exist in the form of microbial aerosols, including living organisms such as air bacteria, fungi, and actinomycetes [Citation8]. It is attached to the dust, particles, and aerosols suspended in the air, a large part of which are pathogens. It can be widely spread with the flow of air, and it can damage human beings, animals, and plants under appropriate conditions, resulting in the occurrence and spread of diseases. In addition, air microorganism is an integral part of the ecosystem in the corresponding area, which can spread and transfer with the flow of aerosols in the atmosphere, and then change the microbial community structure in the air in the corresponding area. Especially in recent years, it has been gradually recognized that the fine particles PM10 and PM2.5 in aerosols are easy to accumulate bacteria and viruses in the air, and can enter human lungs, causing serious harm to human health, and many respiratory diseases are also transmitted through microbial aerosols [Citation9–11, Citation12, Citation30].
However, there is no official exposure level and relevant regulations for air microorganism at home and abroad [Citation13]. At present, neither EPA (U.S. Environmental Protection Agency) nor NIOSH (National Institute for Occupational Safety and Health) have proposed the microbial concentration limit. The ecological research center of Chinese Academy of Sciences has formulated the air microorganism standard, but it is only limited to a reference index of the total number of bacteria.
In the United States, France, Sweden, and other developed countries, as well as Beijing, Shanghai and other places in China, the microorganism in the air has been investigated [Citation14–18]. Among them, the most common method depends on microbial culture to detect air microorganisms [Citation19–21]. Previous culture experiments have shown that Bacillus, Clavibacter, Corynebacterium, Curtobacterium, Micrococcus, Pseudomonas and Staphylococcus are common bacteria in air microorganism. Because many microorganisms in nature are not culturable, the pure culture of microorganisms cannot fully reflect all microbial groups in the air, and the culture medium used in the pure culture method has obvious selectivity for microbial groups, and cannot really reflect the original microbial group’s population structure and changes. In addition, the cultivation and identification of bacteria need a long time and a lot of manpower, especially in the long-term ecological investigation with a large number of samples. Compared with pure culture, molecular ecology can overcome the above shortcomings. For example, molecular ecological methods such as clone library construction, DNA fingerprint analysis, real-time quantitative PCR, and gene chip have been used in the research of air microorganism [Citation16,Citation22–25]. However, there are few reports about using molecular ecology to study air microorganism in China.
Therefore, Xuzhou, a typical industrial city in northern Jiangsu Province, was selected to investigate the pollution level of atmospheric particulate matter. The community structure was analyzed by molecular ecology method. The relationship between microorganism and environmental factors was explored through community distribution. More comprehensive investigation of particulate matter pollution can provide technical support for environmental management in this area.
Materials and methods
Sampling methods
Seven sampling points were selected in Xuzhou City, namely, Huanghe New Village (HHNV, residential area), Huaita (HT, scenic area), Tongshan Animal Hospital (TSAH, residential area), New Urban Area (NUA, mixed traffic residential area), Taoyuan road (TYR, general industrial area), Academy of Agricultural Sciences (AAS, mixed traffic residential area), Tongshan Environmental Protection Bureau (TEPB, cultural area).
PM10 and PM2.5 samples were collected on glass fiber filter membrane by intelligent integrated sampler (Laoshan 2050B, Qingdao) and PM10 and PM2.5 cutters, according to ‘Technical specifications manual methods for ambient air quality monitoring’ (HJ 194–2017). The analytical method was based on the ‘Determination of atmospheric articles PM10 and PM2.5 in ambient air by gravimetric method’ (HJ 618–2011) .
Preparation of filter membrane: before sampling, place the glass fiber filter membrane in the desiccator for 24 hours, weigh it with an analytical balance with a sensitivity of 0.1 mg, put it in the desiccator for 1 hour, and then weigh it. The difference between the two times of mass shall not be greater than 0.4 mg (i.e. constant weight).
Microscopic observation
Scanning electron microscopy (SEM) and energy dispersive spectrometer (EDS) were employed to observe the microscopic characteristics of atmospheric articles. The preparation of electron microscope samples was to use double-sided adhesive to stick the cut sample 1 cm × 1 cm flat on the conductive metal gasket, put the sample into the electron microscope sample bin after spraying gold (Gold plating of ion sputtering instrument, E-1010, Japan HITACHI), and use the field emission environment scanning electron microscope (QUANTA-200, USA FEI) to observe the micromorphology of particles. The working voltage of electron microscope is of 10 kV, the working current of 10 μA, the diameter of electron beam spot of 1 ~ 2 μm, and the scanning working distance of 7.8 mm. The signal acquisition time of EDS(EDAX Genesis 2000, USA FEI) analysis is 100 s, making the total value exceed 100 000.
Microbial community analysis
DNA extraction
The samples for microbial community analysis were collected from glass fiber filter membrane under aseptic conditions. The DNA was then extracted using the phenolic-chloroform method [Citation26]. Briefly, the broken fibers were suspended in 5 ml of buffer solution (0.1 M Tris-HCl, 0.1 M EDTA-Na2, 0.2 M NaCl, 2%CTAB;pH 8.0) in a raw extract tube, and then shaken for 45 min at 37°C. Next, 0.75 mL 20% SDS was added to the tube and the samples were incubated at 65°C for 1 h .After centrifugation at 16,000 × g for 10 min, the supernatant was recovered and washed twice with phenol-chloroform-isoamyl alcohol (25:24:1; pH 8.0). The nucleic acids were then precipitated by the addition of 0.3 M NaAC (pH 5.2) and 2 volumes of absolute ethanol for 1 h at room temperature, after which they were centrifuged for 20 min at 16,000 × g. Finally, the pellets were washed twice with 70% ethanol, dried and resuspended in 50 μL of Tris–EDTA (pH 8.0).
PCR amplification
The V3 variable regions of 16S rDNA genes were amplified by PCR using the universal primers F357-GC (5ʹ-CGCCCGCCGCGCCCCGCGCCCGGCCCGCCGCCCCCGCCCCCCTACGGGAGGCAGCAG −3ʹ) and R518 (5ʹ-ATTACCGCGGCTGCTGG −3ʹ). PCR was conducted in a 50 µL reaction mixture composed of 0.5 µL DNA template, 0.25 µl of 5 U/µl Taq polymerase, 5 µL of 10× PCR buffer (2.0 mM Mg2+), 1 µl of 10 mM dNTP, 1 µl of each primer and 41.25 µL of ultrapure sterile water. The reaction was conducted by subjecting the samples to the following conditions: initial denaturation at 94°C for 4 min, 30 cycles of denaturation at 94°C for 0.5 min, annealing at 56°C for 1 min, and extension at 72°C for 0.5 min, and a final extension at 72°C for 7 min. The amplification results are shown in the .
Figure 1. PCR amplification results
Cloning and sequencing of 16S rDNA
Cloning and sequencing of 16S rDNA was conducted by Sangon (Shanghai, China). Briefly, PCR products were purified using a PCR product purification kit, after which cloning was performed using a TA cloning kit to connect amplified fragments to pUCm-T vectors. Chemically competent E. coli cells were then transformed with the ligation mixes according to the manufacturer’s instructions and selected by blue-white selection after cultivation on Luria–Bertani (LB) agar plates containing ampicillin (100 µg/ml). The plasmid DNA was extracted using a UNIQ-10 column DNA purification kit and then sequenced with an ABI 3730 automated sequencer using the vector-specific primers M13F357 and M13R518. Each nucleotide sequence was then compared with sequences available in the GenBank database by BLAST searches. The nucleotide sequence data reported in this study were submitted to GenBank and assigned accession numbers KT000373-KT000386.
Data processing methods
The DGGE atlas was analyzed with Quantity One software and clustered with UPGMA method [Citation27]. The number of bands and gray value of samples were analyzed by Biodap software. Shannon diversity index, Evenness index and Simpson index were calculated according to the following formulas:
(i) Shannon diversity index (H′)
(ii) Evenness index (E)
(iii) Simpson index (D)
where is the proportion of OUT (operational taxonomic units) clones to total clones, and S is the total OTU number of 16S rDNA .
The sequencing results were logged into the National Biotechnology Information Center (http://www.ncbi.nlm.nih.gov/), and the sequences were compared with the known sequences in the gen bank database. MEGA5 software and neighbor-joining method were used to construct system evolution.
Results and discussion
In haze weather, microbes enter the human body through breathing on the attached particles. Many kinds of bacteria are important pathogenic factors of respiratory infections, skin allergies, and even asthma, lung infections, and other diseases [Citation10, Citation12, Citation30]. The air microorganism monitoring and the result analysis are the important basis to judge the microorganism pollution level. Xuzhou is a typical industrial city with frequent haze. The atmospheric particulate matter samples were collected from seven typical urban functional areas in Xuzhou. The pollution levels of PM10 and PM2.5 were analyzed, and the physicochemical characteristics of PM2.5 particles were analyzed by SEM and EDS. DGGE method was used to analyze the microorganism community structure in atmospheric particulates.
Analysis on the level of air particle pollution
The monitoring data of sampling points in Xuzhou City showed that the concentration range of PM10 and PM2.5 is 0.097–0.457 mg/m3 and 0.074–0.320 mg/m3, with the average concentration of 0.123 mg/m3 and 0.067 mg/m3 respectively. According to the ‘Ambient air quality standards’ (GB3095-2012), the exceedance of PM10 and PM2.5 in Xuzhou City is 26.3% and 31.2%. PM10 exceeded 85% in class I area, 28.0% in class II area, and PM2.5 exceeded 78.5% in class I area and 31.5% in class II area.
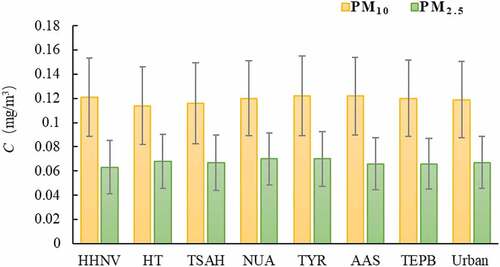
As shown in , the pollution level of PM10 in different functional areas was industrial area (TYR) > mixed traffic and residential area(AAS) > cultural area (TEPB) > residential area (TSAH)> scenic area (HT). And PM2.5 pollution level was industrial area (TYR) = mixed traffic and residential area (AAS)> scenic area (HT) > cultural area (TEPB)> residential area (HHNV).
Figure 2. Pollution level in different functional areas
The 12 months changes of PM10 and PM2.5 concentrations in four quarters of Xuzhou city from 2014 to 2016 are shown in . It can be seen from that PM10 and PM2.5 have the same rules of seasonal change, showing the pollution change of ‘heavy in winter and light in summer’, and the seasonal difference is obvious, showing as winter > spring > autumn > summer.
Figure 3. Pollution level in different months
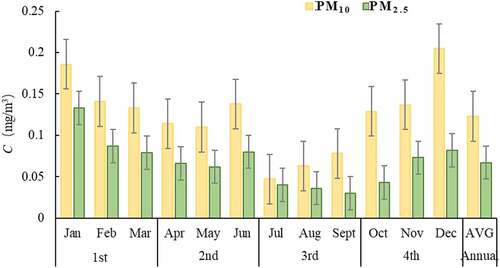
There are two main reasons: on the one hand, the temperature is low, the atmosphere is stable, and the air pollutants are not easy to diffuse, and the weather is dry in winter and spring in Xuzhou, which is prone to wind and dust; on the other hand, because November, December, January and February belong to the heating season, which results in the high-quality concentration of PM10 and PM2.5 in these four months.
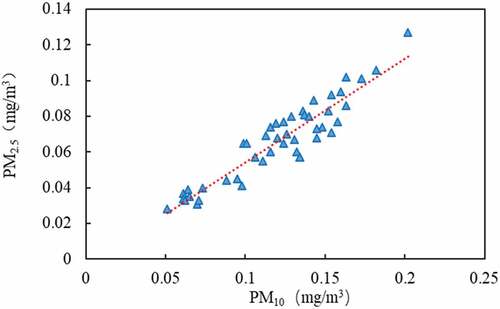
PM10 can be divided into 2.5–10 μm coarse particles and less than 2.5 μm fine particles. Data analysis shows that the ratio of PM2.5/PM10 ranges from 0.42 to 0.66, with an average of 0.55. The correlation analysis of PM2.5 and PM10 shows that there is a significant linear relationship between them. The regression equation is PM2.5 = 0.581 × PM10-0.0037, and the correlation coefficient R2 = 0.8677 (n = 46). The regression analysis results are shown in . It can be seen that the proportion of fine particles (PM2.5) in PM10 is larger than that of coarse particles, accounting for about 55%. PM2.5 particles are extremely small, with large specific surface area, and are easy to accumulate toxic and harmful substances in the air. With human breathing into the alveoli and blood, it is more harmful to human body [Citation28].
Figure 4. The correlation analysis of PM2.5 and PM10.
Microscopic observation of PM2.5
is SEM and EDS diagrams of PM2.5 sampling results, respectively. It can be seen that the particle size of most particles in the SEM picture of is basically below 2.5 μm, in which the larger particles in the picture have smooth surface, passivated edges and corners, and adhere to more and smaller particles, which are small, easy to handle and can float in the atmosphere for a long time. From the EDS energy spectrum, it can be seen that there are particles in the picture C, O, S, Si, Al, K, Na, Ca, Mg, Fe, and other elements can be inferred that there are a lot of mineral particles in PM2.5, such as quartz, calcite, clay minerals, etc.
Figure 5. SEM and EDS of PM2.5.
Distribution characteristics of microbial community structure in atmospheric particulates
DGGE atlas and diversity analysis
The DGGE atlas of atmospheric bacterial communities with different particle sizes at different sampling points is shown in , and the distribution of each sample strip after being processed with Quantity One software is shown in . shows the diversity index of different samples.
Figure 6. DGGE of 16S rDNA of atmospheric bacterial community

Table 1. The diversity index of different samples
1#, 2#, and 3#, respectively, represent the sampling points of HHNV, HT, and TSAH. From No.1 to No.3, the particle size of collected air microorganism decreased gradually, which were TSP, PM10 and PM2.5 respectively. The DGGE map produced 14 recognizable bands with Shannon index between 1.74 and 2.42, indicating that the diversity of bacterial community in the atmosphere was lower than that in water, soil, and other environments.
In general, the number of bands on TSP is less, Shannon index is lower, the number of bands on PM10 and PM2.5 is increased, Shannon index is increased, indicating that the community structure of atmospheric bacteria on fine particles is more complex. Band 1, band 2, band 5, band 6 and band 10 exist in all samples and their brightness changes little, which shows that they are widely distributed in various particle sizes of air quality and have strong adaptability to the environment. Band 7 was only found in PM2.5 samples from HHNV, which could adapt to the specific bacteria on the fine particles in the haze weather. The brightness of band 5 and band 6 is strong, which shows that they can adapt to the change of environment and grow into the dominant bacteria in this period. The uniformity of the samples is high (the average value is >0.97), so there is little difference between the samples.
Similarity analysis of microbial community structure
The unweighted group average (UPGMA) cluster analysis was carried out for different samples (). The total is divided into two, 3#-2 and 3#-3, the similarity with other samples is 53%.The similarity between other samples is more than 70%. In addition to TSAH, the similarity of samples with different particle sizes is higher (>80%), that of PM10 and PM2.5 is higher (>90%), and that of other samples is lower.
Figure 7. UPGMA cluster analysis chart
Clonal sequencing and phylogenetic analysis
14 bands were sequenced and analyzed, respectively. The sequencing results were compared with the existing sequences in GenBank database (), and the sequences were submitted to GenBank database (http://www.ncbi.nlm.nih.gov), and the serial number KT000373-KT000386 was obtained.
Table 2. BLAST comparison of DGGE sequencing bands
The phylogenetic tree was constructed by using the adjacency method (). The length of the fragments ranged from 169bp to 194bp, which belonged to Proteobacteria, Bacteroides, Firmicutes, Actinobacteria and Candidatus saccharicteria. At the genus level, it is divided into 13 genera, most of which are nonculturable bacteria. The strong signal band was Chitinophaga, Seiminibacterium and Cloacibacterium. Chitinophaga, Lactobacillus, Bradyrhizobium, Methylobacterium and Staphylococus. The strong signal bands 5, 6, 1, 2, 11, and 12 belong to the following genera: Chitinophaga, Semiminiature and Cloacibacterium, Chitinophaga, Lactobacillus, Bradyrizobium, Methylbacterium and Staphylococcus, respectively. Studies have shown that Flexicharacter sp. and Bradyrhizobium sp. and Methylbacterium sp. are the dominant species in soil and water environment [Citation23,Citation24]. Therefore, the bacterial community composition in this study can not only reflect the specific environmental conditions, but also has certain particularity.
The air bacteria in Xuzhou city are mainly distributed in Proteobacteria, Bacteroidetes and Pachytene, indicating that these bacteria are more suitable for living in the atmospheric environment, which is consistent with the research results of domestic and foreign scholars who also adopt the molecular biological method [Citation14,Citation15,Citation18,Citation25,Citation29]. Proteus bacteria are Gram-negative bacteria, widely distributed, and have a strong resistance to low temperature and radiation. The dominant bacteria in this group of samples is Flexicharacter sp., and several bacteria in this genus are opportunistic pathogens, which can cause infection of plant roots or animal wounds and cause various kinds of inflammation. There are also Acinetobacter species in this group of samples. They are opportunistic pathogenic bacteria from water and widely distributed in nature. Many kinds of bacteria in this genus are resistant to antibiotics. The infection caused by this genus of bacteria has increased in recent ten years. In addition, Candidatus saccharacteria in the sample is also a kind of opportunistic pathogen, which is harmful to children, immunosuppressive or immunodeficient patients and even the normal people. Air microorganism with different particle size can deposit in different parts, such as large particle size particles can be trapped in the upper respiratory tract, while small particle size particles can enter the lung through the upper respiratory tract, so air microorganism with different particle size has different inhalation risks [Citation31]. The bacterial community structure in the fine particle size of the sample is more abundant than that in the coarse particle size. When haze occurs, the concentration of all kinds of pathogens in the fine particle size will increase, and the pathogens will also appear in the fine particle size.
Figure 8. DGGE 16S rDNA phylogenetic tree
Future research perspectives
Microbes in the air are closely related to human life. Therefore, it is of great significance to study and monitor the concentration, species, distribution, and variation of airborne microorganisms.
Many researchers have conducted research on microorganisms in the air, but the level of research is generally low. Most researchers focus on the health risks of contamination of various chemical components, and few studies on the toxicity and harm of microbial populations have been reported. Future research perspectives of this work are the impact of microbial components in particulate matter on health risks, and the interaction between microorganisms and other major pollutants (SO2, NOx and O3) in polluted air.
Conclusion
In this study, PM10 and PM2.5 pollution levels and their changes in different functional areas and seasons of typical industrial cities in Northern Jiangsu were investigated. The proportion of fine particles (PM2.5) in PM10 is larger than that of coarse particles (about 58%). The physicochemical properties of PM2.5 were analyzed by SEM and EDS. Denaturing gradient gel electrophoresis (DGGE) was used to study the distribution characteristics of bacterial community structure on atmospheric particulates (TSP, PM2.5 and PM10) in different functional areas of Xuzhou city in the winter haze. Based on the analysis of microbial diversity and community similarity in different particle sizes, it was found that the microbial populations in Xuzhou city atmospheric particles were mainly divided into three groups: Proteobacteria, Bacteroidetes and Pachytenella. The community structure of bacteria in fine particle size was more abundant than that in coarse particle size. When haze occurs, the concentration of all kinds of pathogens in fine particle size will increase, and the pathogens also will appear in fine particle size.
Competing interests
The authors declare that they have no competing interests.
Authors’ contributions
Xingcheng Yuan performed the project supervision, writing manuscript, and editing. Guangchao Li conducted the literature search. Weihua Yang was involved in the analysis interpretation of data. Dan Li analyzed and interpreted the measured data regarding SEM and EDS. All authors read and approved the final manuscript.
Authors’ information
Affiliation
School of Chemistry and Materials Science, Jiangsu Key Laboratory of Green Synthetic Chemistry for Functional Materials, Jiangsu Normal University, Xuzhou 221,116, P.R. China
Xingcheng Yuan, Guangchao Li, Weihua Yang, Dan Li
Supplemental Material
Download ()
Acknowledgements
The authors would like to specially thank the support from the project on the natural science foundation of the colleges and universities in Jiangsu province (Foundation item No. 15KJD610003).
Disclosure statement
No potential conflict of interest was reported by the authors.
Data availability statement
The datasets used and/or analyzed during the current study are available from the corresponding author on reasonable request.
Supplementary material
Supplemental data for this article can be accessed here.
Additional information
Funding
Related Research Data
References
- Gao G K, Wang J S, Wu S C, et al. Statistical research on the influence of haze contaminants on population health in Shanghai. Administration Tech Environ Monit. 2019;31:17–22.
- Wang J L, Shi X P, Zhao W X, et al. Analysis of meteorological conditions in a serious smog pollution event in Qingdao in 2016. Meteorol Sci Technol. 2016;46:1251–1257.
- Huang L K, Xu Y Y, Wang G Z, et al. Study on pollution characteristics and toxic effects of fine particulate matter in Harbin, China. China Environ Sci. 2019;39:5326–5332.
- Jiang L, He S X, Zhou H F. Spatial-temporal characteristics and convergence trends of PM2.5 pollution: a case study of cities of air pollution transmission channel in Beijing-Tianjin-Hebei region, China. J Clean Prod. 2020;256. DOI:10.1016/j.jclepro.2020.120631.
- Tang S T, Zhou X H, Zhang J Z, et al. Characteristics of water-soluble organic acids in PM2.5 during haze and Chinese Spring Festival in winter of Jinan, China: concentrations, formations, and source apportionments. Environ Sci Pollut Res. 2020;27:12122–12137.
- Xu H, Xiao Z M, Chen K, et al. Spatial and temporal distribution, chemical characteristics, and sources of ambient particulate matter in the Beijing-Tianjin-Hebei region. Sci Total Environ. 2018;658:280–293.
- Yu S Y, Liu W J, Xu Y S, et al. Characteristics of perfluoroalkyl acids in atmospheric PM10 from the coastal cities of the Bohai and Yellow Seas, Northern China. Environ Pollut. 2018;243:1894–1903.
- Evans S E, Dueker M E, Logan J R, et al. The biology of fog: results from coastal Maine and Namib Desert reveal common drivers of fog microbial composition. Sci Total Environ. 2018;647:1547–1556.
- Bassam M. Indoor and outdoor microbial aerosols at the holy mosque: a case study. Atmos Pollut Res. 2015;6:990–996.
- Graham K E, Prussin A J, Marr L C, et al. Microbial community structure of sea spray aerosols at three California beaches. FEMS Microbiol Ecol. 2018;94:1–9.
- Grinshpun S A, Adhikari A, Honda T, et al. Control of aerosol contaminants in indoor air: combining the particle concentration reduction with microbial inactivation. Environ Sci Technol. 2007;41:606–612.
- Zhang J L, Huang S X, Tian M Y, et al. Microbial aerosol in Beijing-Tianjin-Hebei region of Eastern China. Int J Environ Pollut. 2017;61:89–97.
- Dueker M E, Weather K C, O’Mullan G D, et al. Environmental controls on coastal coarse aerosols: implications for microbial content and deposition in the near-shore environment. Environ Sci Technol. 2011;45:3386–3392.
- Du P R, Du R, Ren W S, et al. Variations of bacteria and fungi in PM2.5 in Beijing. China Atmos Environ. 2018;172:55–64.
- Fan X Y, Gao J F, Pan K L, et al. More obvious air pollution impacts on variations in bacteria than fungi and their co-occurrences with ammonia-oxidizing microorganisms in PM2.5. Environ Pollut. 2019;251:668–680.
- Gangamma S, Patil R S, Mukherji S. Characterization and proinflammatory response of airborne biological particles from wastewater treatment plants. Environ Sci Technol. 2011;45:3282–3287.
- Li Y P, Lu R, Li W X, et al. Concentrations and size distributions of viable bioaerosols under various weather conditions in a typical semi-arid city of Northwest China. J Aerosol Sci. 2017;106:83–92.
- Liu H, Hu Z C, Zhou M, et al. The distribution variance of airborne microorganisms in urban and rural environments. Environ Pollut. 2019;247:898–906.
- Rui L, Li Y P, Li W X, et al. Bacterial community structure in atmospheric particulate matters of different sizes during the haze days in Xi’an, China. Sci Total Environ. 2018;637:244–252.
- Xie Z S, Li Y P, Lu R, et al. Characteristics of total airborne microbes at various air quality levels. J Aerosol Sci. 2017;116:57–65.
- Xu A L, Song Z W, Lang X L, et al. Seasonal variability in bacterial and fungal diversity and community composition of the near-surface atmosphere in coastal megacity. Aerobiologia. 2017;33:555–575.
- Bryan N C, Stewart M, Granger D, et al. A method for sampling microbial aerosols using high altitude balloons. J Microb Meth. 2014;107:16–18.
- Lee S H, Lee H J, Kim S J, et al. Identification of airborne bacterial and fungal community structures in an urban area by T-RFLP analysis and quantitative real time PCR. Sci Total Environ. 2010;408:1349–1357.
- Nieto-Caballero M, Savage N, Keady P, et al. High fidelity recovery of airborne microbial genetic materials by direct condensation capture into genomic preservatives. J Microbiol Methods. 2018;157:1–3.
- Urakawa H, Martens-Habbena W, Stahl DA. High abundance of ammonia-oxidizing archaea in coastal waters, determined using a modified DNA extraction method. Appl Environ Microb. 2010;76:2129–2135.
- Yuan X C, Qian X, Zhang R B, et al. Performance and microbial community analysis of a novel bio-cord carrier during treatment of a polluted river. Bioresour Technol. 2012;117:33–39.
- Schloss P D, Westcott S L, Ryabin T, et al. Introducing mothur: open-source, platform-independent, community-supported software for describing and comparing microbial communities. Appl Environ Microbiol 2009;75(23):7537–7541.
- Dong L J, Qi J H, Shao C C, et al. Concentration and size distribution of total airborne microbes in hazy and foggy weather. Sci Total Environ. 2015;541:1011–1018.
- Yamaguchi N, Ichijo T, Sakotani A, et al. Global dispersion of bacterial cells on Asian dust. Sci Rep-UK. 2012;2:525–530.
- Li J, Li M Z, Shen F X, et al. Characterization of biological aerosol exposure risks from automobile air conditioning system. Environ Sci Technol. 2013;47:10660–10666.
- Li S, Li Y L, Zhang L, et al. Application of real-time polymerase chain reaction (PCR) in detection of microbial aerosols. Environ Forensics. 2013;14:16–19.