
ABSTRACT
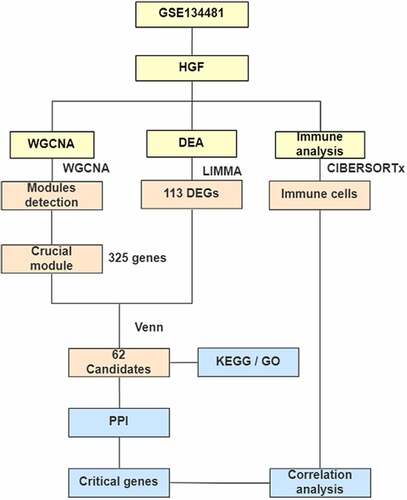
The correlation between oral bacteria and dental implants failure has been reported. However, the effect and mechanism of bacteria during dental implants is unclear. In this study, we explored key genes and candidate gene clusters in human gingival fibroblasts (HGF) cells in response to Streptococcus oralis biofilm through weighted gene co-expression network analysis (WGCNA) and differential genes analysis using gene expression matrix, GSE134481, downloaded from the Gene Expression Omnibus (GEO) database. We obtained 325 genes in the module significantly associated with S. oralis infection and 113 differentially expressed genes (DEGs) in the S. oralis biofilm; 62 DEGs indicated significant correlation with S. oralis injury. Multiple immune pathways, such as the tumor necrosis factor (TNF) signaling pathway, were considerably enriched. We obtained a candidate genes cluster containing 12 genes – IL6, JUN, FOS, CSF2, HBEGF, EDN1, CCL2, MYC, NGF, SOCS3, CXCL1, and CXCL2; we observed 5 candidate hub genes associated with S. oralis infection – JUN, IL6, FOS, MYC, and CCL2. The fraction of macrophage M0 cells was significantly increased in biofilm treatment compared with control; expression of FOS and MYC was significantly positively correlated with macrophage M0 cells. Our findings present a fierce inflammation changes in the transcript level of HGF in response to S. oralis.
Graphical Abstract
Introduction
Dental implants are inserted to replace missing teeth and support crowns, bridges, and prostheses. With improvements in implant design and surgical strategies, the mean survival and success rates (>10 years) reached 94.6% and 89.7%, respectively [Citation1]. The success of osseointegration contributes to the survival of implants. Systemic diseases, therapeutic methods, and living habits affect biological processes such as diabetes, osteoporosis, HIV, radiotherapy for neck and head cancers, and smoking can impact the outcomes of implants [Citation2]. The duration of dental implants primarily relies on environmental soft tissues, which could form a protective seal against colonized bacteria [Citation3]. Gingival fibroblasts, one soft tissue, are responsible for re-epithelialization, microbial host defense, and the inflammatory response [Citation4]. Healthy implants maintain a fully developed soft tissue seal [Citation2,Citation5].
Another critical factor related to implant success and survival is pre-implant diseases, such as implant-associated infection (IAI), usually induced by wound contamination and pre-implant tissue infection [Citation6]. Wang et.al found that suppuration at the site of peri-implant mucositis could increase the risk of microbial diseases [Citation7]. There is a relationship between bacterial colonization on implant surfaces and peri-implant disease. Biofilm, formed on the implant surface, could trigger inflammatory destruction of the peri-implant tissues [Citation5]. Oral bacteria, mainly streptococci, colonized 30 min after implant insertion [Citation8]. The Streptococcus oralis has been widely reported in multiple systemic diseases such as cancers [Citation9], neutropenia [Citation10], and cardiovascular diseases [Citation11]. Previous studies have found that the colonization of S. oralis was considered to anchor other pathogenic colonizers and enhance their pathogenicity [Citation12,Citation13]. Alexandra, et al. compared the effects of S. oralis biofilm on two peri-implant soft tissues – human gingival epithelial cells (HGEps) and fibroblasts (HGFs) – and found that compared with HGEps, HGFs were likely to respond to S. oralis and the abundance of S. oralis was beneficial to soft tissues when the mucosa is uninjured [Citation14]. However, our understanding of the molecular mechanism underlying the response of HGFs to S. oralis remains unclear.
Weighted gene co-expression network analysis (WGCNA) was commonly employed to detect complex associations between genes and phenotypes. Unlike strategies that rely on differentially expressed genes (DEGs) analysis, WGCNA focuses on gene co-expression and correlation networks, which was widely used for biomarkers and therapeutic targets. Genes can be grouped into a co-expression module based on their similar expression profiles [Citation15]. WGCNA was reported to distinguish key pathways and genes in the dynamic progression of HCC [Citation16]. WGCNA was also performed to identify the surrogate prognostic biomarkers for allergic asthma in nasal epithelial brushing samples [Citation17]. LncRNA-mRNA network was analyzed after MEK1/2 inhibition based on WGCNA in pancreatic ductal adenocarcinoma [Citation18]. Cancer stem cell characteristics in liver hepatocellular carcinoma were examined via WGCNA of transcriptome stemness index [Citation19]. Hoang et al. combined the DEGs analysis, WGCNA of expression matrix, and DNA methylation and found that alcohol could suppress KDM6B expression, which disorders the differentiation of odontogenic/osteogenic [Citation20].
In this study, we constructed a weighted gene co-expression network and obtained gene clusters that were significantly associated with S. oralis treatment in HGFs. In combination with DEGs analysis, we obtained 62 candidate genes related to S. oralis induced responses. We performed functional enrichment analysis to explore their potential roles in pathways and functional processes related to S. oralis infection. The protein–protein interactions were constructed to depict the interaction networks of candidate genes. We explored the S. oralis-related critical genes cluster and hub genes based on interactions of PPI analysis. The immune infiltration and the correlation between crucial genes and immune cells were analyzed.
Materials and methods
1 Data collection and preprocess
To identify genes in human gingival fibroblasts cells in response to S. oralis infection, we searched the largest publicly available database, Gene Expression Omnibus (GEO). We selected the gene expression dataset GSE134481 [Citation14], containing 24 samples for analysis. We annotated the expression data based on its sequencing platforms: GPL13497, Agilent-026652 whole human genome microarray. The resulting data were normalized using the quantile method via limma package for further analysis, and low expression genes were discarded.
2 WGCNA network construction and module identification
WGCNA was applied to construct the co-expression network of genes and collect significant modules highly associated with S. oralis treatment. Detailly, the detection was performed to identify and discard genes with missing value; cluster tree was constructed to test the outliers; network topology analysis was performed to choose the soft-thresholding power and the adjacencies were calculated and transformed into Topological Overlap Matrix (TOM); the corresponding dissimilarity was calculated and hierarchical clustering tree of genes was produced. Modules with very similar expression patterns were identified through The Dynamic Tree Cut and merged. Genes' relationship to trait and important modules were quantified through Gene Significance (GS) and Module membership (MM). Genes in the most significant module associated with clinical traits were identified for further analysis. The eigengene network was visualized with the ‘TOMplot’ function of WGCNA with heatmap.
3 Collection of DEGs of significant modules
To obtain differentially expressed genes linked to S. oralis infection, DEGs analysis was carried out with the expression matrix collected from GEO. In detail, we constructed contrary treatments matrix of samples and performed DEGs with limma package based on normalized expression data; we defined DEGs with parameters |log2FC| > 1 and adjusted P-value < 0.05; The distribution of DEGs was depicted via volcano plot. Candidate DEGs associated with S. oralis treatment were obtained via overlapping DEGs and genes in significant modules and used for further analysis.
4 Functional enrichment analysis
Genes identified from the WGCNA’s most significant modules, with differential expression, related to clinical features (S. oralis infection) were employed for functional analysis. The Database for Annotation, Visualization, and Integrated Discovery (DAVID) provides a comprehensive set of functional annotation tools to understand the biological meaning. DAVID database was used to identify enriched biological terms for Gene Ontology (GO) analysis. Kyoto Encyclopedia of Genes and Genomes (KEGG) enrichment analysis was performed through the DAVID database to analyze the enriched pathway. We depicted the GO enriched analysis with a circle plot; the KEGG enriched analysis was visualized with Cytoscape (https://cytoscape.org/).
5 PPI network construction
To illustrate the functional interactions among proteins, genes gained from the WGCNA and DEGs analysis were utilized to construct the PPI network. The PPI network was built using an online tool STRING (https://string-db.org/) and visualized via Cytoscape software (https://cytoscape.org/). We predicted genes cluster with MCODE, a plugin of Cytoscape; the interactions among proteins were calculated and ranked with ‘Degree’ method to explore critical genes associated with S. oralis biofilm challenge.
6 Immune infiltration analysis
To explore the correlation between immune cell distributions and S. oralis biofilm, the immune infiltration analysis was conducted using an online tool CIBERSORTx (https://cibersortx.stanford.edu/). The fractions of 22 immune cells were detected to estimate the abundance of different immune cell types. The samples were divided into two groups: control and biofilm group according to the clinical information provided by submitters. The distributions of immune cells were visualized with a heatmap and violin charts. Correlation analysis between crucial genes and immune cells was calculated via the Pearson method and visualized with scatter plots.
7 Statistical analysis
The statistical significance of correlations was defined with student asymptotic p-value calculated with WGCNA package. Statistical significance of immune cells between two groups was determined with ANOVA p-value calculated with R package.
Results
1 Modules and genes related to S. oralis biofilm
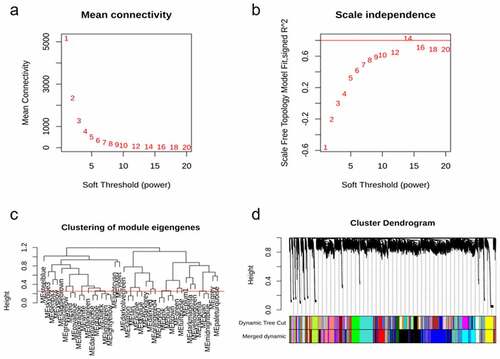
Modules or clusters, formed with a set of genes with correlated expression pattern, play a critical role in regulating tissues or organs. To identify potential gene clusters involved in human gingival fibroblast cells in response to S. oralis biofilm, we conducted WGCNA with suitable soft-thresholding power using normalized expression matrix obtained from GSE134481. Hierarchical cluster analysis indicated samples were well clustered and no outliers or strong clusters were observed. We analyzed network topology to choose the soft-thresholding power. The result showed that soft threshold 14 is the lowest power, with a scale-free topology fit index of 0.80 and a relatively high average connectivity (). We chose a medium sensitivity level: 30 as the minimum module size and 2 as the deepSplit value. We chose a height cut of 0.25 (indicating the threshold of correlation is 0.75) to merge the modules; a total of 26 gene co-expression modules were detected: module ‘black’ with 2697 genes, ‘blue’ with 2663 genes, ‘cyan’ with 1611 genes, ‘darkgreen’ with 337 genes, ‘darkgrey’ with 325 genes, ‘darkmagenta’ with 155 genes, ‘darkolivegreen’ with 186 genes, ‘darkred’ with 337 genes, ‘green’ with 714 genes, ‘greenyellow’ with 569 genes, ‘grey’ with 170 genes, ‘lightcyan’ with 447 genes, ‘orangered4ʹ with 60 genes, ‘paleturquoise’ with 215 genes, ‘plum1ʹ with 112 genes, ‘purple’ with 862 genes, ‘red’ with 1072 genes, ‘saddlebrown’ with 241 genes, ‘salmon’ with 1098 genes, ‘sienna3ʹ with 152 genes, ‘skyblue3ʹ with 136 genes, ‘steelblue’ with 232 genes, ‘turquoise’ with 1144 genes, ‘violet’ with 188 genes, ‘yellow’ with 756 genes, and ‘yellowgreen’ with 148 genes (). The module ‘grey’ contained 170 genes, suggesting that WGCNA performed well under these parameters.
Figure 1. Network construction and module detection of GSE134481. (a) and (b) Show the network topology analysis for various soft-thresholding powers. The scale-free fit index (y-axis, a) and the mean connectivity (degree, y-axis, b) as a function of the soft-thresholding power (x-axis). (c) The cluster of modules eigengenes and the threshold (red line) of modules need to be merged; (d) Clustering dendrogram of genes with dissimilarity based on the topological overlap, together with assigned module colors
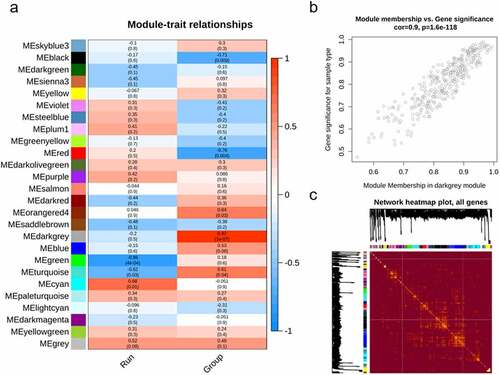
To determine the highest level of association significance, the correlation between the modules and the clinical traits was analyzed. We observed that the ‘darkgrey’ module, containing 325 genes, indicated most significant correlation with S. oralis biofilm (). We depicted the correlation of the darkgrey module membership and gene significance and observed significant correlation (cor = 0.9 and p = 1.6e-118) (). The cluster and correlation of all genes were depicted with heatmap ().
Figure 2. Gene significance and module membership of GSE134481. The association of modules and traits were constructed (a); each row refers to a module eigengene, column to a trait. The relationship between MM and GS was depicted (b); c shows the visualization of the network
2 Functional enrichment of genes related to S. oralis biofilm
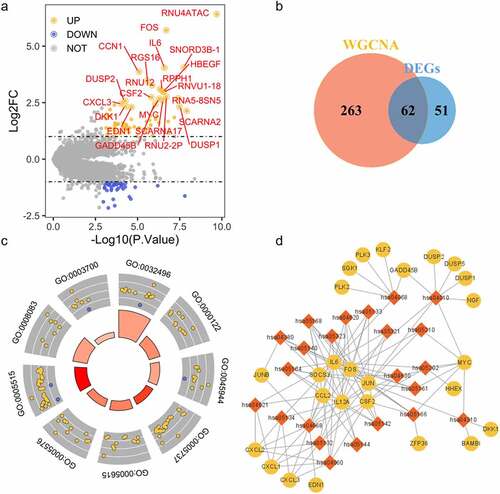
Based on DEGs analysis, we secured 113 differentially expressed genes (45 down-regulated genes and 68 up-regulated genes) and depicted with a volcano plot; crucial DEGs with adjusted P-value < 0.001 and |logFC| > 2 were labeled (). To obtain candidate genes with correlation of S. oralis biofilm and different expression, we integrated and overlapped DEGs and genes in module ‘darkgrey’ and collected 62 DEGs associated with S. oralis infection () for further analysis. GO enriched analysis signaled that 62 candidate genes could be significantly (P < 0.05) enriched in 113 GO terms, including 94 terms in Biological Process (BP), 3 terms in Cellular Component (CC), and 16 terms in Molecular Function (MF). The detailed information was provided in Supplementary Table 1; the top three terms of each category were visualized with a circle plot (). We observed 23 significantly enriched (P< 0.05) KEGG terms; the results were transformed into network format and visualized with Cytoscape ().
Figure 3. Function of DEGs in significant modules. (a) Shows volcano plot of DEGs; yellow points refer to up-related genes, blue points to down-regulated genes. (b) Displays the Venn plot of genes in significant modules and DEGs. (c) Depicts the circle plot of GO terms (top three terms of each category) of overlapped genes; (d) represents the network of KEGG enrichment analysis, red diamonds refer to the ID of KEGG terms, circles to genes (yellow refers to up-regulation, blue to down-regulation)
3 Protein–protein networks of consensus genes
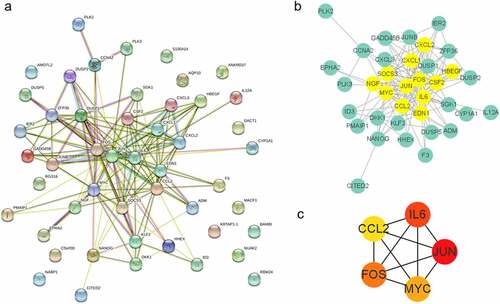
Proteins participate in regulation of molecular processes via forming molecular machines with PPIs, instead of acting alone. To obtain ‘molecular machines’ of HGFs under S. oralis biofilm, the overlapping genes from the most prominent modules of WGCNA and DEGs were applied to construct the PPI network. The interaction among proteins was visualized using Cytoscape (). We collected genes with interactions (edges in the plot) and explored gene clusters with MCODE of Cytoscape. The gene cluster, containing 12 genes: IL6, JUN, FOS, CSF2, HBEGF, EDN1, CCL2, MYC, NGF, SOCS3, CXCL1, and CXCL2, with the highest score, was visualized with Cytoscape (). We obtained five hub genes – JUN, IL6, FOS, MYC, and CCL2 – with Cytoscape using ‘Degree’ method.
Figure 4. Protein–protein interactions and functional analysis of S. oralis-related genes. (a) Shows the PPI of related genes; each node represents a gene, edge to interaction. (b) Shows the gene cluster of genes predicted by MCODE. (c) Depicts the predicted hub genes
4 Immune cells associated with S. oralis biofilm
Inflammation, caused by bacteria, plays a major role in leading to dental implants failure. We analyzed proportion of immune cells with expression matrix; fractions of 22 immune cell types were depicted using a heatmap (). Different immune cells showed different distribution levels in two groups (). No significant difference was detected in fractions of T cells CD4 native, T cells CD4 memory resting and plasma cells in S. oralis biofilm compared with control (). The fraction of macrophage M0 cell was significantly increased in biofilm treatment compared with control (). The correlation analysis between crucial genes and immune cells showed that FOS and MYC were significantly positively correlated with macrophage M0 cells ().
Figure 5. Immune cell distribution between two groups. (a) The distribution of immune cells among samples was depicted with a heatmap. (b) The fraction of immune cells in the two groups was visualized using violin plots
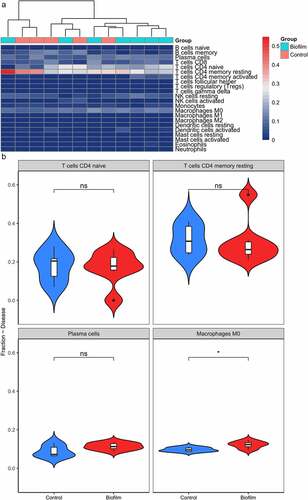
Figure 6. Correlation analysis between macrophage M0 cells and crucial genes. The correlation between macrophage M0 cells and crucial genes were visualized with scatter plots
Discussion
Some scientists have hypothesized that certain groups are prone to implant failure (including dental implant failure) [Citation21,Citation22]. Thus, this suggests, in part, that there might be critical features such as the co-work of genes, metabolites, or molecular elements that interfere with the osseointegration process. However, our research focused on this subject is still limited [Citation23–25]. We obtained 26 co-expressed gene modules and collected 325 genes in the ‘darkgrey’ module with most significant relation to S. oralis (cor = 0.9 and p = 1.6e-118) (). We overlapped 325 S. oralis-associated genes acquired from WGCNA and 113 DEGs and obtained 62 candidate DEGs related to S. oralis infection ().
TNF, a leading mediator of apoptosis, inflammation, and immunity, has been reported in numerous diseases, like sepsis, diabetes, osteoporosis, and rheumatoid arthritis. Campos et al. analyzed the relationship between the TNF-a (G-308A) gene polymorphism and early dental implant failure, which they did not observe due to limited samples [Citation26]. Petković et al. found that the TNF-α along with other cytokines and chemokines could be used as markers for peri-implant tissue condition [Citation27]. In our research, though we did not observe TNF-a, we found the significant enrichment of tumor necrosis factor (TNF) signaling pathway, which contained 11 of 62 candidate genes. Belibasakis et al. found the high similarity of gene expression of HGF in response to the various bacterial composition of subgingival biofilms [Citation28]. We observed that the enrichment of candidate genes referred to multiple pathways related to infection other bacteria like Salmonella infection and Legionellosis (). Similar to Ingendoh-Tsakmakidis, we noted the enrichment of genes on other immunity-related pathways such as cytokine-cytokine receptor interaction, NOD-like receptor signaling pathway, toll-like receptor signaling pathway, and wnt signaling pathway [Citation14]. Several associated GO terms like a cellular response to lipopolysaccharide, interleukin-1 (IL-1), wounding, cytokine, immune, inflammatory, growth factor activity, and MAPK cascade (Supplementary Table 1). Consistent with the previous study [Citation14], exposed to S. oralis infection, HGFs indicated significant response associated with inflammation in transcript level.
To explore critical genes during the response, we performed gene clusters and hub genes prediction based on PPIs. We obtained one gene cluster with 12 genes – IL6, JUN, FOS, CSF2, HBEGF, EDN1, CCL2, MYC, NGF, SOCS3, CXCL1, and CXCL2 – including 9 genes involved in TNF signaling pathway which indicates crucial role of TNF signaling in initial response of HGFs to S. oralis infection (). Ingendoh-Tsakmakidis observed the downregulation of CXCL1, CXCL8, and CCL2 after treatment with A. actinomycetemcomitans biofilm [Citation29]. The HBEGF-EGFR signaling pathway was reported in the osteoblastic process [Citation30]. Hub gene analysis revealed five hub genes including JUN, IL6, FOS, MYC, and CCL2 (). The up-regulation of IL6 was reported in multiple peri-implantitis groups, compared to healthy controls and was considered as a biomarker [Citation31,Citation32]. The stimulation of CCL2, another pro-inflammatory cytokine, was also widely reported in implant patients, especially with rough materials [Citation33]. FOS, relevant to cell proliferation, differentiation, transformation, and apoptotic cell death, has been proven to be required in tooth eruption. Combined with function analysis, we found that the molecular regulation of HGFs in the confrontation of S. oralis challenge mainly focused on pro-inflammatory processes.
We analyzed the inflammation status of HGFs treated by S. oralis and normal cultures. Majority of immune cells showed no obvious difference in HGFs under S. oralis treatments, which can be observed from the bad cluster of two groups based on proportion of immune cells and boxplots of specific immune cells (). Similarly, no optic difference of features such as cell morphology of HGFs were obtained after 2 h biofilm challenge of S. oralis in previous research [Citation14]. We noticed significant accumulation of macrophages M0 in HGFs under S. oralis challenges. Correlation analysis revealed that FOS and MYC expression was positively related to the proportion of macrophage M0 (). The interactions between macrophages and dental or orthopedic metallic implants were widely reported [Citation34,Citation35]. Monocytes/macrophages were one of the first cell types that interact with dental and orthopedic metallic implants [Citation35]. Previous study observed opposite results in another primary colonizer of oral cavity, Streptococcus sanguinis; they found that THP-1 macrophage cells were killed by Streptococcus sanguinis infection and the significant increase of IL1B and TNF-a in macrophage cells [Citation36]. We compared the proportion of immune cells in another type of soft tissue, human gingival epithelial cells (HGEp), and did not observe the significant change after S. oralis infection, which indicates that the variety of two cell types under S. oralis infection. Considering limited samples, future work needs to be done to explore the association and function of accumulation of macrophages M0 under S. oralis challenges.
Besides genes with different expression, genes (like NFKBIA, XIAP, ERC1, MAP3K14, TNFSF13B, and BIRC3) located in WGCNA without significant change were enriched in multiple inflammation-related pathways such as NF-kappa B signaling pathway. He et.al identified that lipopolysaccharide (LPS) could stimulate the expression of interleukin-8 (IL-8) via NF-kappa B in human dental pulp stem cells (hDPSCs) [Citation37]. Baus-Domínguez et al. reported the differential expression of TNFSF13B in immune and inflammatory disorders [Citation38]. The TGF-beta signaling pathway is engaged in the whole process of tooth morphogenesis [Citation39]. Takemura et al. found that the loading of titanium plates could trigger the apoptotic process of cells [Citation40]. These illustrates the dramatic inflammation processes of HGFs caused by S. oralis in the initial phase when we could not observe significant change using conventional method.
Conclusion
We identified 62 candidate genes under S. oralis infection in HGF through WGCNA and differentially expressed genes analysis. These genes are enriched in pathways related to immunity, inflammation, and infection; five hub genes – JUN, IL6, FOS, MYC, and CCL2 – and a cluster of 12 genes contribute critically in the response of HGFs to S. oralis. We observed dramatic inflammatory reaction of transcript level of HGF under S. oralis infection, which indicates the essentiality to secure the integrality of implant-mucosa interface.
Availability of data and material
The datasets used and/or analyzed during the current study are available from the corresponding author on reasonable request.
Authors’ contributions
Xia Chen conducted most of the analysis of data. Xia Chen and Jianfeng Ma wrote and revised the manuscript; All authors read and approved the final manuscript.
Highlights:
325 genes in modules significantly related to S. oralis infection were obtained;
62 genes in modules with differential expression were collected;
2 tooth-associated pathways of genes in S. oralis-related modules were observed
Supplemental Material
Download ()Acknowledgements
Not applicable.
Disclosure statement
The authors declare that they have no conflict of interest.
Supplementary material
Supplemental data for this article can be accessed here.
Additional information
Funding
References
- Moraschini V, Poubel LA, Ferreira VF, et al. Evaluation of survival and success rates of dental implants reported in longitudinal studies with a follow-up period of at least 10 years: a systematic review. Int J Oral Maxillofac Surg. 2015;44(3):377–388.
- Araujo MG, Lindhe J. Peri-implant health. J Clin Periodontol. 2018;45(Suppl 20):S230–S236.
- Bumgardner JD, Adatrow P, Haggard WO, et al. Emerging antibacterial biomaterial strategies for the prevention of peri-implant inflammatory diseases. Int J Oral Maxillofac Implants. 2011;26(3):553–560.
- Dale BA. Fascination with epithelia: architecture, proteins, and functions. J Dent Res. 2003;82(11):866–869.
- Charalampakis G, Belibasakis GN. Microbiome of peri-implant infections: lessons from conventional, molecular and metagenomic analyses. Virulence. 2015;6(3):183–187.
- Arciola CR, Campoccia D, Montanaro L. Implant infections: adhesion, biofilm formation and immune evasion. Nat Rev Microbiol. 2018;16(7):397–409.
- Wang Q, Lu H, Zhang L, et al. Peri-implant mucositis sites with suppuration have higher microbial risk than sites without suppuration. J Periodontol. 2020;91(10):1284–1294.
- Furst MM, Salvi GE, Lang NP, et al. Bacterial colonization immediately after installation on oral titanium implants. Clin Oral Implants Res. 2007;18(4):501–508.
- Ahmed R, Hassall T, Morland B, et al. Viridans streptococcus bacteremia in children on chemotherapy for cancer: an underestimated problem. Pediatr Hematol Oncol. 2003;20(6):439–444.
- Beighton D, Carr AD, Oppenheim BA. Identification of viridans streptococci associated with bacteraemia in neutropenic cancer patients. J Med Microbiol. 1994;40(3):202–204.
- De Toledo A, Nagata E, Yoshida Y, et al. Streptococcus oralis coaggregation receptor polysaccharides induce inflammatory responses in human aortic endothelial cells. Mol Oral Microbiol. 2012;27(4):295–307.
- Ammann TW, Belibasakis GN, Thurnheer T. Impact of early colonizers on in vitro subgingival biofilm formation. PLoS One. 2013;8(12):e83090.
- Xu H, Sobue T, Thompson A, et al. Streptococcal co-infection augments Candida pathogenicity by amplifying the mucosal inflammatory response. Cell Microbiol. 2014;16(2):214–231.
- Ingendoh-Tsakmakidis A, Eberhard J, Falk CS, et al. In vitro effects of streptococcus oralis biofilm on peri-implant soft tissue cells. Cells. 2020;9.
- Langfelder P, Horvath S. WGCNA: an R package for weighted correlation network analysis. BMC Bioinformatics. 2008;9(1):559.
- Yin L, Cai Z, Zhu B, et al. Identification of key pathways and genes in the dynamic progression of HCC based on WGCNA. Genes (Basel). 2018;9.
- Liu Z, Li M, Fang X, et al. Identification of surrogate prognostic biomarkers for allergic asthma in nasal epithelial brushing samples by WGCNA. J Cell Biochem. 2019;120(4):5137–5150.
- Qian J, Yang J, Liu X, et al. Analysis of lncRNA-mRNA networks after MEK1/2 inhibition based on WGCNA in pancreatic ductal adenocarcinoma. J Cell Physiol. 2020;235(4):3657–3668.
- Bai K-H, He S-Y, Shu -L-L, et al. Identification of cancer stem cell characteristics in liver hepatocellular carcinoma by WGCNA analysis of transcriptome stemness index. Cancer Med. 2020;9(12):4290–4298.
- Hoang M, Kim JJ, Kim Y, et al. Alcohol-induced suppression of KDM6B dysregulates the mineralization potential in dental pulp stem cells. Stem Cell Res. 2016;17(1):111–121.
- Weyant RJ, Burt BA. An assessment of survival rates and within-patient clustering of failures for endosseous oral implants. J Dent Res. 1993;72(1):2–8.
- Ekfeldt A, Christiansson U, Eriksson T, et al. A retrospective analysis of factors associated with multiple implant failures in maxillae. Clin Oral Implants Res. 2001;12(5):462–467.
- Feloutzis A, Lang NP, Tonetti MS, et al. IL-1 gene polymorphism and smoking as risk factors for peri-implant bone loss in a well-maintained population. Clin Oral Implants Res. 2003;14(1):10–17.
- Wilson TG Jr., Nunn M. The relationship between the interleukin-1 periodontal genotype and implant loss. Initial data. J Periodontol. 1999;70(7):724–729.
- Jacobi-Gresser E, Huesker K, Schutt S. Genetic and immunological markers predict titanium implant failure: a retrospective study. Int J Oral Maxillofac Surg. 2013;42(4):537–543.
- Campos MI, dos Santos MC, Trevilatto PC, et al. Early failure of dental implants and TNF-alpha (G-308A) gene polymorphism. Implant Dent. 2004;13(1):95–101.
- Petkovic AB, Matic SM, Stamatovic NV, et al. Proinflammatory cytokines (IL-1beta and TNF-alpha) and chemokines (IL-8 and MIP-1alpha) as markers of peri-implant tissue condition. Int J Oral Maxillofac Surg. 2010;39(5):478–485.
- Belibasakis GN, Bao K, Bostanci N. Transcriptional profiling of human gingival fibroblasts in response to multi-species in vitro subgingival biofilms. Mol Oral Microbiol. 2014;29(4):174–183.
- Ingendoh-Tsakmakidis A, Mikolai C, Winkel A, et al. Commensal and pathogenic biofilms differently modulate peri-implant oral mucosa in an organotypic model. Cell Microbiol. 2019;21(10):e13078.
- Yang M, Pan Y, Zhou Y. miR-96 promotes osteogenic differentiation by suppressing HBEGF-EGFR signaling in osteoblastic cells. FEBS Lett. 2014;588(24):4761–4768.
- Severino VO, Beghini M, de Araujo MF, et al. Expression of IL-6, IL-10, IL-17 and IL-33 in the peri-implant crevicular fluid of patients with peri-implant mucositis and peri-implantitis. Arch Oral Biol. 2016;72:194–199.
- Ghassib I, Chen Z, Zhu J, et al. Use of IL-1 beta, IL-6, TNF-alpha, and MMP-8 biomarkers to distinguish peri-implant diseases: a systematic review and meta-analysis. Clin Implant Dent Relat Res. 2019;21(1):190–207.
- Wang Y, Zhang Y, Sculean A, et al. Macrophage behavior and interplay with gingival fibroblasts cultured on six commercially available titanium, zirconium, and titanium-zirconium dental implants. Clin Oral Investig. 2019;23(8):3219–3227.
- Lin HY, Bumgardner JD. Changes in the surface oxide composition of Co-Cr-Mo implant alloy by macrophage cells and their released reactive chemical species. Biomaterials. 2004;25(7–8):1233–1238.
- Zhang Y, Cheng X, Jansen JA, et al. Titanium surfaces characteristics modulate macrophage polarization. Mater Sci Eng C Mater Biol Appl. 2019;95:143–151.
- Okahashi N, Okinaga T, Sakurai A, et al. Streptococcus sanguinis induces foam cell formation and cell death of macrophages in association with production of reactive oxygen species. FEMS Microbiol Lett. 2011;323(2):164–170.
- He W, Qu T, Yu Q, et al. LPS induces IL-8 expression through TLR4, MyD88, NF-kappaB and MAPK pathways in human dental pulp stem cells. Int Endod J. 2013;46(2):128–136.
- Baus-Dominguez M, Gomez-Diaz R, Corcuera-Flores JR, et al. Using genetics in periodontal disease to justify implant failure in down syndrome patients. J Clin Med. 2020;9(8.
- Xu X, Jeong L, Han J, et al. Developmental expression of Smad1-7 suggests critical function of TGF-beta/BMP signaling in regulating epithelial-mesenchymal interaction during tooth morphogenesis. Int J Dev Biol. 2003;47(1):31–39.
- Takemura Y, Moriyama Y, Ayukawa Y, et al. Mechanical loading induced osteocyte apoptosis and connexin 43 expression in three-dimensional cell culture and dental implant model. J Biomed Mater Res A. 2019;107(4):815–827.