
ABSTRACT
The cyclic GMP-AMP synthase-stimulator of interferon genes (cGAS-STING) pathway play a significant role in the production of inflammatory cytokines and type I interferons. This study aims to develop a cGAS-STING pathway-related genes (CSRs) prediction model to predict prognosis in gastric cancer (GC). In the present study, we used The Cancer Genome Atlas (TCGA), Gene Expression Omnibus databases (GEO), CIBERSORT and Tumor Immune Estimation Resource databases (TIMER). The risk model based on five hub genes (IFNB1, IFNA4, IL6, NFKB2, and TRIM25) was constructed to predict the overall survival (OS) of GC. Further univariate Cox regression (URC) and multivariate Cox regression (MCR) analyses revealed that this risk scoring model was an independent factor. The results were verified by GEO external validation set. Multiple immune pathways were assessed by Gene Set Enrichment Analysis (GSEA). TIMER analysis demonstrated that risk score strongly correlated with Macrophage, B cells and CD8 + T cells infiltration. In addition, through ‘CIBERSORT’ package, the higher levels of infiltration of T cell follicular assistance (P = 0.011), NK cells-activated (P = 0.034), and Dendritic cells resting (P = 0.033) exhibited in high-risk group. Kaplan–Meier (K-M) survival analysis illustrated T cells CD4 memory resting and T cells follicular helper infiltration correlated with overall survival (OS) of GC patients in TCGA and GEO databases. Altogether, the risk score model can be conveniently used to predict prognosis. The immunocyte infiltration analysis provided a novel horizon for monitoring the status of the GC immune microenvironment.
Abbreviations:TCGA: The Cancer Genome Atlas databases; GEO: Gene Expression Omnibus databases; GC: Gastric cancer; CSRs: cGAS-STING pathway-related genes; DECSRs: Differential expressed cGAS-STING pathway-related genes; PCSRs: Prognosis related cGAS-STING pathway genes; URC: Univariate Cox regression analyses; MCR: Multivariate Cox regression analyses GSEA: Gene set enrichment analysis; TIIC: Tumor-infiltrating immune cell.
Introduction
Gastric cancer (GC) is a deadly disease ranking the third leading cause of cancer-related death [Citation1,Citation2]. Most GC patients are already in the middle to late stage when diagnosed due to the occult onset and difficult to early diagnosis, leading to 5-year survival outcome is lower than 25% [Citation3,Citation4]. Despite advances in various therapeutic strategies the survival of remains poor. Hence, it is urgently needed to explore new credible prognostic-stratification tool which could be applied to clinical risk assessment. It would help them in identifying GC patients that are at higher risk for relapse and that might be suitable for closer follow-up.
The cGAS-STING DNA sensing pathway has emerged as a key component of the innate immune response. The STING is in these tumor immune interactions and has pleiotropic effects on tumors [Citation5]. The enzyme cGAS is a universal innate sensor for double-stranded DNA (dsDNA). Upon binding cytosolic dsDNA, cGAS catalyses the synthesis of cyclic GMP-AMP (cGAMP 2ʹ3ʹ), which in turn engages STING to triggers a series of cellular signaling events that consequently lead to the production of type I interferons (IFNs) and inflammatory mediators [Citation1,Citation6,Citation7]. Recently, studies revealed that the cGAS-STING pathway is closely related to tumor immunity. For instance, cGAS-STING pathway activation with antigen-presenting cells leads to production of Tap2 and MHC-I, which may enhance the tumor immune surveillance [Citation8]. Stimulation of the cGAS-STING signaling pathway increased type I IFNs and tumor-infiltrating lymphocytes (TILs) levels to trigger an immunogenic response [Citation9]. cGAS-STING-mediated type I interferon signaling augmented stem cell-like CD8 T cell differentiation and promotes antitumor T cell therapy. These findings suggest that cGAS-STING pathway genes are potential therapeutic target and may be associated with immune infiltration in patients with GC. However, the prognostic value of CSRs is currently lacking in GC.
In our study, we aimed to develop a CSRs prediction model to predict prognosis in GC. Subsequently, survival analysis, ROC curve, Nomogram, univariate and multivariate Cox regression analyses revealed that this risk scoring model was an independent factor. The results were verified by GEO external validation set. Our study may help monitoring the status of the GC immune microenvironment and provide potential targets for the immunotherapy.
Materials and methods
Data processing
The work-flow of this study is illustrated in Figure S1A. 375 GC samples and 32 normal tissues gene expression (RNA-seq) were retrieved from TCGA (https://www.cancer.gov/) [Citation10].In addition, the validation cohort microarray (GSE84437) were obtained from the GEO database(https://www.ncbi.nlm.nih.gov/geo/) [Citation11]. The clinical information is shown in the flow .
Table 1. The clinical characteristics of the patients
CSRs extract and DIfferential expressed genes (DEGs) analysis
117 CSRs were identified via the ‘cGAS-STING’ gene set from the PathCards database (https://pathcards.genecards.org/). The differential expressed cGAS-STING pathway-related genes (DECSRs) were screened with the cutoff: |logFoldChange (logFC)| > 0.5 and adjusted P value < 0.05. ‘ggplot2’ and ‘pheatmap’ packages generated Volcano plots and heat maps, respectively.
Function enrichment analysis of DECSRs
We also performed Gene Ontology (GO) functional annotations and Kyoto Encyclopedia of Genes and Genomes (KEGG) pathway enrichment analysis use of ‘clusterProfiler’ package in DECSRs [Citation12]. The diagram was made by the R language tool.
Establishment and validation of the model
We next adopted UCR was used to estimate overall survival (OS) of CSRs. Afterward, MCR was carried out to construct our prognostic risk model and correlation coefficient. Finally, the risk score was calculated as follows: the risk score = ∑i = 1 n(Expi*Coei).
Independence of the risk model
URC and MRC analysis were conducted to identify independent risk factors for survival. The ‘SurvivalROC’ of R package was constructed to assess the survival differences between groups. The nomogram was established to assess the survival probability for GC patients at 1, 2, and 3 years.
GSEA
GSEA was also used to analyze the differences pathways between the high-risk and low-risk groups. The C2.cp.kegg.v7.0.symbols.gmt dataset was obtained from the Molecular Signatures Database (MsigDB). NOM P-value <0.05, |NES| >1 and FDR q < 0.25 were considered statistically significant.
Immune infiltration analysis
TIMER database calculated the infiltration level of 6 immune cells in tumor samples from TCGA database, including B cell, T cell CD4+, T cell CD8+, Neutrophil, Macrophage, and Myeloid dendritic cell [Citation13]. It was used to explore the association of the risk scores and the abundance of six immune cells types (https://cistrome.shinyapps.io/timer/).
Analysis of immune infiltration in high and low-risk groups
The CIBERSORT applied to estimate the proportions of tumor-infiltrating immune with a deconvolution algorithm. Violin plots were utilized to visualize the distribution of the differences in 22 types of infiltrating immune cells [Citation14].
Statistical analysis
R software (version 4.0.3) and SPSS software (version 24.0) were used to complete all the statistic work. The survival curve was constructed using survival package via the K-M method. The R package ‘survivalROC’ was employed to analyze prediction efficiency in two groups. P value < 0.05 was considered the cutoff value for significance.
RESULTS
This study aimed to develop a CSRs prediction model to predict prognosis in GC. Then, UCR and UCR analyses revealed that this risk scoring model was an independent factor. The results were verified by GEO external validation set. Finally, TIMER analysis demonstrated that risk score strongly correlated with immune infiltration. Our study may help monitoring the status of the GC immune microenvironment and provide potential targets for the immunotherapy.
Various genes differentially expressed with GC progression
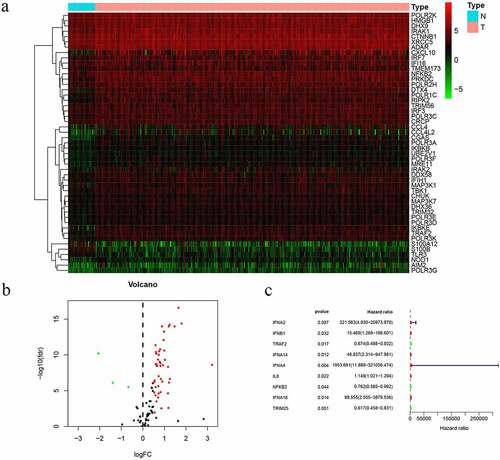
In the study, we collected 32 normal tissues and 375 tumors of GC from TCGA database. The 49 differentially expressed CSRs, 46 genes were upregulated, while 3 genes were downregulated and drawing differential heatmap and volcano plot ( and b). UCR analysis determined that nine prognosis-related cGAS-STING pathway genes (PCSRs) were independently associated with GC patient OS ().
Figure 1. Prognostic differentially expressed CSRs. a. Heatmap of differentially expressed CSRs. b. Volcano plots of differentially expressed CSRs. c. UCR analysis for the CSRs identification in the TCGA patient cohort
Gradually upregulated/downregulated genes involved in multiple immune-related functions and pathways
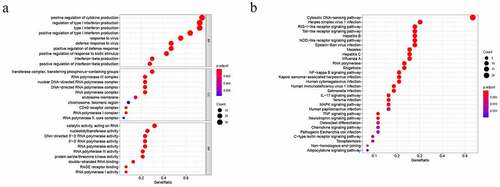
To better understand the biological significance, we conducted enrichment analysis of the 49 differentially expressed CSRs. In molecular function (MF), the main functions of these genes were catalytic activity, acting on RNA, nucleotidyltransferase activity, RNA polymerase activity, and 5ʹ−3ʹ RNA polymerase activity. Cellular component (CC) mainly involved transferase complex, transferring phosphorus−containing groups, RNA polymerase III complex, nuclear DNA−directed RNA polymerase complex, and DNA−directed RNA polymerase complex. In biological processes (BP), the functions of these genes were mainly involved in positive regulation of cytokine production, regulation of type I interferon production, type I interferon production, positive regulation of type I interferon production, and response to virus (). Besides, KEGG pathway annotation showed that these differentially expressed CSRs were significantly enriched in Cytosolic DNA−sensing pathway, RNA polymerase, RIG−I− like receptor signaling pathway, Toll−like receptor signaling pathway and NF−kappa B signaling pathway ().
Figure 2. Biological function analysis of differentially expressed CSRs: GO analysis (a) and KEGG pathways analysis (b)
Establishment and validation of the prognostic risk model
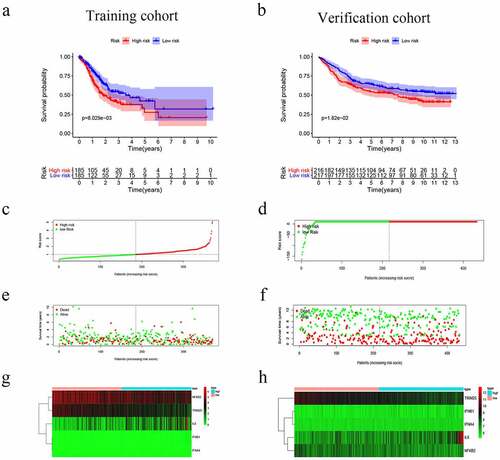
The nine genes were further analyzed by MCR analysis, and finally, five genes (IFNB1, IFNA4,IL6,NFKB2 and TRIM25) related to the prognosis of GC were obtained. The coefficients of each gene are shown in . Risk scores = (2.180× IFNB1 Exp) + (4.871× IFNA4 Exp) + (0.135× IL6 Exp) + (−0.366× NFKB2 Exp) + (−0.466× TRIM25 Exp). Patients were divided into high-risk (n = 185) and low-risk (n = 185) groups according to the media risk score. Low-risk patients had a significantly longer OS compared with the patients in high-risk group (). The riskScore plot and survival time and status plot are shown in and , respectively. In addition, to better know the expression level of the five genes in the training set are plotted in . All these evidences were displayed in the GEO validation data set and showed this five genes model was practicable in other independent datasets (, d, f, and h).
Table 2. The coefficients of each gene
Figure 3. Risk score, reflecting overall survival, based on the CSRs signature comprising five genes, in the training and validation cohorts. (a–b) Kaplan-Meier curve for OS of patients with high- and low risk scores in the training and validation cohorts. (c–d) Risk-score distribution in the training and validation cohorts. (e–f) The survival status plot associated with risk score in the training and validation cohorts. (g–h) Heatmap of the expression of the five CSRs in the high- and low-risk groups and the training and validation cohorts
Independent prognostic value of the risk model
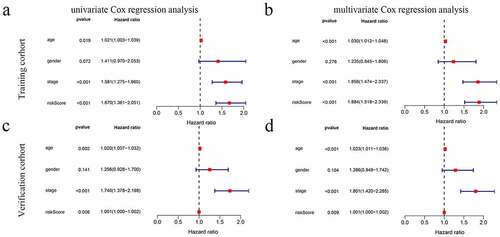
The UCR analysis revealed that patients in the high-score group had significantly shorter survival than patients in the low-score group (HR: 1.670; 95% CI: 1.361 − 2.051; P < 0.001). In addition, the clinical variables included age, stage, and stage were significantly associated with survival. A MCR further showed that the risk score (HR: 1.884; CI: 1.518 − 2.339, P < 0.001) was an independent prognostic indicator ( and b).
Figure 4. The model was combined with a regression analysis of clinical indicators. (a-b) Assessment of the contribution of each factor to GC survival by UCR and MCR analysis in training cohort. (c, d) Assessment of the contribution of each factor to GC survival by UCR and MCR analysis in verification cohort
Prognostic nomogram for the prediction of 1-, 2-, and 3-year overall survival of patients with GC was constructed base on prognostic model and clinical characteristics. (). The total points of each patient provided the estimated 1-, 2-, and 3-year survival times. indicated an ideal fitting and excellent accuracy of the nomogram. These results indicated that the nomogram demonstrated good accuracy prediction of GC patients. Moreover, we also plotted the ROC curves were performed to evaluate the accuracy of the models, with the area under the curve (AUC) scores ranged from 0.539 to 0.630 ().
Figure 5. The ROC curves and nomograms for predicting survival rate of GC. (a, c) ROC curves (receiver operating characteristics). (b, d) Nomogram
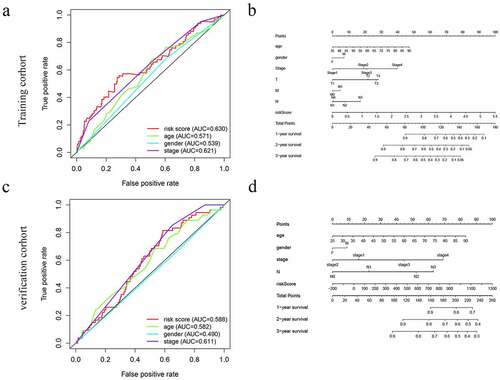
The efficacy of the prognostic model was validated by another independent cohort GSE84437, we applied the same formula to verification cohort from the GEO cohort. This finding was consistent with the results of the training cohort ( and d) ( and d).
High risk group involved in multiple immune-related pathways
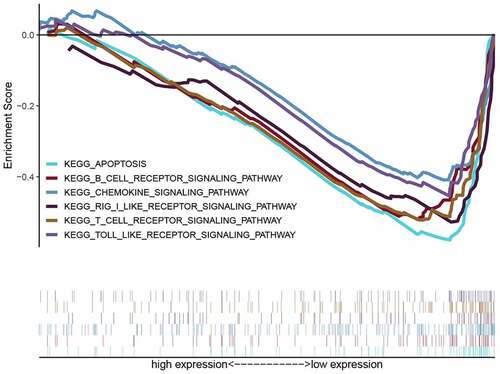
KEGG-GSEA suggested that high-risk group was markedly negatively related with immune-related biological processes, including The B cell receptor signaling pathway, Chemokine signaling pathway, RIG-I-like receptor signaling pathway, T cell receptor signaling pathway and Toll-like receptor signaling pathway ( and ).
Table 3. cGAS-STING pathway related gene sets that associated with high-risk group
Figure 6. The GSEA of possible pathways of high-risk groups in GC
Risk scores association with immune infiltration
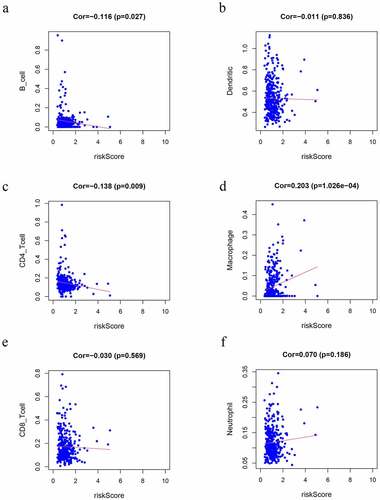
We observed that risk scores had a positive relationship with the infiltrating levels of the macrophages (r = 0.203 P = 1.026e-4) (). In contrast, CD4 + T cells (r = −0.138 P = 0.009) () and B cells (r = −0.116 P = 0.027) () had a negative relationship with risk scores (P < 0.05), which may provide a novel horizon for investigating the GC immune infiltration.
Figure 7. Correlation analysis of the risk score model and immune cell infiltration. (a) B cells, (b) DCs, (c) CD4 + T cells, (d) macrophages, (e) CD8 + T cells, (f) Neutrophils
Analysis of risk groups immune microenvironment
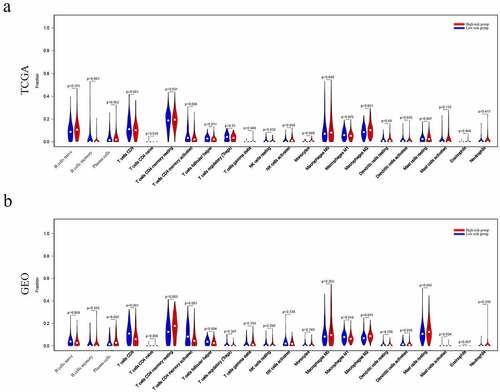
The relationship between risk groups and the tumor immune microenvironment was further analyzed. As a result, the results indicated that many immune cell types were significantly altered among groups, including B cells memory, T cell follicular assistance, NK cells activated, and Dendritic cells resting (P = 0.001, 0.011 0.034, and 0.033, respectively) in TCGA dataset (). Similarly, T cells CD8, T cells CD4 memory resting, T cells CD4 memory activated, T cells follicular helper, Macrophages M1, Macrophages M2, Dendritic cells activated, Mast cells activated and Mast cells resting (P = 0.0001, 0.003, 0.001, 0.004, 0.018, 0.0001, 0.036, and 0.034, respectively) (P = 0.045) were significantly altered among groups in GEO dataset ().
Figure 8. Immune landscape of patients from High- and Low-Riskgroups. Differences of 22 subtypes of immune cells between two groups of TCGA dataset(a), and GEO database (b)
Identification of prognostic subtypes of tumor-infiltrating immune cells (TIICs) in GC
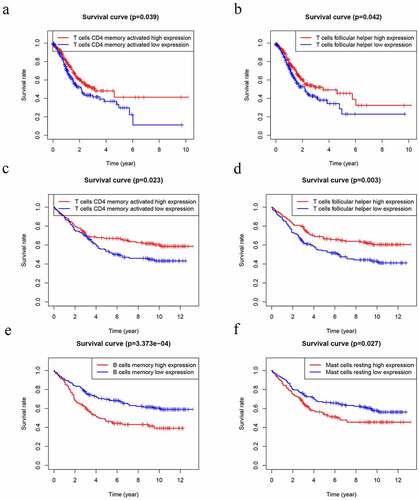
Several studies have already demonstrated that TIICs correlates with prognosis in several malignancies [Citation15]. Thus, we performed K-M analysis that tried to investigate the prognostic subtypes of TIICs. The outcome uncovered that T cells follicular helper (P = 0.039) and T cells CD4 memory activated (P = 0.042) were positively associated with worse OS of GC patients in TCGA datasets ( and b). In GEO datasets, T cells follicular helper (P = 0.003) and T cells CD4 memory activated (P = 0.023) were positively associated with worse OS ( and d). However, B cells memory (P = 3.373e-4) and Mast cells activated (P = 0.027) were negatively associated with worse OS ( and f).
Figure 9. Kaplan–Meier analysis of 22 kinds of immune cells. (a-b) The levels of T cells CD4 memory activated (a) and T cells follicular helper (b) were significantly associated with OS in patients with GC in TCGA database. (d-f) The levels of T cells CD4 memory activated (c), T cells follicular helper (d), B cells memory (e) and Mast cells resting (f) were significantly associated with OS in patients with GC in GEO database
Discussion
The cGAS-STING pathway has emerged as a potential mechanism to induce inflammation-mediated tumorigenesis. Actually, persistent activation of this pathway and its downstream effectors, such as TBK1, has been connected with chronic inflammation and cancer progression [Citation2, Citation16]. The development of GC is a multistep process that involves continuous inflammatory damage. Some studies have observed correlations between cGAS-STING pathway members, the tumor microenvironment, and cancer immunotherapy. Recent studies have analyzed that the STING activation promotes natural killer (NK) cells and CTLs responses against tumors [Citation17]. The activation of STING pathway is accompanied by down-expression of several immune inhibitory factors, including PD-L1, IDO, and FOXP3 [Citation18]. Lower expression level of STING, and STING expression levels are positively correlated with prognosis, that is, a higher STING expression level results in a better prognosis in GC patients. Therefore, the expression of CSRs was dysregulated in GC and played a crucial role in progression and prognosis of GC patients.
In our study, UCR and MCR analyses were applied to construct an CSRs risk model. Subsequent K-M analysis revealed that patients with higher risk scores exhibited lower OS. We further validated the sensitivity and accuracy of the model in the GEO database. Furthermore, our GSEA data analysis revealed that the immune pathways were significantly enriched in the high-risk group, such as The B cell receptor signaling pathway, Chemokine signaling pathway, T cell receptor signaling pathway and Toll-like receptor signaling pathway.
IFNB1 and IFNA4 belong to the type I IFNs. IFN-β1 direct anti-angiogenic, and anti-tumor on the one hand, and stimulate immune production on the other hand [Citation19]. Recently, a vesicular stomatitis virus expressing IFN-β1 was able to create a ‘comfortable’ tumor microenvironment for immune checkpoint inhibition [Citation20]. IL6 is a pro-inflammatory cytokine, which acts in the initiation of innate immune responses [Citation21]. Moreover, stromal IL6 promotes cancer immune-evasive microenvironment through metabolic reprogramming [Citation22]. NFKB2 gene is part of the NFKB pathway family genes, which is an important regulator in immune reactivity in various types of cancer including GC [Citation23]. Notably, it has been shown that NFKB directly regulates PD-L1 transcription by binding to the PD-L1 promoter [Citation24]. One of the TRIM family members, TRIM25, participates in the regulation of biological processes, including tumor cell proliferation, invasion and migration [Citation25,Citation26]. In addition, decreased TRIM25 expression in tumor tissues were positively correlated with poor prognosis of GC patients [Citation27].
Another important finding in the present study that there is a significant correlation between the risk scores and the macrophages, CD4 + T cells and B cells infiltration. Moreover, we identified differential expression of three types of immune cells between High- and Low-Risk groups. In addition, two types of TIICs are associated with OS of GC patients. Recent studies have shown that the higher CD4 + T cell density and CD4/CD8 ratio were associated with worse OS in tumor, including ductal carcinoma in situ, glioblastoma, and GC [Citation28–30]. Tumor-infiltrating B cells play a critical role in regulating the anti-tumor immune response in melanoma, and the absence of B cells is associated with a poor response to immune checkpoint inhibitors (ICIs) [Citation31,Citation32]. CD8 + T cells constitute an important part of the immune response to tumors and play a critical role in killing tumor cells [Citation33]. Macrophages could display antitumour M1 and protumour M2 phenotypes, and high density of M1 macrophages was associated with better overall survival in GC [Citation34]. This implies that cGAS-STING related genes prognostic model may act as potential prognostic indicators, as well as reflect the immune status. Collectively, this newly identified cGAS-STING-related genes risk score signature based on the combination of five genes could significantly predict the prognostic risk and might provide insight into immunotherapy in GC.
Conclusion
In summary, we developed a cGAS-STING pathway-related prognostic index of GC and the risk score model can be conveniently used to predict prognosis, and we found that the underlying molecular mechanisms may affect immune-related biological processes and TIICs, which may provide novel insights into the relationship between GC and tumor immune infiltration. However, these results need to be further validated in future studies.
Highlights
(1) A cGAS-STING pathway-related prognostic index to predict the prognosis of GC was constructed.
(2) The prognostic index is an independent index for GC prognosis.
(3) The prognostic index may affect immune-related biological processes and TIICs.
Authors’ contributions
KY and CQ contributed to the conception and design of the study; JV collected data and wrote the manuscript; KY performed the data analysis and constructed the figures and tables; KY and JV reviewed and revised the manuscript and were involved in the conception of the study. Additionally, JV was responsible for the organization, revision, and submission of this manuscript. All authors read and approved the final manuscript.
Ethics approval and consent to participate
Not applicable.
Supplemental Material
Download ()
Acknowledgements
None.
Availability of data and materials
The datasets analyzed was acquired from The Cancer Genome Atlas (TCGA) database (https://portal.gdc.cancer.gov/) and GEO database (https://www.ncbi.nlm.nih.gov/geo/).
Disclosure statement
The authors declare that they have no competing interests.
Supplementary material
Supplemental data for this article can be accessed here
Additional information
Funding
Related Research Data
References
- Zhao B, Du F, Xu P, et al. A conserved PLPLRT/SD motif of STING mediates the recruitment and activation of TBK1. Nature. 2019;569(7758):718–722.
- Ahn J, Xia T, Konno H, et al. Inflammation-driven carcinogenesis is mediated through STING. 5(5166):2014.
- Oki E, Tokunaga S, Emi Y, et al. Surgical treatment of liver metastasis of gastric cancer: a retrospective multicenter cohort study (KSCC1302). Gastric Cancer : Official Journal of the International Gastric Cancer Association and the Japanese Gastric Cancer Association. 2016;19(3):968–976.
- Smyth E, Nilsson M, Grabsch H, et al. Gastric cancer. Lancet (London, England). 2020;396(10251):635–648.
- Ishikawa H, Barber GJN. STING is an endoplasmic reticulum adaptor that facilitates innate immune signalling. Nature. 2008;455(7213):674–678.
- Guey B, Wischnewski M, Decout A, et al. BAF restricts cGAS on nuclear DNA to prevent innate immune activation. Science (New York, N.Y.). 2020;369(6505):823–828.
- Liu S, Cai X, Wu J, et al. Phosphorylation of innate immune adaptor proteins MAVS, STING, and TRIF induces IRF3 activation. Science (New York, N.Y.). 2015;347(6227):aaa2630.
- Grabosch S, Bulatovic M, Zeng F, et al. Cisplatin-induced immune modulation in ovarian cancer mouse models with distinct inflammation profiles. Oncogene. 2019;38(13):2380–2393.
- Shen J, Zhao W, Ju Z, et al. PARPi triggers the sting-dependent immune response and enhances the therapeutic efficacy of immune checkpoint blockade independent of BRCAness. Cancer Research. 2019;79(2):311–319.
- Tomczak K, Czerwińska P, Wiznerowicz M. The Cancer Genome Atlas (TCGA): an immeasurable source of knowledge. Contemporary Oncology (Poznan, Poland). 2015;19(1A):A68–77.
- NCBI. GEO: archive for functional genomics data sets-update.Nucleic Acids Research. 2013, 39(Database issue):1005–1010.
- Yu G, Wang LG, Han Y, et al. clusterProfiler: an R package for comparing biological themes among gene clusters. Omics : A Journal of Integrative Biology. 2012;16(5):284–287.
- Li T, Fan J, Wang B, et al. TIMER: a web server for comprehensive analysis of tumor-infiltrating immune cells. Cancer Research. 2017;77:e108.
- Am N, Liu CL, Green MR, et al. Robust enumeration of cell subsets from tissue expression profiles. Nature Methods. 2015;12(5):453–457.
- Dunn G, Dunn I, Curry W. Focus on TILs: prognostic significance of tumor infiltrating lymphocytes in human glioma. Cancer Immunity. 2007;7:12.
- Barbie D, Tamayo P, Boehm J, et al. Systematic RNA interference reveals that oncogenic KRAS-driven cancers require TBK1. Nature. 2009;462(7269):108–112.
- Tan Y, Sansanaphongpricha K, Xie Y, et al. Mitigating SOX2-potentiated immune escape of head and neck squamous cell carcinoma with a sting-inducing nanosatellite vaccine. Clinical Cancer Research : An Official Journal of the American Association for Cancer Research. 2018;24(17):4242–4255.
- Spranger S, Sivan A, Corrales L, et al. Tumor and host factors controlling antitumor immunity and efficacy of cancer immunotherapy. Advances in Immunology. 2016;130:75–93.
- Qin X, Tao N, Dergay A, et al. Interferon-beta gene therapy inhibits tumor formation and causes regression of established tumors in immune-deficient mice. Proceedings of the National Academy of Sciences of the United States of America. 1998;95(24):14411–14416.
- Mr P, Jacobson BA, Ji Y, et al. Vesicular stomatitis virus expressing interferon-β is oncolytic and promotes antitumor immune responses in a syngeneic murine model of non-small cell lung cancer. Oncotarget. 2015;6.
- Tanaka T, Narazaki M, Kishimoto T. IL-6 in inflammation, immunity, and disease. Cold Spring Harbor perspectives in biology. 2014;6.
- Kesh K, Garrido V, Dosch A, et al. Stroma secreted IL6 selects for “stem-like” population and alters pancreatic tumor microenvironment by reprogramming metabolic pathways. Cell Death & Disease. 2020;11(11):967.
- AJAroi B. The NF-kappa B and I kappa B proteins: new discoveries and insights. Annual Review of Immunology. 1996;14:649–683.
- Gang H, Qianjun W, Yongliang Z, et al. NF-KB plays a key role in inducing CD274 expression in human monocytes after lipopolysaccharide treatment. Plos One. 2013;8:e61602.
- Liu J, Wu W, Xie Y, et al. Overexpression of TRIM66 functions as an oncogene in lung cancer progression. 2016;9: 4966–4977.
- Suzuki, Research TJCC. Estrogen-responsive finger protein as a new potential biomarker for breast cancer. Clinical Cancer Research : An Official Journal of the American Association for Cancer Research. 2005;11(17):6148–6154.
- Research CC, Jj C, Yl R, Cj S, et al. JP3, an antiangiogenic peptide, inhibits growth and metastasis of gastric cancer through TRIM25/SP1/MMP2 axis. Journal of Experimental & Clinical Cancer Research. 2020;39.
- Thike A, Chen X, Koh V, et al. Higher densities of tumour-infiltrating lymphocytes and CD4 T cells predict recurrence and progression of ductal carcinoma in situ of the breast. Histopathology. 2020;76(6):852–864.
- Han S, Zhang C, Li Q, et al. Tumour-infiltrating CD4(+) and CD8(+) lymphocytes as predictors of clinical outcome in glioma. British Journal of Cancer. 2014;110(10):2560–2568.
- Zhuang Y, Peng L, Zhao Y, et al. Increased intratumoral IL-22-producing CD4(+) T cells and Th22 cells correlate with gastric cancer progression and predict poor patient survival. Cancer Immunology, Immunotherapy : CII. 2012;61(11):1965–1975.
- Durgeau A, Virk Y, Corgnac S, et al. Recent advances in targeting CD8 T-Cell immunity for more effective cancer immunotherapy. Frontiers in immunology. 2018;9:14.
- Griss J, Bauer W, Wagner C, et al. B cells sustain inflammation and predict response to immune checkpoint blockade in human melanoma. Nature Communications. 2019;10(1):4186.
- Fu Q, Chen N, Ge C, et al. Prognostic value of tumor-infiltrating lymphocytes in melanoma: a systematic review and meta-analysis. OncoImmunology. 2019;8:1–14.
- Gambardella V, Castillo J, Tarazona N, et al. The role of tumor-associated macrophages in gastric cancer development and their potential as a therapeutic target. Cancer Treatment Reviews. 2020;86:102015.