
ABSTRACT
Testicular cancer is the most common malignant tumor in young men, and its incidence has increased in recent years. The tumor microenvironment (TME) plays a crucial role in the development and progression of tumors; however, the TME of testicular germ cell tumor (TGCT) is poorly understood. In this study, we downloaded information for 156 TGCT cases from The Cancer Genome Atlas (TCGA) database, used the ESTIMATE method to determine immune and stromal scores, and used CIBERSORT to calculate the proportion of tumor-infiltrating immune cells (TICs). The differentially expressed genes were subjected to a COX regression analysis and used for the construction of a protein–protein interaction (PPI) network. Toll-like receptor 2 (TLR2) was identified as a predictive marker by combining the results of the Cox regression analysis and PPI network. A survival analysis showed that TLR2 was positively correlated with TGCT survival. A gene set enrichment analysis indicated that genes in the high TLR2 expression group were enriched for cell adhesion molecules (CAMs) and the chemokine signaling pathway, and genes in the low TLR2 expression group were mainly enriched in the spliceosome. Regarding proportions of TICs, naive B cells and follicular helper T cells were negatively correlated with the expression of TLR2. This suggests that as TLR2 expression increases, the immunocompetence of the TME decreases. The expression of TLR2 may affect the prognosis of TGCT, suggesting that this locus can be used as a prognostic factor for TGCT.
Introduction
Testicular cancer is a malignancy commonly seen in men aged 14–44 years. The incidence of testicular cancer is increasing worldwide [Citation1]. The pathological types can be divided into germ cell tumors and non-germ cell tumors, of which germ cell tumors account for 98% [Citation2]. Fortunately, the cure rate is high, and the 5-year relative survival rate has increased from 83% to 97% over the past few decades [Citation1]. Owing to the high survival rate of patients with testicular cancer, relatively few studies have explored the mechanism underlying its occurrence and development as well as the treatment modalities. The chance of contralateral recurrence of testicular cancer has been reported to be 2–5%, and patients are less sensitive to radiotherapy and chemotherapy after recurrence than before [Citation3,Citation4]. Therefore, it is necessary to identify specific markers that can accurately predict the prognosis of testicular germ cell tumors (TGCT).
Numerous studies have shown that the tumor microenvironment (TME) plays an important role in the development of tumors and has a substantial impact on treatment and clinical outcomes [Citation5,Citation6]. The TME is mainly composed of stromal cells and immune cells [Citation7]. Tumor-associated stromal cells play a key role in the TME [Citation8]. It has been shown that tumor-infiltrating immune cells (TICs) in the TME have prognostic value for TGCT [Citation9]. In this study, we obtained TGCT samples from The Cancer Genome Atlas (TCGA) database, scored the immune and stromal components of the samples using the ESTIMATE computational method, calculated the proportions of TICs in the samples using the CIBERSORT method, and identified a candidate biomarker, TLR2. Our results suggest that TLR2 can be used as a prognostic factor for TGCT and plays an important role in the TME of TGCT.Our hypothesis is that this study can obtain relevant prognostic factors for testicular cancer. The aim of this study is to obtain the prognostic factors of testicular cancer and explore its role in the immune microenvironment of testicular cancer.Our goal is to guide the clinical trial of testicular cancer through this study.
Methods
Raw data
Transcriptome RNA-seq data and clinical data for 156 patients with TGCT were downloaded from TCGA. The immune and stromal components of each sample were scored using the ‘ESTIMATE’ package [Citation10] in R version 4.0.2 by determining the immuneScore, stromalScore, and ESTIMATEScore. The ESTIMATEScore is defined as the sum of the immune and stromal scores. The scores are positively correlated with the ratio of the corresponding component, with higher scores indicating a higher frequency of the component in the TME.
Survival analysis
According to the three scores and the expression levels of genes, the samples were divided into two groups: high-score and low-score groups. Kaplan–Meier survival curves were then plotted, and the log-rank test was used to evaluate significance. Statistical significance was defined as p < 0.05.
Differentially expressed genes for Immunescore and Stromalscore
Differentially expressed genes (DEGs) between the high-score and low-score groups were identified using the ‘limma’ package [Citation11] of R. The thresholds were set to |fold change| > 2 and false discovery rate (FDR) < 0.05. A heatmap of the DEGs was drawn using the ‘pheatmap’ package for R.
Enrichment analysis
A Gene Ontology (GO) enrichment analysis and Kyoto Encyclopedia of Gene and Genomes (KEGG) pathway enrichment analysis of 98 DEGs were performed using the ‘clusterProfiler’ ‘enrichplot’ and ‘ggplot2ʹ packages [Citation12] of R. Only p-values and q-values of <0.05 indicated significant enrichment.
Analysis of difference in clinical stage scores
The clinical data downloaded from TCGA were analyzed using R. We used the Wilcoxon or Kruskal-Wallis rank sum test, and samples at different clinical stages were compared.
Construction of a protein–protein interaction network
Protein–protein interaction (PPI) networks were constructed using the STRING tool (https://string-db.org/) and were reconstructed using Cytoscape (confidence interval [CI] = 0.95). The CI for interactions was >0.95.
COX regression analysis
A univariate COX regression analysis was performed using the ‘survival’ package in R.
Gene set enrichment analysis
Using GSEA software, the transcriptomes of all tumor samples were evaluated by a GSEA, setting p < 0.05 and FDR q < 0.06.
Analysis of relative proportions of TICs
The relative proportions of TICs in tumor samples were calculated using the CIBERSORT algorithm [Citation13] and then filtered to select samples with p < 0.05 for subsequent analyses.
Results
In this study, we used the ESTIMATE method to determine the immune score and mesenchymal score in testicular cancer based on data from the TCGA database, and the CIBERSORT method to calculate the proportion of tumor-infiltrating immune cells (TICs) in testicular cancer. We hypothesize that the relevant prognostic factors for testicular cancer can be obtained through our method. The goal of this study is to provide guidance for the clinical treatment of bladder cancer. In this study, we obtained the relevant prognostic factor TLR2 of testicular cancer through the above methods, and conducted survival analysis of the gene and evaluated the role of the gene in the immune microenvironment.
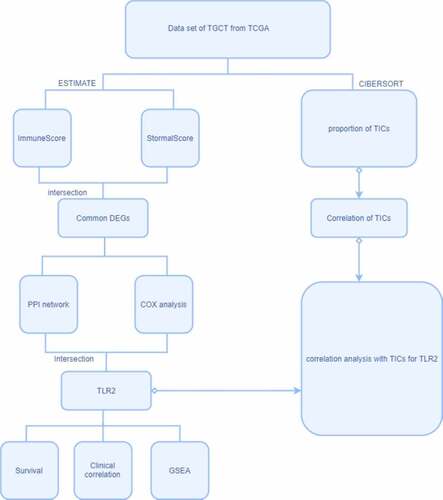
The process of analysis
The general analysis procedure is illustrated in . Briefly, we downloaded data from TCGA, scored samples using the ESTIMATE method, and evaluated TICs using the CIBERSORT method. The immune and stromal scores were then used to construct a PPI network and to perform a COX regression analysis. By evaluating the intersection between the hub genes in the PPI network and the most significant genes in the COX regression analysis, we obtained TLR2. We then performed a single-gene survival analysis, clinical correlation analysis, GSEA, and TIC correlation analysis for TLR2.
Figure 1. The process of analysis
Correlations between immune and stromal scores and prognosis
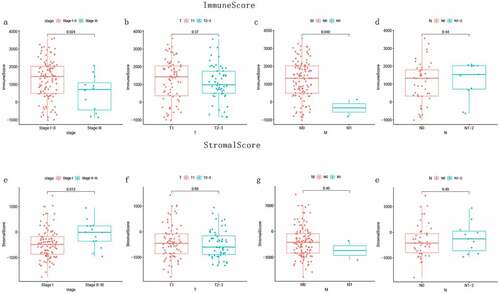
The stromalScore was negatively correlated with patient survival ()). However, there was no significant correlation between the immuneScore and patient survival ()). Subsequently, we compared the correlation between clinicopathological stage and scores. As shown in , the immune score was negatively correlated with the tumor stage ()); However, during progression from stage I to stage II–III, the stromal score increased ()). These results showed that immune and stromal scores are correlated with the progression of TGCT.
Figure 2. Correlation of scores with survival in TGCT patients. (a) Kaplan-Meier survival curve for StromalScore, log-rank test p = 0.045. (b) Kaplan-Meier survival curve for ImmuneScore, log-rank test p = 0.193. (c) Kaplan-Meier survival curve for ESTIMATEScore, log-rank test p = 0.089
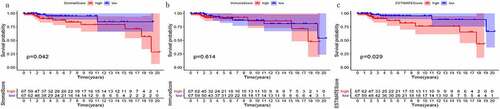
Figure 3. Correlation of ImmuneScore and StromalScore with clinical stage of the tumor. (a-d) Correlation between ImmuneScore and clinical stage of tumor. (e-h) Correlation between ImmuneScore and clinical stage of tumor. (i-l) Correlation between ESTIMATEScore and clinical stage of tumor
Identification of DEGs
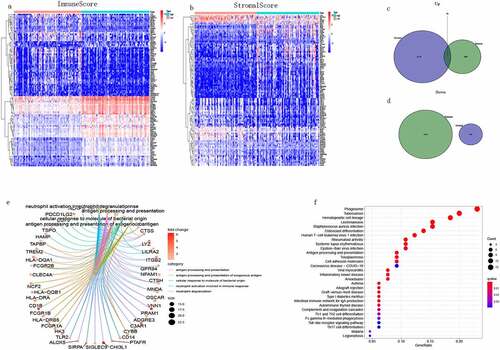
DEGs between low-score and high-score groups were analyzed using R. A total of 958 upregulated DEGs and 1605 downregulated DEGs were identified in the analysis of immuneScores ()); and 2276 upregulated DEGs and 306 downregulated DEGs were identified in the analysis of stromalScores (). By an intersection analysis (as visualized using Venn diagrams), 98 genes were co-differentially expressed in the high-score groups based on both the immune and stromal scores. Interestingly, no gene was co-expressed in the low-score groups for immune and stromal scores. Subsequently, we performed GO and KEGG pathway analyses of the 98 co-expressed DEGs. The results of the GO analysis showed that DEGs were mainly enriched in antigen processing and neutrophil activation involved in immune responses ()), and these terms were all associated with immunity. The results of the KEGG analysis showed that DEGs were mainly enriched in Phagosome, Hematopoietic cell lineage, and Tuberculosis pathways ()). Based on the enrichment analysis, the function of DEGs may be related to the immune response, indicating that the immune response plays an important role in the TME of TGCT.
Figure 4. Heatmap of DEGs, Venn diagram and enrichment analysis of DEGs. (a) Heatmap of DEGs produced by comparison between high and low ImmuneScore groups. Row names are gene names, column names are samples that do not display id, blue represents high grouping and red represents low grouping. (b) Heatmap of DEGs in the StromalScore group. (c, d) The common up-regulated and down-regulated DEGs of two groups. (e, f) The 98 DEGs were subjected to GO and KEGG enrichment analysis
Construction of a PPI network and COX regression analysis
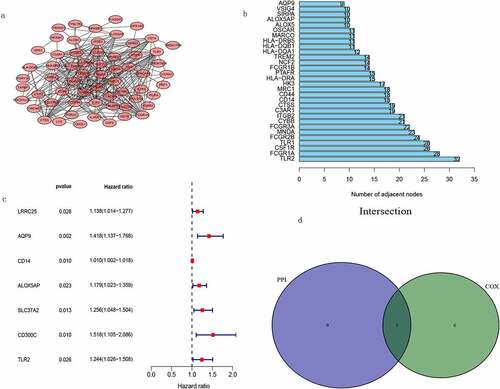
PPI networks were constructed using the online tool STRING to analyze the links between DEGs, which were then reconstructed using Cytoscape version 3.7.2 ()). We selected the top 30 genes with the most nodes ()). Subsequently, we performed a Cox regression analysis to identify associations between these genes and TGCT ()). We then evaluated the intersection between the top 10 genes with respect to the number of nodes in the PPI network and the genes identified in the univariate regression analysis. The result is shown in ), we obtained the gene TLR2.
Figure 5. PPI network and univariate COX regression analysis. (a) PPI network after cytoscape reconstruction. (b) Top 30 genes with the highest number of nodes. (c) Forest plot obtained from univariate COX regression analysis. (d) Venn diagram obtained by taking the intersection of the most significant genes obtained from COX analysis and the top ten genes obtained from PPI network
Clinical correlation analysis of TLR2
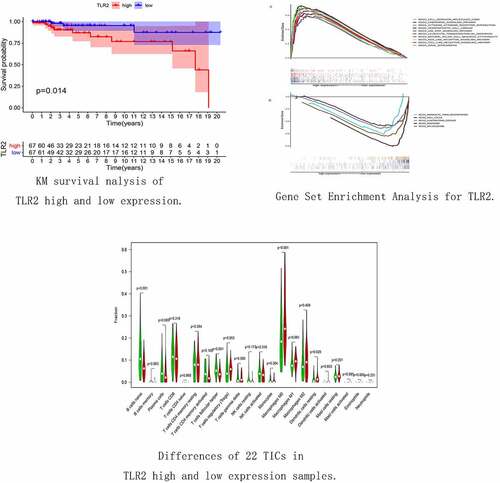
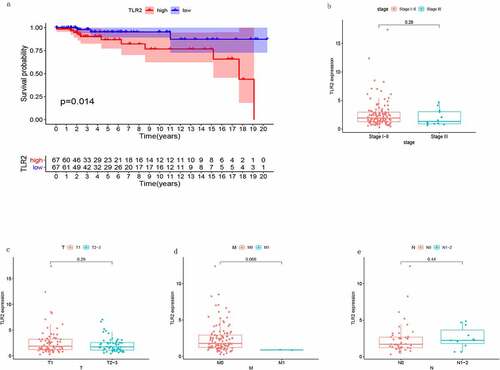
We analyzed the relationship between the expression level of TLR2 and TGCT. The results of the survival analysis are shown in ). Patients with high TLR2 expression had lower survival than patients with low TLR2 expression. his indicated that TLR2 expression may be associated with the prognosis of TGCT. However, there were no significant differences in TLR2 expression among different tumor stages ().
Figure 6. Association of TLR2 with TGCT patient survival as well as tumor clinical stage. (a) TLR2 expression and survival analysis of TGCT patients, the patients were divided into high TLR2 expression group and low TLR2 expression group. (b-e) Correlation between TLR2 expression and clinical stage of tumors
Gene set enrichment analysis for TLR2
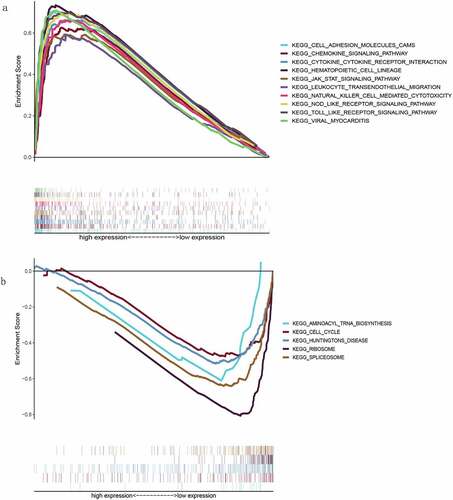
The samples were divided into high and low groups according to the expression level of TLR2 and subsequently analyzed using GSEA version 4.1.0. In the high TLR2 expression group, genes were mainly enriched in Cell adhesion molecules (CAMs), Chemokine signaling pathway, and Toll-like receptor signaling pathway, all of which were associated with immune responses ()). In the low TLR2 expression group, however, genes were mainly enriched in the Spliceosome and Cell cycle ()). These results indicate that there is a strong correlation between TLR2 and the TME of TGCT.
Figure 7. Gene Set Enrichment Analysis for TLR2. (a) Pathways enriched in samples with high TLR2 expression. (b) Pathways enriched in samples with low TLR2 expression
Correlation between TICs and TLR2
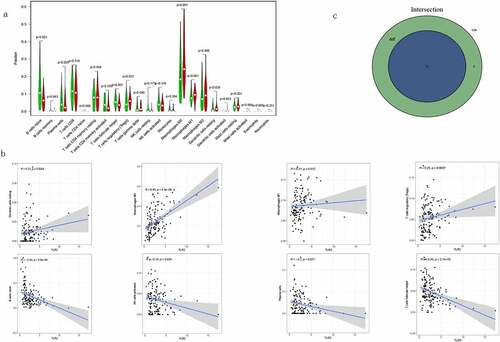
We evaluated the proportions of 22 TICs determined using the CIBERSORT algorithm in TGCT samples ()). We then performed differential and correlation analyses to further confirm the association between TLR2 and TME. The differential analysis showed that four kinds of TICs were associated with TLR2 expression ()). The correlation analysis showed that eight kinds of TICs were associated with the expression levels of TLR2 ()). Taking the intersection of the results of the two analyses, we obtained four kinds of TICs associated with TLR2 expression (), ). Among these, M0 macrophages and dendritic cells were positively correlated with the expression of TLR2, and naive B cells and follicular helper T cells were negatively correlated with the expression of TLR2. These results further demonstrate that the expression level of TLR2 plays an important role in the immune response in the TME.
Table 1. TICs co-determined by differential analysis and correlation analysis
Figure 8. Proportion analysis of TICs and correlation analysis of TGCT samples. (a) Histogram of the proportion of 22 TICs in TGCT tumor samples. (b) Heatmap of the correlation between the 22 TICs, with numbers in boxes representing the p-value of the correlation between the two cells. The chromaticity of the circles in the box represents the corresponding p-value between two cells. Significance test was performed using Pearson coefficient
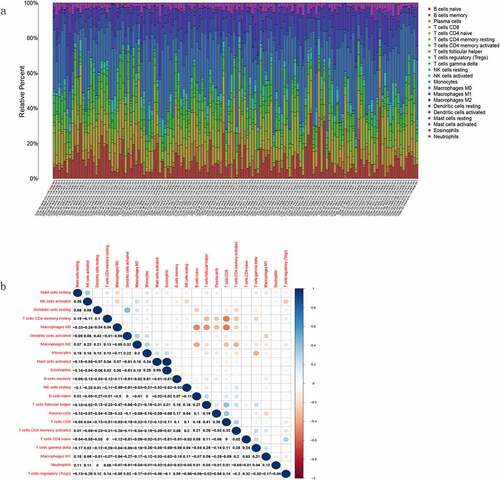
Figure 9. Correlation between TLR2 expression and TICs. (a) Violin plots demonstrated the differences of 22 TICs in TGCT samples with high and low TLR2 expression. Red represents high TLR2 expression and green represents low TLR2 expression. (b) Scatter plots showed that eight TICs were correlated with BTK expression. Significance test was performed using Pearson coefficient. (c) Venn diagrams demonstrate TICs associated with TLR2 expression common to violin diagrams and scatter diagrams
Discussion
Many studies have revealed that the TME plays an important role in the development of tumors [Citation5,Citation14]. However, there are still relatively few studies of the TME in TGCT. Therefore, exploring the mechanisms underlying immune functions of the TME in TGCT as well as finding effective prognostic markers may provide a basis for predicting survival and can provide new strategies for the treatment of TGCT.
In this study, we analyzed the expression profiles of patients with TGCT, explored genes related to the TME, and analyzed associations between genes and prognosis. The ESTIMATE algorithm has been shown to be feasible in breast, lung and pancreatic cancers, among others [Citation15–17]. Compared with previous studies, our novelty is that we have analyzed the immune microenvironment of testicular cancer for the first time and performed an immune infiltration analysis on it. The stromal score was correlated with patient survival, and a correlation analysis for the relationship between the stromal score and tumor stage showed that the stromal score increased from stage I to stage II and showed a decreasing trend from stage II to stage III. However, the difference was not significant, and we speculated that the results may be explained by the small number of samples. The immune score was negatively correlated with the tumor stage, but only M stage (and not T and N stages). We speculate that tumor development may be associated with the individual tumor characteristics, while the effect of immune infiltration is not obvious [Citation13].
We then identified 98 common upregulated DEG based on stromal and immunological scores. The results of GO and KEGG pathway analyses showed that the DEGs were mainly involved in the immune response. We obtained TLR2 based on both the PPI network and the univariate COX analysis. As there were non-tumor samples in the dataset, we did not perform a differential expression analysis between normal and tumor tissues, which is a limitation of this study. The survival analysis indicated that the expression of TLR2 was negatively correlated with patient survival. The GSEA showed that high TLR2 expression was mainly enriched in immune-related pathways, such as CAMs and Chemokine signaling pathway. This indicates that the immune response is enhanced in the TME as the expression of TLR2 is increased. TLR2 is a member of the Toll-like Receptor (TLR) family, a transmembrane receptor family that is part of the innate immune system [Citation18]. Chang et al found that TLR2 drives innate immune responses and activates adaptive immune responses in the brain TME [Citation19]. It has been suggested that in ovarian cancer, the upregulation of TLR2 may attenuate immunosuppression by activating atypical pathways [Citation20]. In these studies, TLR2 plays an anti-tumor role by enhancing the immune response. Interestingly, this is not consistent with the results of our study. Some studies have shown that TLR2 can promote the development of tumors, such as human glioma [Citation21], lung cancer [Citation22], melanoma [Citation23] and breast cancer [Citation24]. The pro-tumorigenic role of TLR2 may be achieved by promoting proliferation and preventing apoptosis in cancer cells [Citation25]. Accordingly, we speculated that TLR2 may have different effects in tumors (i.e., it may promote or inhibit tumors). In testicular cancer, TLR2 may play a pro-tumorigenic role.
With respect to the proportions of TICs, TLR2 expression was positively correlated with M0 macrophages and dendritic cells. These cells are involved in the innate immunity, further confirming the role of TLR2 in immune responses. These results suggest that TLR2 functions to modulate immunity in the TME of TGCT. As TLR2 has the ability to regulate immunity, TLR2 agonists can enhance the anti-tumor immune response. Although TLR2 agonists are candidates for the treatment of tumors [Citation18,Citation26–28], there is no clear clinical evidence establishing the clinical value of TLR2 agonists. Moreover, TLR2 agonists may cause TLR2 activation in tumor cells and tumor-associated macrophages, thereby promoting tumor development [Citation29]. In addition, TLR2 expression is negatively correlated with naive B cells and follicular helper T cells, which may indicate that the tumor-promoting effect of TLR2 in testicular cancer inhibits part of the immune response. But our study has limitations, and we need more independent datasets as well as further experiments to validate our conclusions.
Conclusions
In conclusion, using the ESTIMATE algorithm and a series of differential analyses, we identified TLR2 may as a relevant prognostic factor for TME in TGCT. However, further studies are needed to determine the precise role of TLR2 in the TME and the related molecular mechanisms in order to provide better recommendations for the clinical treatment of TGCT.
Highlights
1. The TLR2 gene found in this study may be a prognostic factor for testicular cancer. 2.TLR2 may play a tumor-promoting role in testicular cancer. 3.This study has a guiding role in the clinical treatment of testicular cancer.
Abbreviations
TME: tumor microenvironment; TGCT: testicular germ cell tumor; TCGA: The Cancer Genome Atlas; TICs: tumor-infiltrating immune cells; PPI: protein–protein interaction; TLR: Toll-like receptor; CAMs: cell adhesion molecules; DEGs: Differentially expressed genes; FDR: false discovery rate; GO: Gene Ontology; KEGG: Kyoto Encyclopedia of Gene and Genomes.
Author contributions
L.Z. and L.F.Z. conceived and designed this study, H.W. and Z.Y.Z. wrote the main manuscript text, S.L.G. and prepared tables, C.L. and Z.Z. prepared the figures, H.W. and X.Y.X. revisited the manuscript. All the authors approved the submission of this study.
Data availability statement
All data sets for this study are available in the TCGA database (https://portal.gdc.cancer.gov).
Disclosure statement
No potential conflict of interest was reported by the author(s).
Additional information
Funding
References
- Smith ZL, Werntz RP, Eggener SE. Testicular cancer: epidemiology, diagnosis, and management. Med Clin North Am. 2018;102(2):251–264.
- Ji C, Wang Y, Wang Y, et al. Immune-related genes play an important role in the prognosis of patients with testicular germ cell tumor. Ann Transl Med. 2020;8(14):866.
- Adra N, Abonour R, Althouse SK, et al. High-dose chemotherapy and autologous peripheral-blood stem-cell transplantation for relapsed metastatic germ cell tumors: the indiana university experience. J Clin Oncol. 2017;35(10):1096–1102.
- Capocaccia R, Gatta G, Dal Maso L. Life expectancy of colon, breast, and testicular cancer patients: an analysis of US-SEER population-based data. Ann Oncol. 2015;26(6):1263–1268.
- Wu T, Dai Y. Tumor microenvironment and therapeutic response. Cancer Lett. 2017;387:61–68.
- Quail DF, Joyce JA. Microenvironmental regulation of tumor progression and metastasis. Nat Med. 2013;19(11):1423–1437.
- Hanahan D, Coussens L. Accessories to the crime: functions of cells recruited to the tumor microenvironment. Cancer Cell. 2012;21(3):309–322.
- Bussard KM, Mutkus L, Stumpf K, et al. Tumor-associated stromal cells as key contributors to the tumor microenvironment. Breast Cancer Res. 2016;18:1.
- Yamada Y, Nakagawa T, Sugihara T, et al. Prognostic value of CD66b positive tumor-infiltrating neutrophils in testicular germ cell tumor. BMC Cancer. 2016;16(1):898.
- Bi KW, Wei XG, Qin XX, et al. Potential to be a prognostic factor for lung adenocarcinoma and an indicator for tumor microenvironment remodeling: a study based on TCGA data mining. Front Oncol. 2020;10:424.
- Ritchie M, Phipson B, Wu D, et al. limma powers differential expression analyses for RNA-sequencing and microarray studies. Nucleic Acids Res. 2015;43(7):e47.
- Yu G, Wang L, Han Y, et al. clusterProfiler: an R package for comparing biological themes among gene clusters. OMICS. 2012;16(5):284–287.
- Sun W, Shi H, Yuan Z, et al. Prognostic value of genes and immune infiltration in prostate tumor microenvironment. Front Oncol. 2020;10:584055.
- Hui L, Chen Y. Tumor microenvironment: sanctuary of the devil. Cancer Lett. 2015;368(1):7–13.
- Qu Y, Cheng B, Shao N, et al. Prognostic value of immune-related genes in the tumor microenvironment of lung adenocarcinoma and lung squamous cell carcinoma. Aging (Albany NY). 2020;12(6):4757–4777.
- Li B, Geng R, Wu Q, et al. Alterations in immune-related genes as potential marker of prognosis in breast cancer. Front Oncol. 2020;10:333.
- Meng Z, Ren D, Zhang K, et al. Using ESTIMATE algorithm to establish an 8-mRNA signature prognosis prediction system and identify immunocyte infiltration-related genes in Pancreatic adenocarcinoma. Aging (Albany NY). 2020;12(6):5048–5070.
- Lu BL, Williams GM, Brimble MA. TLR2 agonists and their structure-activity relationships. Org Biomol Chem. 2020;18(27):5073–5094.
- Chang CY, Jeon SB, Yoon HJ, et al. Glial TLR2-driven innate immune responses and CD8(+) T cell activation against brain tumor. Glia. 2019;67(6):1179–1195.
- Silveira H, Lupi L, Romagnoli G, et al. P-MAPA activates TLR2 and TLR4 signaling while its combination with IL-12 stimulates CD4+ and CD8+ effector T cells in ovarian cancer. Life Sci. 2020;254:117786.
- Li C, Ma L, Liu Y, et al. TLR2 promotes development and progression of human glioma via enhancing autophagy. Gene. 2019;700:52–59.
- Zhang M, Zhou Y, Zhang Y. High Expression of TLR2 in the serum of patients with tuberculosis and lung cancer, and can promote the progression of lung cancer. MBE. 2019;17(3):1959–1972.
- Yang H, Cui B, Liu H, et al. Blocking TLR2 activity attenuates pulmonary metastases of tumor. PloS One. 2009;4(8):e6520.
- Conti L, Lanzardo S, Arigoni M, et al. The noninflammatory role of high mobility group box 1/Toll-like receptor 2 axis in the self-renewal of mammary cancer stem cells. FASEB J. 2013;27(12):4731–4744.
- Tye H, Kennedy CL, Najdovska M, et al. STAT3-driven upregulation of TLR2 promotes gastric tumorigenesis independent of tumor inflammation. Cancer Cell. 2012;22(4):466–478.
- Zom GG, Willems M, Khan S, et al. Novel TLR2-binding adjuvant induces enhanced T cell responses and tumor eradication. J Immunother Cancer. 2018;6(1):146.
- Lu BL, Williams GM, Verdon DJ, et al. Synthesis and evaluation of novel TLR2 agonists as potential adjuvants for cancer vaccines. J Med Chem. 2020;63(5):2282–2291.
- Ohadian Moghadam S, Nowroozi MR. Toll-like receptors: the role in bladder cancer development, progression and immunotherapy. Scand J Immunol. 2019;90(6):e12818.
- West AC, Tang K, Tye H, et al. Identification of a TLR2-regulated gene signature associated with tumor cell growth in gastric cancer. Oncogene. 2017;36(36):5134–5144.