
ABSTRACT
Acute myocardial infarction (AMI) was considered a fatal disease resulting in high morbidity and mortality; platelet activation or aggregation plays a critical role in participating in the pathogenesis of AMI. The current study aimed to reveal the underlying mechanisms of platelets in the confrontation of AMI and potential biomarkers that separate AMI from other cardiovascular diseases and healthy people with bioinformatic strategies. Immunity analysis revealed that the neutrophil was significantly decreased in patients with SCAD compared with patients with ST-segment elevation myocardial infarction (STEMI) or healthy controls; monocytes and neutrophils showed potential in distinguishing patients with STEMI from patients with SCAD. Six differentially expressed genes (DEGs) showed great performances in differentiating STEMI patients from SCAD patients with AUC greater than 0.9. Correlation analysis showed that these six DEGs were significantly positively correlated with neutrophils; three genes were negatively correlated with monocytes. Weighted gene co-expression network analysis (WGCNA) found that module ‘royalblue’ had the highest correlation with STEMI; genes in STEMI-related module were enriched in cell–cell interactions, blood vessels’ biological processes, and peroxisome proliferator-activated receptor (PPAR) signaling pathway; four genes (FN1, CD34, LPL, and WWTR1) represented the capability of identifying patients with STEMI from healthy controls and patients with SCAD; two genes (ARG1 and NAMPTL) were considered as novel biomarkers for identifying STEMI from SCAD; FN1 represented the potential as a novel biomarker for STEMI. Our findings indicated that the distribution of neutrophils could be considered as a potential molecular trait for separating patients with STEMI from SCAD.
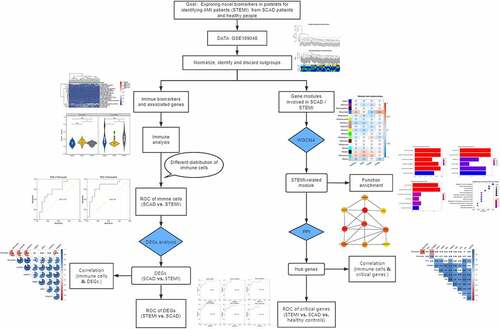
Graphical Abstract
Introduction
Acute myocardial infarction (AMI) remains one of the leading reasons for morbidity and mortality worldwide, despite the improvements in prognosis and therapy. Early and accurate diagnoses can guarantee immediate medical care, thus reducing the death rate and enhancing prognoses [Citation1]. AMI is an event of ischemic myocardial necrosis, caused by an acute interruption of myocardial blood flow [Citation2]. It is a subgroup of acute coronary syndromes and can be divided into ST-segment elevation myocardial infarction (STEMI) or non-ST-elevation myocardial infarction (NSTEMI) [Citation3]. Cardiac troponin T (cTn), I or T, is considered as a gold standard biomarker for AMI; the unconventionally increase of cTn, however, generally refers to myocardial necrosis which might be caused by other diseases such as heart failure, myocarditis, and chest trauma, while renal failure may also lead to increased cTnI [Citation4]. There is an urgent need for new biomarkers, especially molecular features with high sensitivity and specificity in the early stages of AMI, to narrow the diagnostic period and boost the outcome of patients with AMI.
Platelets, containing nuclei and RNAs, maintain a strong presence in mediating the genesis and progression of atherosclerosis; multiple genes involved in platelets have been reported to be associated with coronary artery disease [Citation5,Citation6]. Platelet activation is characteristic of acute coronary syndromes (ACSs) caused by coronary atherosclerotic plaque rupture or thrombogenic substances exposure, contributing to the construction of intraluminal thrombus, and thus reducing coronary blood flow [Citation7]. Neutrophils are the most abundant circulating leucocytes in healthy people and the first immune cells during infection or injury [Citation8]. AMI causes a sterile inflammatory response, and neutrophils have been reported to play a vital role in the process of myocardial inflammation [Citation9]. The previous research showed that neutrophil-derived S100A8/A9 could amplify granulopoiesis after myocardial infarction (MI) [Citation10]. A calcium-sensing receptor on neutrophil promoted myocardial apoptosis and fibrosis via NLRP3 inflammasome activation after AMI [Citation11]. The compromised anti-inflammatory action of neutrophil extracellular traps in PAD4-Deficient mice aggravated acute inflammation after MI [Citation12]. Neutrophils were involved in post-MI cardiac repair through polarizing macrophages to a reparative phenotype [Citation13]. Analysis of the proportion of immune states of platelets and molecular changes of platelets in patients with AMI, compared with other cardiovascular diseases (CVDs), such as stable coronary artery diseases (SCAD), was limited.
In this study, we aimed to analyze immune cell changes and explore novel biomarkers in platelets associated STEMI with expression profiles of blood platelets from the Gene Expression Omnibus (GEO) database. Immune cell fractions from patients with different cardiovascular diseases (STEMI and SCAD, in this study) and healthy donors were analyzed; correlation analysis between genes and immune cells was performed. Functional enrichment analysis and protein–protein interactions (PPI) predictions of genes involved in STEMI-related module identified by WGCNA were performed to explore molecular changes of platelets and critical genes, respectively. The receiver operating characteristic (ROC) curves and principal component analysis (PCA) were analyzed and depicted for diagnostic value analysis.
Methods and materials
Data collecting and processing
We downloaded an expression data GSE109048 from GEO (https://www.ncbi.nlm.nih.gov/geo/). Platelet gene expression profiling GSE109048 contains 19 STEMI patients, 19 healthy donors (HD), and 19 SCAD patients. According to the [HTA-2_0] Affymetrix Human Transcriptome Array 2.0 [transcript (gene) version] platform, probes were converted into the corresponding gene symbols. The data were normalized using the limma package for further analysis [Citation14]. A clustering tree of samples was constructed with expression, the outliers were observed and discarded.
Immune infiltration analysis
The immune infiltration analysis was performed to illustrate the correlation between immune cell distribution and AMI compared with patients with SCAD and healthy donors. The fractions of 22 immune cells were detected using a web-based tool CIBERSORTx (https://cibersortx.stanford.edu/), which can estimate the abundance of member cell types in a mixed cell population. The samples were divided into three groups: healthy individuals, SCAD, and STEMI based on disease conditions obtained from the clinical information; the proportion of immune cells was visualized and depicted using a heatmap. Immune cells with obvious variety among samples were visualized using violin plots; distributions of immune cells among different groups were compared and estimated using a T-test.
ROC analysis of immune cells and DEGs
To evaluate the diagnostic value of immune cells, ROC analysis and PCA were conducted and portrayed. To obtain the DEGs in different groups, we conducted DEGs analysis with normalized expression data of trimmed samples after clustering; adjusted P-value <0.05 were set as the cutoff to identify significantly differentially expressed genes.
Correlation analysis of DEGs and immune cells
Correlation between DEGs and fractions of immune cells was conducted to explore DEGs associated with immune cells (with different proportions among different groups). The scores and significance of the correlation were calculated using the Pearson method; correlation matrix of DEGs and immune cells selected was depicted using a heatmap; background color of correlation without significance (P > 0.01) was blanked.
WGCNA analysis
To explore the clinical traits-related modules and genes related to SCAD and AMI, the R package WGCNA was performed [Citation15]. The mean connectivity and scale independence function as soft threshold were calculated and visualized to choose the optimal power value for network construction. The adjacency matrix was converted into a topological overlap matrix (TOM) with a suitable power value. Genes were classified into different modules based on the TOM; modules with significant similarity (correlation >0.75) were merged. Correlation between modules and clinical traits was calculated and depicted; genes in the most significantly AMI-related modules were selected for further analysis.
Function analysis of crucial modules
To examine the molecular process or critical pathways of genes from crucial modules associated with AMI, functional enrichment analysis was performed using an R package clusterProfiler [Citation16]. Genes were converted into ‘ENTREZID’ and ‘UNIPORT’ format for GO and KEGG analyses, respectively. The minimum GO and KEGG term size of annotated genes was set to 10. Both P and Q values were set to 0.05 for significant enriched terms analysis.
PPI analysis of critical modules
The online database STRING (https://string-db.org/) was used to predict the interaction networks of protein-protein. Cytoscape software (https://cytoscape.org/) was used to visualize the PPI; crucial genes were predicted and ranked with Cytoscape with interactions among proteins; top 10 critical genes were selected as hub genes for this analysis; the rank and interactions of hub genes were color-coded visualized with Cytoscape. ROC analysis was performed to evaluate the diagnostic value of hub genes for patients with STEMI; the correlation between critical genes and the proportion of immune cells was analyzed. The expression of critical genes, DEGs, and immune cells were fitted by Gene Set Variation Analysis (GSVA) [Citation17]; the potential of the GSVA index as a diagnostic biomarker for distinguishing patients with STEMI was estimated via ROC analysis.
Statistical analysis
The significance of DEGs was evaluated with the limma package [Citation14]. Correlation between modules and clinical traits was performed with WGCNA package [Citation15]; the significance of enrichment of genes in function enrichment analysis was tested with clusterProfiler package [Citation16]; the correlation between genes expression and immune cells fraction were calculated using the Pearson method and test with T-test method in R package.
Results
Immune cells associated with AMI and CAD
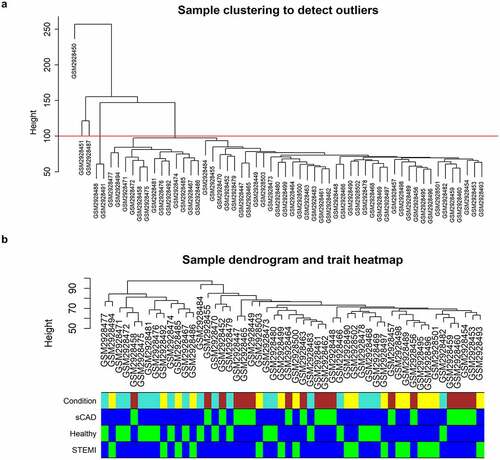
Based on the clustering dendrogram, five outliers (two SCAD samples and three STEMI samples) were observed and discarded (); 52 samples including 16 patients with STEMI, 17 patients with SCAD, and 19 healthy controls were finally utilized for this study; the color-coded clinical traits were mapped to the clustering dendrogram constructed on the samples without outgroups ().
Figure 1. Clustering dendrogram of GSE109048. (a) A clustering tree of samples was constructed with expression; cutoff for outgroups was depicted with a red line. (b) The associated clinical traits were mapped to the clustering tree without outgroups
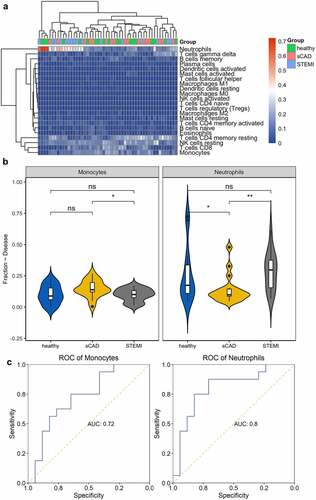
The platelet activation or aggregation participates in a crucial role in the pathogenesis of AMI; immunity analysis was performed to analyze immune cell fractions among these three groups; fractions of 22 type immune cells were visualized with a heatmap (). We observed different distributions of immune cells, such as neutrophils, T cells CD4 memory resting, NK cells resting, and monocytes among samples (). We compared the distribution of immune cells in the three groups (STEMI vs. SCAD, STEMI vs. healthy, SCAD vs. healthy) using a T-test and obtained a significant difference in the proportion of monocytes between STEMI and SCAD patients; no obvious difference was observed in disease (STEMI and SCAD) groups and healthy controls (). Neutrophils were significantly decreased in patients with SCAD compared with patients with STEMI or healthy controls; compared with the healthy group, neutrophils distribution showed no significant difference in patients with STEMI (). These two immune cells indicated potential (monocytes of AUC 0.72 and neutrophils of AUC 0.8) to separate patients with STEMI from patients with SCAD ().
Figure 2. Immune cell distribution among the three groups. (a) Heatmap was constructed to depict the distribution of immune cells among samples. (b) Comparison of immune cells in the three groups was visualized with violin plots. (c) The capability of immune cells in identifying patients with STEMI was shown using ROC plots
DEGs involved in STEMI and SCAD
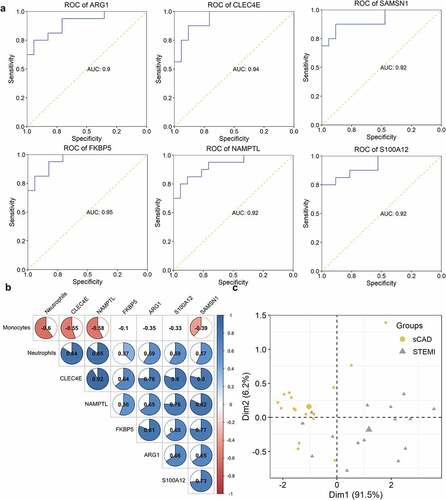
Considering the observation of the immune difference between patients with SCAD and patients with STEMI, we further analyzed differentially expressed genes in 16 STEMI patients compared with 17 SCAD patients. We obtained six DEGs: ARG1, CLEC4E, FKBP5, NAMPTL, S100A12, and SAMSN1 with an adjusted P-value <0.05. ROC results showed all DEGs had great performances (ARG1 with AUC of 0.9, CLEC4E with AUC of 0.94, FKBP5 with AUC of 0.95, NAMPTL with AUC of 0.92, S100A12 with AUC of 0.92, and SAMSN1 with AUC of 0.92) in classifying patients with STEMI from patients with SCAD (). Correlation of DEGs and fraction of two immune cells (neutrophils and monocytes) was analyzed; we observed a significant positive correlation between neutrophils and expressions of six DEGs (); two of these genes (CLEC4E and NAMPTL) indicated a relatively high correlation (0.84 and 0.85, respectively); expression of three genes (CLEC4E, NAMPTL, and SAMSN1) showed a significant negative correlation with the distribution of monocytes (). We performed PCA using the expression of CLEC4E and NAMPTL with the distribution of neutrophils and observed their good performance in separating STEMI from SCAD patients ().
Figure 3. ROC and correlation analysis of DEGs. (a) ROC analysis of DEGs in identifying patients with STEMI. The potential of DEGs in separating patients with STEMI from SCAD. (b) Correlation between DEGs and immune cell distribution. The diagram visualized the correlation matrix of DEGs, neutrophils, and monocytes distribution; the correlation was represented with color from −1 (red) to 1 (blue); blank boxes indicated the correlation was not significant (P > 0.01); (c) PCA with the expression of CLEC4E and NAMPTL and neutrophils distribution
Critical modules associated with STEMI
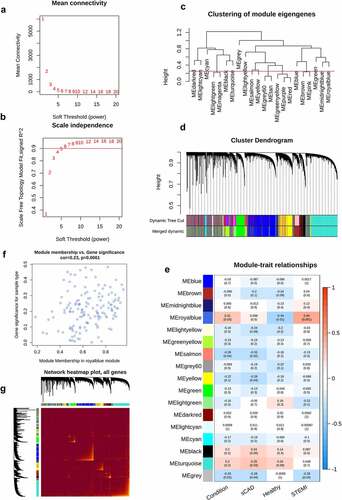
To analyze gene modules (clusters) associated with AMI, we conducted gene expression networks with WGCNA. From mean connectivity and scale independence plots, we selected β = 6 as the power value for network construction (). A total of 16 modules were observed from WGCNA, including ‘black’ with 1365 genes, ‘blue’ with 7282 genes, ‘brown’ with 5089 genes, ‘cyan’ with 336 genes, ‘darkred’ with 88 genes, ‘green’ with 2075 genes, ‘greenyellow’ with 3583 genes, ‘grey60ʹ with 802 genes, ‘ligthtcyan’ with 256 genes, ‘lightgreen’ with 1226 genes, ‘lightyellow’ with 141 genes, ‘midnightblue’ with 295 genes, ‘royalblue’ with 141 genes, ‘salmon’ with 555 genes, ‘turquoise’ with 7374 genes, and ‘yellow’ with 2857 genes (). Genes in module ‘royalblue’ indicated a high correlation with STEMI (cor = 0.44, p = 0.001) (). Module membership showed a significant correlation with gene significance (); the correlation of genes and modules was depicted ().
Figure 4. WGCNA analysis of STEMI. The mean connectivity and scale independence value as a function of soft threshold (power) were depicted (a, b); the red line indicated the cutoff of scale independence of 0.9. (c) Clustering dendrogram of modules; red line indicates the threshold of merging modules. (d) Modules before or after merging and clustering. (e) The heatmap depicted the correlation scores (digit in the box above) as well as its corresponding P-value (digit in the box below) of modules (rows) and clinical traits (columns). The correlation of module membership and gene significance, as well as the correlation among all genes, were visualized in (f) and (g)
Functional analysis of genes in STEMI-related modules
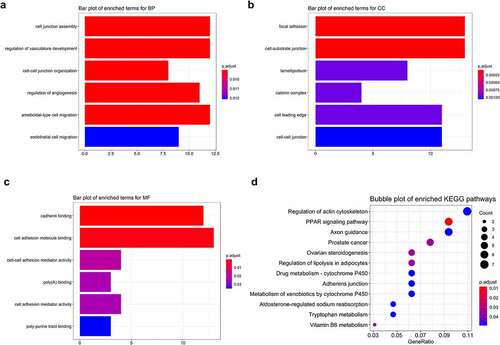
Functional enrichment of clinically significant modules, containing 141 genes, showed that 55 GO terms including 34 terms in biological process (BP), 13 in cellular component (CC), and 8 in molecular function (MF) were significantly enriched (, ). GO terms were enriched in cell–cell interactions such as junction and adhesion and cell migration, locomotion, and motility (GO:0030336, GO:0040013, and GO:2000146). Biological processes associated with blood vessels such as regulation of vasculature development (GO:1901342) and angiogenesis (GO:0045765) were significantly enriched (, ). Thirteen KEGG pathways were enriched with genes in STEMI-associated modules; KEGG enrichment analysis showed that genes focused on the regulation of actin cytoskeleton, a pathway that regulates cell motility and cell shape in cell cycles or response to extracellular stimuli (, ). One crucial pathway mediating the cardiac energy metabolism – peroxisome proliferator-activated receptor (PPAR) signaling pathway (); two cytochrome P450-related pathways (hsa00980 and hsa00982) were significantly enriched (, ).
Table 1. GO enrichment terms of genes associated with AMI
Table 2. Enriched KEGG pathways of genes associated with AMI
Figure 5. Functional enrichment of STEMI-related genes. Top 6 enriched GO terms in biological process (BP), cellular component (CC), and molecular function (MF) were depicted with bar plots (a, b, c); top 12 enriched KEGG pathways were visualized with bubble plots (d)
Critical genes in STEMI-associated modules
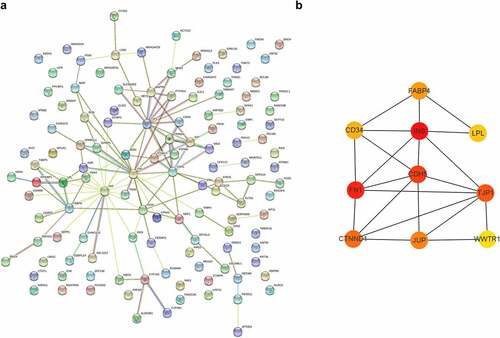
Protein–protein interactions analysis was a powerful strategy to explore critical and hub genes. Via analyzing protein–protein interactions among genes in module ‘royalblue’ and predicting crucial genes with Cytoscape software, we obtained 10 hub genes: INS, FN1, CDH5, TJP1, CTNND1, JUP, FABP4, CD34, LPL, and WWTR1 ().
Figure 6. Protein–protein interactions and hub genes of STEMI-related genes. (a) Protein–protein interactions of STEMI-associated genes; (b) represented the top 10 predicted hub genes with Cytoscape software
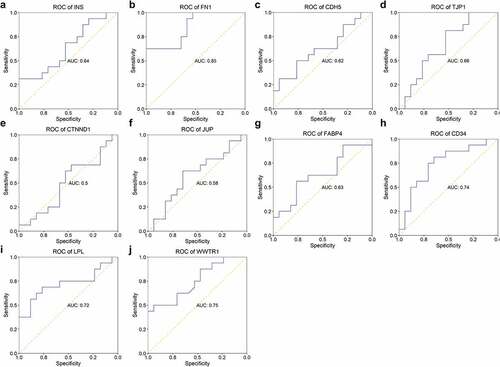
Eight genes (INS, FN1, CDH5, TJP1, FABP4, CD34, LPL, and WWTR1) showed potential in separating patients with STEMI from healthy controls with AUC higher than 0.7 (). Four genes (FN1, CD34, LPL, and WWTR1) represented capability in identifying patients with STEMI from patients with SCAD with AUC > 0.7 (). We observed expression of one gene – FN1 – showed great performance in identifying patients with STEMI from patients with SCAD (with AUC of 0.85 showed in ) and healthy controls with AUC of 0.9 ().
Figure 7. ROC of hub genes in distinguishing patients with STEMI from healthy controls. The ability of hub genes as reporters for patients with STEMI was visualized
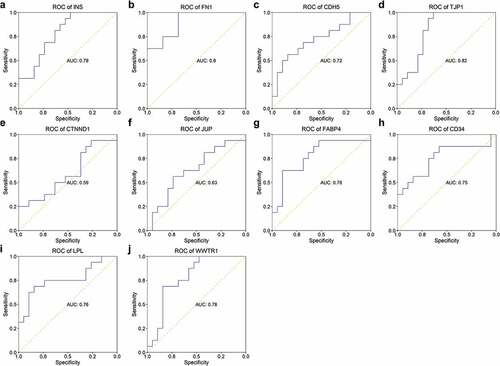
Figure 8. ROC of hub genes in separating patients with STEMI from SCAD. The AUC of 10 hub genes in identifying STEMI from SCAD was depicted
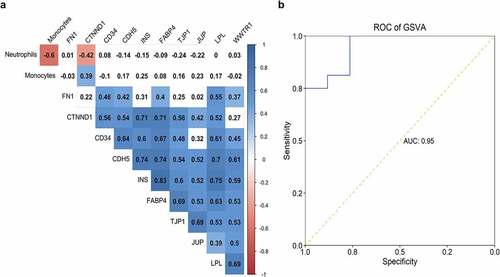
We performed a correlation analysis to explore the association of hub genes expression and distribution of neutrophils and monocytes; almost all of the hub genes represented no relation with fractions of these two types of immune cells, except for a slight correlation for CTNND1 (). Hub genes showed a significant positive correlation with each other, suggesting their potential in forming gene modules (). When constructing the GSVA indices of ARG1, NAMPTL, and FN1 expression and neutrophils distribution, we found they showed great performance in identifying patients with STEMI from SCAD with an AUC of 0.95 ().
Figure 9. Correlation of hub genes and distribution of two immune cells. The correlation table indicated the association of gene expression and fractions of monocytes and neutrophils; the correlation was color-coded from −1 (red) to 1 (blue); association without significance (P-value > 0.01) was blank. (b) The capability of GSVA index of ARG1, NAMPTL, and FN1 expression and neutrophils distribution in identifying patients with STEMI from SCAD was depicted
Discussion
Considering the different proportion of monocytes and neutrophils between STEMI and SCAD (), we further explored DEGs associated with immune cells in two disease groups. Six DEGs (ARG1, CLEC4E, SAMSN1, FKBP5, NAMPTL, and S100A12) were obtained, all of which indicated great performance in identifying patients with STEMI from SCAD with AUC > 0.9 (). However, we noticed differences in our research compared with the previous study, which observed five differentially expressed genes FKBP5, S100P, SAMSN1, CLEC4E, and S100A12 [Citation17–26]; we observed two additional novel DEGs ARG1 and NAMPTL; different expression of S100P among STEMI and SCAD was failed to be observed in our study. This variety was caused by various preprocessing of the expression data: in our analysis, before DEGs analysis, we performed clustering with gene expression to identify experimentally caused outliers and discarded five samples including three patients with STEMI and 2 with SCAD (). A recent publication reported the significantly increased expression of ARG1 in AMI patients than healthy controls, indicating the clinical significance of ARG1 in AMI [Citation27]. In our study, the ARG1 expression in platelets represented the power (with AUC of 0.9, ) in identifying patients with STEMI from SCAD, suggesting its potential as a biomarker for distinguishing cardiovascular disease. NAMPTL, a pseudogene, was detected to be stimulated in blood or immune cells; NAMPTL expression was also observed in heart tissues and showed great performance as a biomarker for separating STEMI and SCAD with an AUC of 0.92. Correlation analysis revealed its significant association with the distribution of neutrophil cells (), indicating its potential as an indicator for immune states of platelets.
Additionally, with WGCNA, we observe one STEMI-related module containing 141 genes () involved in biological processes of cell junction, cell migration, cell adhesion, and cell motility (). Crucial roles of cell–cell junction participating in the cardiac conduction system have been reported [Citation28]. Robert, et al. found that actin cytoskeleton mediates the secretion of alpha-granule and dense granule [Citation29]; It was believed that α-granule secretion is associated with platelet activation [Citation30]. Platelet activation, associated with coronary thrombus, plays a crucial role in the development and STEMI [Citation31,Citation32]. Similarly, we observed the significant enrichment of the actin cytoskeleton of STEMI-related genes (), indicating the various roles of platelet activation in STEMI and SCAD. The PPAR signaling pathway, a crossing regulator of lipid signaling and inflammation [Citation33], was enriched, suggesting its crucial role in platelets in response to STEMI (). A previous study found that the downregulation of peroxisome proliferator-activated receptor γ (PPARγ) contributes to the activation and aggregation, eventually forming micro-thromboses, which finally leads to myocardial dysfunction [Citation34]. Consistently, we found that genes (associated with platelet activation and involved in the PPAR pathway) showed different expression patterns in STEMI and healthy donors (). Together, these findings indicated the critical roles for platelet activation and the PPAR pathway in the causing of STEMI, enhancing the emergency of anti-inflammation therapy for patients with STEMI.
With PPI, we obtained 10 hub genes from the STEMI-related module; four genes (FN1, CD34, LPL, and WWTR1) showed capability as biomarkers for STEMI (); FN1, encoding fibronectin in plasma, especially, performed well in differentiating patients with STEMI both from healthy donors and patients with SCAD with AUC of 0.9 () and 0.85 (), respectively. The previous publication reported that the cardiac fibronectin expression was rapidly and considerably increased in the infarcted region of the ventricle, which indicates the critical role of FN1 in regulating ventricle infarction [Citation35]. However, we did not observe significantly different expression of FN1 in patients with STEMI compared to healthy donors or SCAD patients. More experiments need to be conducted to analyze the role of FN1 in platelets in STEMI.
Conclusion
In conclusion, with the expression of genes in platelets, we observed different roles of immune states in platelets in response to SCAD and STEMI and first reported the potential of distribution of neutrophils as a molecular signature for separating patients with STEMI from SCAD. We revealed two novel genes (ARG1 and NAMPTL) as biomarkers for identifying STEMI from SCAD; FN1 shows potential as a novel biomarker for STEMI with great performance in identifying STEMI patients from healthy controls and SCAD patients.
Availability of data and material
The datasets used and/or analyzed during the current study are available from the corresponding author on reasonable request.
Author contributions
Study design: Yun Xie
Data collection: Yi Wang
Data analysis: Linjun Zhao
Interpretation of data: Fang Wang
Draft manuscript: Yun Xie
Review manuscript: Jinyan Fang
Acknowledgements
None.
Disclosure statement
The authors declare there are no competing interests.
Additional information
Funding
References
- Wang C, Jing Q. Non-coding RNAs as biomarkers for acute myocardial infarction. Acta Pharmacol Sin. 2018;39(7):1110–1119.
- Yang EH, Brilakis ES, Reeder GS, Gersh BJ. Modern management of acute myocardial infarction. Curr Probl Cardiol. 2006;31(12):769–817.
- Reed GW, Rossi JE, Cannon CP. Acute myocardial infarction. Lancet. 2017;389(10065):197–210.
- Braunwald E. Unstable angina and non-ST elevation myocardial infarction. Am J Respir Crit Care Med. 2012;185(9):924–932.
- Healy AM, Pickard MD, Pradhan AD, Wang Y, Chen Z, Croce K, et al. Platelet expression profiling and clinical validation of myeloid-related protein-14 as a novel determinant of cardiovascular events. Circulation. 2006;113(19):2278–2284.
- McManus DD, Beaulieu LM, Mick E, Tanriverdi K, Larson MG, Keaney JF, Jr., et al Relationship among circulating inflammatory proteins, platelet gene expression, and cardiovascular risk. Arterioscler Thromb Vasc Biol. 2013;33(11):2666–2673.
- Davies MJ, Thomas A. Thrombosis and acute coronary-artery lesions in sudden cardiac ischemic death. N Engl J Med. 1984;310(18):1137–1140.
- Bonaventura A, Montecucco F, Dallegri F, Carbone F, Luscher TF, Camici GG, et al. Novel findings in neutrophil biology and their impact on cardiovascular disease. Cardiovasc Res. 2019;115(8):1266–1285.
- Westman PC, Lipinski MJ, Luger D, Waksman R, Bonow RO, Wu E, et al. Inflammation as a driver of adverse left ventricular remodeling after acute myocardial infarction. J Am Coll Cardiol. 2016;67(17):2050–2060.
- Sreejit G, Abdel-Latif A, Athmanathan B, Annabathula R, Dhyani A, Noothi SK, et al. Neutrophil-derived S100A8/A9 amplify granulopoiesis after myocardial infarction. Circulation. 2020;141(13):1080–1094.
- Ren Z, Yang K, Zhao M, Liu W, Zhang X, Chi J, et al. Calcium-sensing receptor on neutrophil promotes myocardial apoptosis and fibrosis after acute myocardial infarction via NLRP3 inflammasome activation. Can J Cardiol. 2020;36(6):893–905.
- Eghbalzadeh K, Georgi L, Louis T, Zhao H, Keser U, Weber C, et al.. Compromised anti-inflammatory action of neutrophil extracellular traps in PAD4-deficient mice contributes to aggravated acute inflammation after myocardial infarction. Front Immunol. 2019;10:2313.
- Horckmans M, Ring L, Duchene J, Santovito D, Schloss MJ, Drechsler M, et al. Neutrophils orchestrate post-myocardial infarction healing by polarizing macrophages towards a reparative phenotype. Eur Heart J. 2017;38(3):187–197.
- Ritchie ME, Phipson B, Wu D, Hu Y, Law CW, Shi W, et al. limma powers differential expression analyses for RNA-sequencing and microarray studies. Nucleic Acids Res. 2015;43(7):e47.
- Langfelder P, Horvath S. WGCNA: an R package for weighted correlation network analysis. BMC Bioinformatics. 2008;9(1):559.
- Yu G, Wang LG, Han Y, He QY. clusterProfiler: an R package for comparing biological themes among gene clusters. OMICS. 2012;16(5):284–287.
- Hanzelmann S, Castelo R, Guinney J. GSVA: gene set variation analysis for microarray and RNA-seq data. BMC Bioinformatics. 2013;14(1):7.
- Frossard M, Fuchs I, Leitner JM, Hsieh K, Vlcek M, Losert H, et al. Platelet function predicts myocardial damage in patients with acute myocardial infarction. Circulation. 2004;110(11):1392–1397.
- Stojkovic S, Nossent AY, Haller P, Jager B, Vargas KG, Wojta J, et al. MicroRNAs as regulators and biomarkers of platelet function and activity in coronary artery disease. Thromb Haemost. 2019;119(10):1563–1572.
- Capodanno D, Angiolillo DJ. Antithrombotic therapy for atherosclerotic cardiovascular disease risk mitigation in patients with coronary artery disease and diabetes mellitus. Circulation. 2020;142(22):2172–2188.
- Gadi I, Fatima S, Elwakiel A, Nazir S, Al-Dabet MM, Rana R, et al. Different DOACs control inflammation in cardiac ischemia-reperfusion differently. Circ Res. 2020;128(4):513–529.
- Luscher TF. The sooner, the better: anti-inflammation in acute myocardial infarction. Eur Heart J. 2020;41(42):4100–4102.
- Dai Y, Chen Y, Wei G, Zha L, Li X. Ivabradine protects rats against myocardial infarction through reinforcing autophagy via inhibiting PI3K/AKT/mTOR/p70S6K pathway. Bioengineered. 2021;12(1):1826–1837.
- von Hundelshausen P, Weber C. Platelets as immune cells: bridging inflammation and cardiovascular disease. Circ Res. 2007;100(1):27–40.
- Silvestre-Roig C, Braster Q, Ortega-Gomez A, Soehnlein O. Neutrophils as regulators of cardiovascular inflammation. Nat Rev Cardiol. 2020;17(6):327–340.
- Gobbi G, Carubbi C, Tagliazucchi GM, Masselli E, Mirandola P, Pigazzani F, et al. Sighting acute myocardial infarction through platelet gene expression. Sci Rep. 2019;9(1):19574.
- Zhang R, Ji Z, Qu Y, Yang M, Su Y, Zuo W, et al. Clinical value of ARG1 in acute myocardial infarction patients: Bioinformatics-based approach. Biomed Pharmacother. 2020;121:109590.
- Mezzano V, Sheikh F. Cell-cell junction remodeling in the heart: possible role in cardiac conduction system function and arrhythmias? Life Sci. 2012;90(9–10):313–321.
- Flaumenhaft R, Dilks JR, Rozenvayn N, Monahan-Earley RA, Feng D, Dvorak AM. The actin cytoskeleton differentially regulates platelet alpha-granule and dense-granule secretion. Blood. 2005;105(10):3879–3887.
- Brydon L, Magid K, Steptoe A. Platelets, coronary heart disease, and stress. Brain Behav Immun. 2006;20(2):113–119.
- Silvain J, Collet JP, Nagaswami C, Beygui F, Edmondson KE, Bellemain-Appaix A, et al. Composition of coronary thrombus in acute myocardial infarction. J Am Coll Cardiol. 2011;57(12):1359–1367.
- Calvieri C, Tanzilli G, Bartimoccia S, Cangemi R, Arrivi A, Dominici M, et al. Interplay between oxidative stress and platelet activation in coronary thrombus of STEMI patients. Antioxidants (Basel). 2018;7(7.
- Wahli W, Michalik L. PPARs at the crossroads of lipid signaling and inflammation. Trends Endocrinol Metab. 2012;23(7):351–363.
- Zhou H, Li D, Zhu P, Hu S, Hu N, Ma S, et al. Melatonin suppresses platelet activation and function against cardiac ischemia/reperfusion injury via PPARgamma/FUNDC1/mitophagy pathways. J Pineal Res. 2017;63.
- Knowlton AA, Connelly CM, Romo GM, Mamuya W, Apstein CS, Brecher P. Rapid expression of fibronectin in the rabbit heart after myocardial infarction with and without reperfusion. J Clin Invest. 1992;89(4):1060–1068.