
ABSTRACT
Systemic lupus erythematosus (SLE) is a chronic autoimmune disease involving multiple organs. However, the underlying etiology and mechanisms remain unclear. This study was performed to identify potential therapeutic targets for SLE using bioinformatics methods. First, 584 differentially expressed genes were identified based on the GSE61635 dataset. Tissue-specific analyses, enrichment analyses, and Protein–Protein interaction network were successively conducted. Furthermore, ELISA was performed to confirm the expression levels of key genes in the control and SLE blood samples. The findings revealed that tissue-specific expression of markers of the hematological system (25.5%, 28/110) varied significantly. CCL2, MMP9, and RSAD2 expression was markedly increased in the SLE samples compared with controls. In conclusion, the identified key genes (CCL2, MMP9, and RSAD2) may act as possible therapeutic targets for the treatment of SLE.
GRAPHICAL ABSTRACT
Highlights
● Tissue-specific expression of haematological system markers varies significantly.
● CCL2, MMP9, and RSAD2 have potential therapeutic value in the treatment of SLE.
● Seven signalling pathways are positively related to SLE.
Introduction
Systemic lupus erythematosus (SLE) is a polysystemic autoimmune disease involving multiple organs [Citation1]. Epidemiological studies have suggested that the 10-year survival rate of patients with SLE is 90%, and 25% of deaths are caused by thrombotic events or concurrent infections [Citation2–4]. Decades of research have revealed that genetic, immune, and environmental factors participate in the pathogenesis of SLE [Citation5–8]. However, the precise pathogenic mechanisms underlying SLE remain to be fully elucidated. Currently, there is no cure for SLE, and the treatment mostly relies on nonsteroidal anti-inflammatory drugs (NSAIDs) and immunosuppressants to relieve symptoms.
The Gene Expression Omnibus (GEO) database contains gene profiles generated predominantly using DNA microarray technology [Citation9,Citation10]. This study aimed to explore the potential hub genes and underlying mechanisms in SLE using bioinformatics methods. Raw data from microarray analyses conducted on SLE samples and healthy controls were downloaded from the GEO database. According to the enrichment analysis, BioGPS, String database, and protein–protein interaction (PPI) network analysis were utilized to identify key genes. By verifying the selected key genes, the validation results provide a basis upon which novel insights regarding mechanisms underlying SLE and new approaches for SLE therapeutic intervention can be developed.
Materials & methods
Data source
Microarray dataset GSE61635 was available at the Gene Expression Omnibus (GEO) database (www.ncbi.nlm.nih.gov/geo/). It was based on the GPL570 platform (HG-U133_Plus_2), comprising 99 SLE blood samples and 30 healthy control samples.
Data processing
Raw data were processed and analyzed using R (version 4.0.2). The median value of each sample was normalized using the limma package between arrays for background correction. A robust multichip average (RMA) was then created, and perfect matches from the raw data were log-transformed. FDR <0.05 and |log2 fold change (FC)| >1 were considered for the differentially expressed genes (DEGs) [Citation11]. DEGs were processed and plotted as volcano plots and a heatmap using ggplot2 and pheatmap R packages, respectively.
Tissue-specific gene expression analysis
Information regarding the function of a gene can be obtained from the relative tissue-specific genes. To screen out tissue-specific DEGs, the BioGPS database (http://biogps.org/#goto=welcome) was used [Citation12]. Highly tissue-specific transcripts mapped to a single tissue were included if all of the following criteria were met: (a) median expression > 30 times the median expression of all other tissues; (b) the highest expression level was at least threefold higher than the second-highest expression.
Functional annotation and KEGG pathway analysis
GO [Citation13] and KEGG [Citation14] pathway analysis of DEGs were screened out by using DAVID 6.8 (http://david.abcc.ncifcrf.gov/) online database [Citation15]. Significant difference was set at P< 0.05.
Identification of key genes
STRING (https://string-db.org/) was used to construct the PPI network [Citation16]. The confidence score was set at ≥0.4. Cytoscape v3.7.2 and the CytoHubba plugin (version 0.1) were used to visualize and identify the PPI network. The top 20 hub genes were obtained based on the filtering algorithm (closeness). A Venn diagram was then delineated to confirm the key genes between hub genes and tissue-specific genes.
ELISA
The experimental protocol was approved by the Ethics Committee of the Second Affiliated Hospital of Nanchang University in compliance with the Declaration of Helsinki. SLE and normal subjects were informed of the study content in oral form. Two milliliters of blood was collected and anticoagulated with EDTA. Serum samples were collected by centrifuging the blood samples at 2000 rpm for 10 min at 4°C. All ELISA kits (CCL2, MMP9, GATA1, and RSAD2) were used according to the manufacturer’s instructions (MEIMIAN, Jiangsu Biological Industrial Co., Ltd., China).
Statistical analysis
A minimum of three replicates were performed for each experiment, and data are presented as the mean ± SD. Statistical analyses were performed using GraphPad Prism 8 (GraphPad Software, San Diego, USA). Comparisons between groups were performed using an unpaired t-test. Statistical significance was set at p< 0.05.
Results
In order to explore potential therapeutic targets of SLE, bioinformatics methods were used to identify DEGs. We next performed tissue-specific gene expression analysis and enrichment analysis and constructed a PPI network. Finally, the selected hub genes were verified using ELISA. Therefore, this study may significantly improve the targeted therapy of SLE and enrich our understanding of its pathogenesis.
Differential expression analysis
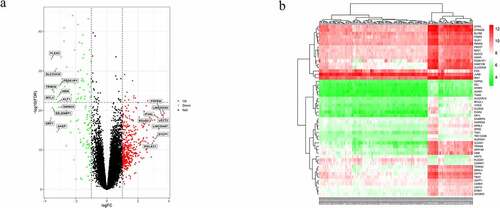
In total, 99 patients with SLE and 30 normal subjects were enrolled in this study. Microarray data of the GSE61635 dataset were standardized (). After setting the cutoff at FDR <0.05, and |log2 (FC)| >1, 584 DEGs were identified (). The 19 significantly expressed genes between the two groups were extracted using cutoffs at |log2 (FC)| >3 and FDR <0.005 ().
Figure 1. Normalization of microarray dataset. (a) Before normalization of the GSE61635 dataset. (b) After normalization of the GSE61635 dataset
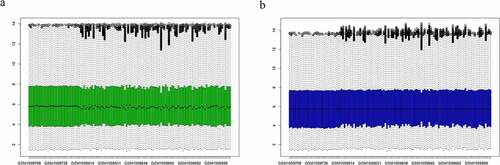
Figure 2. Differentially expressed genes (DEGs) between systemic lupus erythematosus (SLE) and control groups. (a) Volcano plot of GSE61635; 19 significantly expressed genes were identified. Red, green, and black dots represent upregulated, downregulated, and unchanged genes, respectively. (b) Heatmap of the top 50 DEGs from GSE61635
Specificity of DEGs in tissue expression
Using BioGPS, we screened 110 DEGs that were preferentially expressed in specific tissues. Tissue-specific expression of the markers of the hematological system (25.5%, 28/110) varied significantly, followed by the urinary/genital system (22.7%, 25/110), neurologic and digestive system (18.2%, 20/110), respiratory and skin/skeletal muscle system (10.9%, 12/110), immune system (9.1%, 10/110), endocrine system (7.3%, 8/110), and circulatory system (4.5%, 5/110) ().
Table 1. Tissue-specific genes identified by BioGPS
Enrichment analysis of DEGs
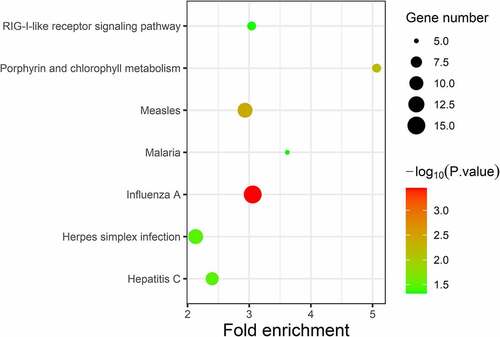
GO analysis was conducted using the DAVID software. Enriched GO terms were divided into three categories: BP, CC, and MF. As shown in and , the DEGs were mainly enriched in the ‘Type I interferon signalling pathway’ and ‘Defence response to virus’ in the BP group. CC analysis indicated that the DEGs were mainly enriched in ‘hemoglobin complex’ and ‘cortical cytoskeleton’. In terms of MF, DEGs were most enriched in ‘metalloendopeptidase activity’ and ‘2ʹ-5ʹ-oligoadenylate synthetase activity’. Pathway enrichment analysis of DEGs using the KEGG. KEGG analysis of DEGs revealed that they were mainly enriched in ‘influenza A’, ‘measles’, and ‘porphyrin and chlorophyll metabolism’ ( and ).
Table 2. GO analysis of significant DEGs in SLE
Table 3. KEGG pathway analysis of significant DEGs in SLE
Figure 3. Distribution of differentially expressed genes (DEGs) in systemic lupus erythematosus (SLE) for GO enrichment
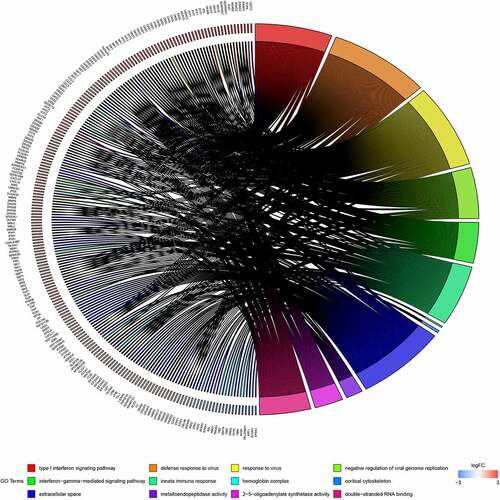
Figure 4. KEGG enrichment analysis of differentially expressed genes (DEGs). Strength of the color represents the p-value (from the lowest in green to the highest in red), and the bubble size represents the number of DEGs
PPI network construction and key genes identification
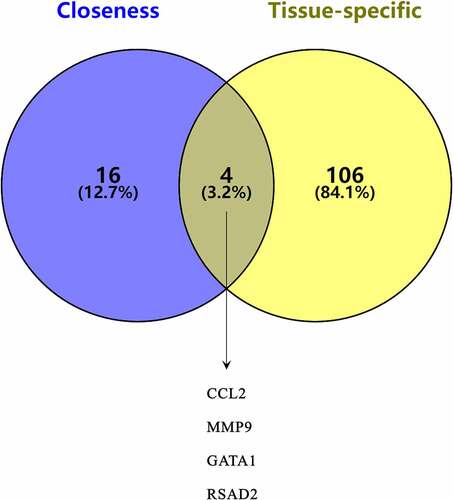
Using the STRING database and Cytoscape v3.7.2, a PPI network was constructed. Based on the closeness algorithm, the top 20 hub genes were identified using the Cytohubba plugin. Hub genes were extracted, and the top 20 connected proteins were shown together with the rank of each hub gene, including STAT1, CXCL10, CCL2, IRF7, FOS, IFIT3, ISG15, MX1, IFIH1, MMP9, GATA1, IFIT1, DDX58, GBP1, OAS1, OAS2, RSAD2, OASL, OAS3, and IFI44L (). Next, a Venn diagram was constructed to confirm the key genes between hub genes and tissue-specific genes ().
Figure 5. The PPI network of differentially expressed genes (DEGs). (a) Top 20 DEGs visualized based on the Closeness algorithm analysis in Cytoscape. (b) Top 20 DEGs based on Closeness score ranking
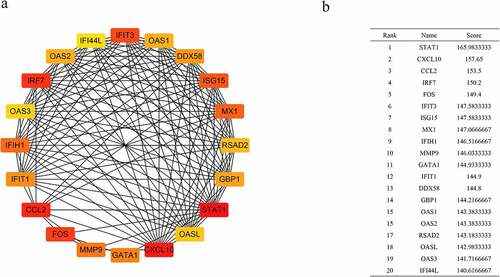
Figure 6. Key genes between hub genes and tissue-specific genes
Validation of gene expression
Expression of four key genes (CCL2, MMP9, GATA1, and RSAD2) was verified using ELISA in control and SLE subjects. The ELISA results showed that the levels of CCL2, MMP9, and RSAD2 in the SLE group were significantly increased ().
Figure 7. Concentration of CCL2, MMP9, GATA1, and RSAD2 in the serum. (a–d) Concentration of CCL2, MMP9, GATA1, and RSAD2 in the serum. Data are presented as mean ± SD (n ≥ 15). * p < 0.05, **p < 0.01, *** p< 0.005 vs Control; NS, no statistical significance vs Control
Discussion
Previously, a significant number of genes have been shown to correlate with SLE [Citation17,Citation18]. However, current therapies for SLE have limited efficacy and increased susceptibility to secondary outcomes [Citation19]. In this study, 584 DEGs were obtained from the selected dataset GSE61635. Enrichment analysis of DEGs showed that they were primarily involved in the hemoglobin complex, immune response, and metalloendopeptidase activity. Compared with previous researches, we conducted a tissue-specific analysis of differential gene expression, which could potentially allow for the development of more effective and targeted therapeutics [Citation20,Citation21]. The results suggested that 110 DEGs were involved in the hematological system, urinary/genital system, neurologic and digestive system, respiratory and skin/skeletal muscle system, immune system, endocrine system, and circulatory system. Furthermore, four key genes were revealed between hub genes and tissue-specific genes, including CCL2, MMP9, GATA1, and RSAD2. The statistical results validated by ELISA showed that the levels of CCL2, MMP9, and RSAD2 were significantly increased in the SLE group.
Chemokines are a family of small peptides that are involved in cell trafficking and inflammatory responses [Citation22–24]. Currently, approximately 50 different chemokines have been identified, most of which belong to the CC and CXC families [Citation25]. Monocyte chemoattractant protein-1 (MCP-1 or CCL2), a prototype of the CC subfamily, plays a crucial role in inflammatory processes [Citation26,Citation27]. CCL2/MCP-1 is significantly correlated with SLE, and CCL2 levels are significantly reduced after treatment [Citation28,Citation29]. Moreover, it has been demonstrated that CCL2/MCP-1 is strongly associated with atherosclerosis and cardiovascular diseases (CVD) in patients with SLE [Citation30,Citation31].
Matrix metalloproteinases (MMPs), also known as matrixins, are extracellular matrix (ECM)-degrading enzymes [Citation32]. MMP-9, an extracellular proteinase, is involved in various pathophysiological processes, such as ECM remodeling, inflammatory response, and immune response [Citation33]. Multiple cytokines play crucial roles in upregulating the expression of MMP-9 in response to inflammation [Citation34]. However, MMP-9 appears passively as a downstream product of the inflammatory response. Additionally, it plays a positive feedback role on many pro-inflammatory factors (IL-1β and IL-8), which are important ‘regulators’ of the inflammatory response [Citation35]. Prior studies have shown that MMP-9 plays a significant role in chronic autoimmune diseases, such as SLE, by activating the inflammatory response [Citation36,Citation37]. MMP-9 degrades components of the vascular basement membrane that help inflammatory cells invade the vascular wall and induce inflammation associated with the pathogenesis of SLE, thus increasing endothelial cell permeability [Citation38,Citation39].
RSAD2, an interferon-inducible gene, is involved in the innate immune response against viruses [Citation40,Citation41]. RSAD2 activates the immune response and has been associated with multiple autoimmune diseases, such as RA, SLE, and AS [Citation42,Citation43]. Doedens et al. [Citation44] found that patients with SLE have an important link with IFN dysregulation. A study performed by Sezin et al. [Citation42] showed that RSAD2 is the hub gene in the pathogenesis of SLE.
There are several limitations to this study. First, it was performed at a single center in China; therefore, the results warrant further validation in other populations. Second, only one dataset was utilized in this study, and future studies will be required to validate these findings in other datasets. Further large-scale validation studies and molecular mechanisms of SLE should be performed to explore the roles of these genes.
Conclusion
In conclusion, the present investigation demonstrates that CCL2, MMP9, and RSAD2 are linked to the initiation and development of SLE. These genes and the related pathways may serve as novel therapeutic targets for SLE. Large-scale, multi-center research is needed to further validate these findings.
Author statement
Yun Yu: Statistical Analysis, Manuscript Preparation. Liang Liu: Data Collection, Statistical Analysis. Long-long Hu, Jun-pei Li, Ling-ling Yu, Ling-juan Zhu and Qian Liang: Data Interpretation. Jing-an Rao and Rong-wei Zhang: Data Collection. Hui-hui Bao and Xiao-shu Cheng: Study Design and Manuscript revision.
Data availability
The GSE61635 dataset analysed in this study was downloaded from the NCBI GEO database.
Ethical approval
The study was conducted in accordance with the Declaration of Helsinki and was approved by the Medical Ethics Committee of the Second Affiliated Hospital of Nanchang University.
Disclosure statement
No potential conflict of interest was reported by the author(s).
References
- Lipsky PE. Systemic lupus erythematosus: an autoimmune disease of B cell hyperactivity. Nat Immunol. 2001;2:764–766.
- Cervera R, Khamashta MA, Font J, et al. Morbidity and mortality in systemic lupus erythematosus during a 10-year period: a comparison of early and late manifestations in a cohort of 1,000 patients. Medicine (Baltimore). 2003;82(5):299–308.
- Yazdany J, Marafino BJ, Dean ML, et al. Thirty-day hospital readmissions in systemic lupus erythematosus: predictors and hospital- and state-level variation. Arthritis Rheumatol. 2014;66:2828–2836.
- Quintero OL, Rojas-Villarraga A, Mantilla RD, et al. Autoimmune diseases in the intensive care unit. An update. Autoimmun Rev. 2013;12:380–395.
- Mackern-Oberti JP, Llanos C, Riedel CA, et al. Contribution of dendritic cells to the autoimmune pathology of systemic lupus erythematosus. Immunology. 2015;146:497–507.
- Cunningham M, Gilkeson G. Estrogen receptors in immunity and autoimmunity. Clin Rev Allergy Immunol. 2011;40(1):66–73.
- Dorgham K, Amoura Z, Parizot C, et al. Ultraviolet light converts propranolol, a nonselective beta-blocker and potential lupus-inducing drug, into a proinflammatory AhR ligand. Eur J Immunol. 2015;45(11):3174–3187.
- Qiu CC, Caricchio R, Gallucci S. Triggers of autoimmunity: the role of bacterial infections in the extracellular exposure of lupus nuclear autoantigens. Front Immunol. 2019;10:2608.
- Barrett T, Troup DB, Wilhite SE, et al. Ncbi geo: archive for functional genomics data sets—10 years on. Nucleic Acids Res. 2011;39:1005–1010.
- Wang J, Zhang C. Identification and validation of potential mRNA- microRNA- long-noncoding RNA (mRNA-miRNA-lncRNA) prognostic signature for cervical cancer. Bioengineered. 2021;12(1):898–913.
- Bolstad BM, Irizarry RA, Astrand M, et al. A comparison of normalization methods for high den sity oligonucleotide array data based on variance and bias. Bioinformatics. 2003;19:185–193.
- Saavedra PHV, Huang L, Ghazavi F, et al. Apoptosis of intestinal epithelial cells restricts Clostridium difficile infection in a model of pseudomembranous colitis. Nat Commun. 2018;9(1):4846.
- Ashburner M, Ball CA, Blake JA, et al. Gene ontology: tool for the unification of biology. The Gene Ontology Consortium. Nat Genet. 2000;25(1):25–29.
- Kanehisa M, Goto S. KEGG: kyoto encyclopedia of genes and genomes. Nucleic Acids Res. 2000;28(1):27–30.
- Huang DW, Sherman BT, Lempicki RA. Systematic and integrative analysis of large gene lists using DAVID bioinformatics resources. Nat Protoc. 2009;4(1):44–57.
- Szklarczyk D, Gable AL, Lyon D, et al. STRING v11: protein-protein association networks with increased coverage, supporting functional discovery in genome-wide experimental datasets. Nucleic Acids Res. 2019;47(D1):607–613.
- Zhang M, Gu Y, Huang S, et al. Copy number variations and polymorphisms in HSP90AB1 and risk of systemic lupus erythematosus and efficacy of glucocorticoids. J Cell Mol Med. 2019;23(8):5340–5348.
- Khare SD, Sarosi I, Xia XZ, et al. Severe B cell hyperplasia and autoimmune disease in TALL-1 transgenic mice. Proc Natl Acad Sci USA. 2000;97(7):3370–3375.
- Yin Y, Zhao L, Zhang F, et al. Impact of CD200-Fc on dendritic cells in lupus-prone NZB/WF1 mice. Sci Rep. 2016;6:31874.
- Han T, Zhou Y, Li D. Relationship between hepatocellular carcinoma and depression via online database analysis. Bioengineered. 2021;12(1):1689–1697.
- Meng Y, Li C, Liu CX. Immune cell infiltration landscape and immune marker molecular typing in preeclampsia. Bioengineered. 2021;12(1):540–554.
- Luster AD. Chemokines—chemotactic cytokines that mediate inflammation. N Engl J Med. 1998;12:436.
- Proudfoot AE, Wells TN, Clapham PR. Chemokine receptors—future therapeutic targets for HIV? Biochem Pharmacol. 1999;57(5):451–463.
- Nagasawa T, Hirota S, Tachibana K, et al. Defects of B-cell lymphopoiesis and bone-marrow myelopoiesis in mice lacking the CXC chemokine PBSF/SDF-1. Nature. 1996;382:635–638.
- Griffith JW, Sokol CL, Luster AD. Chemokines and chemokine receptors: positioning cells for host defense and immunity. Annu Rev Immunol. 2014;32:659–702.
- Chu XK, Wang Y, Ardeljan D, et al. Controversial view of a genetically altered mouse model of focal retinal degeneration. Bioengineered. 2013;4(3):130–135.
- Tsou CL, Peters W, Si Y, et al. Critical roles for CCR2 and MCP-3 in monocyte mobilization from bone marrow and recruitment to inflammatory sites. J Clin Invest. 2007;117(4):902–909.
- Dominguez-Gutierrez PR, Ceribelli A, Satoh M, et al. Reduced levels of CCL2 and CXCL10 in systemic lupus erythematosus patients under treatment with prednisone, mycophenolate mofetil, or hydroxychloroquine, except in a high STAT1 subset. Arthritis Res Ther. 2014;16(1):23.
- Lee HK, Kim HS, Kim JS, et al. CCL2 deficient mesenchymal stem cells fail to establish long-lasting contact with T cells and no longer ameliorate lupus symptoms. Sci Rep. 2017;7:41258.
- Ramji DP, Davies TS. Cytokines in atherosclerosis: key players in all stages of disease and promising therapeutic targets. Cytokine Growth Factor Rev. 2015;26(6):673–685.
- Tektonidou MG, Kravvariti E, Konstantonis G, et al. Subclinical atherosclerosis in systemic lupus erythematosus: comparable risk with diabetes mellitus and rheumatoid arthritis. Autoimmun Rev. 2017;16(3):308–312.
- Visse R, Nagase H. Matrix metalloproteinases and tissue inhibitors of metalloproteinases: structure, function, and biochemistry. Circ Res. 2003;92(8):827–839.
- Opdenakker G, Van Den Steen PE, Dubois B, et al. Gelatinase B functions as regulator and effector in leukocyte biology. J Leukoc Biol. 2001;69(6):851–859.
- Urowitz MB, Gladman DD, Tozman EC, et al. The lupus activity criteria count (LACC). J Rheumatol. 1984;11(6):783–787.
- Faber-Elmann A, Sthoeger Z, Tcherniack A, et al. Activity of matrix metalloproteinase-9 is elevated in sera of patients with systemic lupus erythematosus. Clin Exp Immunol. 2002;127(2):393–398.
- Ainiala H, Hietaharju A, Dastidar P, et al. Increased serum matrix metalloproteinase 9 levels in systemic lupus erythematosus patients with neuropsychiatric manifestations and brain magnetic resonance imaging abnormalities. Arthritis Rheum. 2004;50(3):858–865.
- Mawrin C, Brunn A, Röcken C, et al. Peripheral neuropathy in systemic lupus erythematosus: pathomorphological features and distribution pattern of matrix metalloproteinases. Acta Neuropathol. 2003;105(4):365–372.
- Opdenakker G, Van Den Steen PE, Van Damme J. Gelatinase B: a tuner and amplifier of immune functions. Trends Immunol. 2001;22(10):571–579.
- Fitzgerald KA. The interferon inducible gene: viperin. J Interferon Cytokine Res. 2011;31(1):131–135.
- Jang JS, Lee JH, Jung NC, et al. Rsad2 is necessary for mouse dendritic cell maturation via the IRF7-mediated signaling pathway. Cell Death Dis. 2018;9(8):823.
- Lübbers J, Brink M, Van De Stadt LA, et al. The type I IFN signature as a biomarker of preclinical rheumatoid arthritis. Ann Rheum Dis. 2013;72(5):776–780.
- Sezin T, Vorobyev A, Sadik CD, et al. Gene expression analysis reveals novel shared gene signatures and candidate molecular mechanisms between pemphigus and systemic lupus erythematosus in CD4+ T cells. Front Immunol. 2017;8:1992.
- Fan H, Zhao G, Ren D, et al. Gender differences of B cell signature related to estrogen-induced IFI44L/BAFF in systemic lupus erythematosus. Immunol Lett. 2017;181:71–78.
- Doedens JR, Jones WD, Hill K, et al. Blood-borne RNA correlates with disease activity and IFN-stimulated gene expression in systemic lupus erythematosus. J Immunol. 2016;197(7):2854–2863.