
ABSTRACT
Recent findings have identified microbiota as crucial participants in many disease conditions, including cancers. Competing endogenous RNA (ceRNA) is regarded as a candidate mechanism involving relevant biological processes. We therefore constructed a ceRNA network using the TCGA and GEO database, to determine the potential mechanisms of microbiota-mediated colorectal carcinogenesis and progression. We found a total of 75 lncRNAs, 8 miRNAs, and 9 mRNAs in the probiotics-mediated ceRNA network and a total of 49 lncRNAs, 4 miRNAs, and 3 mRNA in the pathobiont-mediated ceRNA network, which could induce the microbiota-mediated carcinogenesis and progression. The GO and KEGG analysis indicated that the ceRNA network is mainly enriched in the metabolic process, and two unique pathways (the p53 signaling pathway and microRNA in cancer), respectively. A four-gene signature (FRMD6-AS2, DIRC3, LIFR-AS1, and MRPL23-AS1) was suggested as an independent prognostic factor. Four lncRNAs (LINC00355, KCNQ1OT1, LINC00491, and HOTAIR) were associated with poor survival. Three small molecule candidate anticancer drugs (Pentoxyverine, Rimexolone, and Doxylamine) were identified. A four-gene signature (FAM129A, BCL2, PMAIP1, and RPS6) is significantly correlated with immune infiltration level. This study provides a promising biomarker reservoir to explore the mechanism by which microbiota regulate the ceRNA network involving the immune response, and further participate in colorectal carcinogenesis and progression.
Graphical Abstractt
1. Introduction
Colorectal cancer (CRC) is one of the most frequently diagnosed cancers worldwide, and it is also a leading cause of cancer mortality [Citation1]. The burden of CRC is predicted to substantially increase due to the adoption of the western lifestyle in the next two decades [Citation2]. Dietary habits are one of the crucial factors in colorectal carcinogenesis, which involves various processes [Citation3], such as eliciting inflammation and producing immune responses. Dietary behaviors can tremendously influence the composition of the intestinal microbiota, leading to dysbiosis and affecting the susceptibility to intestinal diseases [Citation4].
Dysbiosis is characterized by the overgrowth of pathogenic bacteria and the absence of beneficial bacteria, etc. The beneficial bacteria in the gut microbiota include Saccharomyces boulardi and Lactobacillus rhamnosus GG (LGG) [Citation5]. The therapeutic feeding of probiotics was able to serve as adjuvants for the checkpoint immunotherapy to improve cancer care [Citation6,Citation7]. However, an increase in pathobionts is regarded as more pronounced than the decrease in probiotics during the development of adenocarcinoma [Citation8]. Recently, Pleguezuelos et al. first reported the pathobionts with the colibactin-producing pks pathogenicity island have a direct role in the occurrence of oncogenic mutations [Citation9,Citation10]. Common pathobionts in the gut microbiome include Fusobacterium nucleatum (Fn), Escherichia coli, and Bacteroides fragilis, etc [Citation11]. Undoubtedly, both pathobionts and probiotics contribute to colorectal carcinogenesis, although they play opposite roles in this process.
Noncoding RNA is the predominant RNA in the human transcriptome. Although these noncoding RNAs do not translate into protein, it was reported in recent years that they accomplish a great variety of biological functions [Citation12,Citation13]. As one type of noncoding RNA, lncRNA is associated with colorectal carcinogenesis, tumor progression, and intestinal microbiota [Citation14,Citation15]. Recent studies have reported that not only the primary structures (i.e. nucleotide sequence) but also the secondary structures of lncRNAs are related to biological processes. The secondary structures of lncRNAs could act as a guide or scaffold via binding chromatin-modifying protein complexes [Citation16,Citation17]. By interacting with key histone-modification enzymes, lncRNAs could also directly participate in cancer epigenetic regulation [Citation18,Citation19]. In addition, the mechanism of competing endogenous RNA (ceRNA) is proposed as one of the most important regulatory pathways to explain how lncRNAs influence protein expression. The lncRNAs, known as miRNA ‘sponges’ or ‘decoys’, are able to compete for binding to the same miRNAs via attracting the miRNA recognition/response elements (MREs), subsequently relieving the inhibitory activity of miRNAs on mRNA targets [Citation16,Citation17]. Such a mechanism of lncRNA modulating the action of miRNA was first found in 2010 [Citation20].
Therefore, we hypothesized that microbiota could regulate the expression level of lncRNA, and further mediate the function of mRNA by competitively binding to the corresponding miRNA, which is also the so-called ceRNA regulatory network [Citation21,Citation22]. For instance, Fang et al. elucidated similar molecular mechanisms of microbial products in the development of CRC [Citation23]. However, no study has yet proposed a constructive reservoir for exploring the ceRNA regulatory system in microbiota-mediated CRC pathogenesis. In this study, we established ceRNA networks of microbiota-mediated CRC and comprehensively analyzed the biological activities regarding the networks, including enrichment analysis, survival analysis, Cox regression analysis, protein-protein interaction, etc. This is the first study to investigate the ceRNA network of the microbiota-mediated CRC. It could provide promising genetic candidates for future studies on the mechanism of CRC pathogenesis.
2. Materials and methods
2.1 Data collection and processing
All RNA data were downloaded from the TCGA database (GDC Data Portal http://portal.gdc.cancer.gov) and the GEO database (https://www.ncbi.nlm.nih.gov/). Those RNA probe sets were re-annotated using the Ensembl database (http://www.ensembl.org). The mRNA and lncRNA expression profiles were only obtained from TCGA. The miRNA expression profiles were detected from both the TCGA database and the GEO database. The GEO database was searched on 20 June 2020 with the keywords ‘microbe’, ‘bacteria’, ‘microbiota’, ‘colon’, ‘rectum’, ‘colorectal’, ‘cancer’, ‘carcinoma’, ‘neoplasm’, ‘miRNA’, and species such as ‘Homo sapiens’. Sixty-eight records corresponding to 24 series were obtained from the GEO database. After screening, 2 datasets (GSE79383 and GSE122182) were included [Citation24,Citation25], which analyzed the miRNA profiles of human colorectal tissue or cells lines in different microbiota environments. The characteristics of CRC patients in the TCGA database are shown in Table S1.
2.2 Differentially expressed RNA analysis
The differentially expressed lncRNAs, miRNAs, and mRNAs from the TCGA database were identified using the edgeR package of R software. Expression differences were defined using fold-change (FC) and the false discovery rate (FDR). |logFC| >2 and FDR <0.05 were considered statistically significant for lncRNAs, miRNAs, and mRNAs. RNA expression data were normalized by edgeR.
The differentially expressed miRNAs (DEMs) from the GEO database were identified by GEO2R (http://www.ncbi.nlm.nih.gov/geo/geo2r/). |FC| >2 and p-values <0.05 were considered statistically significant. Finally, DEMs of the ceRNA network were obtained by the overlap of DEM from both the GEO database and the TCGA database.
2.3 CeRNA network construction
The ceRNA network was established based on the lncRNA-miRNA-mRNA axes. DEMs of the ceRNA network were transformed into human mature miRNA names from starBase v. 2.0 (http://sysu.edu.cn). LncRNA-miRNA interaction pairs were predicted based on the DEMs using the miRcode database (http://www.mircode.org). The miRcode is an online tool to computationally aid hypothesis generation starting from an lncRNA or miRNA of interest. MiRNA-mRNA interaction pairs were identified based on the DEMs using the miRDB, miTarBase, and TargetScan databases [Citation26–28]. The miRTarBase database provides experimentally validated miRNA-target interactions while the other two databases provide the computationally predicted miRNA-target interactions. The target mRNAs were included only when they were reported in all three databases. Based on lncRNA-miRNA pairs and miRNA-mRNA pairs, the ceRNA networks of CRC in different microbiota were reconstructed through Cytoscape (v. 3.7.2) [Citation29].
2.4 Functional and pathway enrichment analysis
DAVID is an online functional annotation tool (https://david.ncifcrf.gov/) [Citation30], and it was used to analyze Gene Ontology (GO) function and the Kyoto Encyclopedia of Genes and Genomes (KEGG) pathway analysis on differentially expressed RNAs in the ceRNA network. P-values <0.05 were considered statistically significant.
2.5 Identification of prognostic signatures
The clinical information in CRC was retrieved from the TCGA database, the genes expression data were then combined with the clinical data. The univariate and multivariate Cox proportional hazard regression analyses were performed to identify CRC prognosis-mediated RNAs. The hazard ratio of the clinical features (age, gender, stage, AJCC-Tumor classification, AJCC-lymph node classification, and AJCC-Metastasis classification) and the expression of DEGs were calculated with the survival package in R. P-values <0.05 were considered statistically significant.
2.6 Survival analysis
The clinical information and gene expression data for survival analysis were retrieved from the TCGA database. According to the median expression value of each RNA in the ceRNA network, the CRC samples were classified into 2 groups: high-expression groups and low-expression groups. The Kaplan-Meier survival curves were generated by the survival R package. P-values <0.05 were considered statistically significant.
2.7 Construction of protein-protein interaction (PPI) network using the STRING database and validation of hub genes
The PPI networks of microbiota-mediated signature were constructed by searching the differentially expressed RNAs of ceRNA networks in the retrieval of interacting genes/proteins (STRING) database [Citation31]. Each node in the PPI network represents a protein or gene, and the edges between nodes represent their physical or functional interactions. The threshold of interaction scores was defined as median confidence ≥0.4. By calculating the degree of connectivity, the genes with degree ≥1 were considered hub genes. The expression of hub genes was then validated by using gene expression profiling interactive analysis (GEPIA) [Citation32].
2.8 Identification of candidate small molecule drugs
The identified hub genes were used query the Connectivity Map (CMap) database to screen the potential drugs against microbiota-mediated CRC [Citation33]. The connectivity scores refer to the efficacy of small molecule drugs. A positive score means that the drug is capable of inducing CRC, while a negative score means that the drug is able to reverse the disease progression, which indicates a potentially therapeutic drug. The interactive chemical structure models of top three candidate molecular drugs were investigated in PubChem database.
2.9 Immune cells infiltration analysis
The abundance of tumor-infiltrating immune cells (TIICs) of the identified hub genes was estimated using the TIMER database [Citation34]. The distributions of immune cells, including CD8 + T cells, CD4 + T cells, B cells, neutrophils, macrophages, and dendritic cells (DCs) were exhibited to explore the relationship between gene expression and immune infiltration. The panel also displayed gene expression levels against tumor purity. The gene expression level was displayed with log2 TPM.
3. Results
In this study, we identified a set of microbiota-mediated biomarkers and constructed ceRNA networks in CRC, which provide novel perspectives for studying the potential mechanisms. In total, 75 DELs, 8 DEMs, and 9 DEGs in the probiotic-related ceRNA network were screened out, while 49 DELs, 4 DEMs, and 3 DEGs in the pathobiont-related ceRNA network were recognized. Furthermore, the candidate biomarkers were comprehensively analyzed by several functional analyses to explore the biological characteristics and therapeutic targets of the ceRNA networks.
3.1 Data set acquisition and identification of differentially expressed RNAs in CRC and the different microbiota
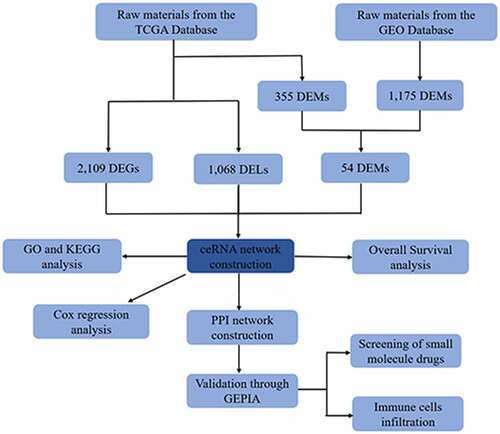
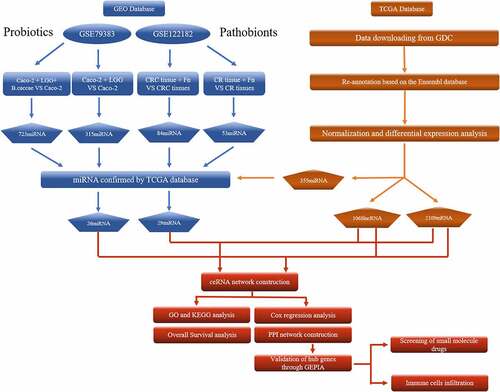
A flowchart is presented in . From the TCGA database, 40 normal adjacent noncancerous tissues and 382 colorectal adenocarcinoma samples with both clinical data and RNA expression data were collected. When comparing normal tissue to adenocarcinoma tissue, there were 269 down-regulated lncRNAs, 799 up-regulated lncRNAs, 138 down-regulated miRNAs, 217 up-regulated miRNAs, 984 down-regulated mRNAs, and 1125 up-regulated mRNAs. Figure S1A, S1B, S1C, S2A, S2B, and S2C show the heat maps and volcano plots of DELs, DEMs, and DEGs in the TCGA database. From the GEO database, 2 datasets (GSE79383 and GSE122182) of miRNA expression related to microbiota were collected, including 1 dataset (GSE79383) for probiotics and 1 dataset (GSE122182) for pathobionts. By comparing the DEMs in the TCGA and GEO databases, there were 4 down-regulated miRNAs and 22 up-regulated miRNAs in the GSE79383 datasets and 15 down-regulated miRNAs and 14 up-regulated miRNAs in the GSE122182 datasets. Figures S1D, S1E, S2D, and S2E show the heat maps and volcano plots of DEMs in the GEO database. Also, the Venn diagrams of DEMs in Figure S3A and S3B show the commonly DEMs in different microbiota environments.
Figure 1. The flow chart of bioinformatics analysis. Caco-2, human epithelial colorectal adenocarcinoma cells; LGG, Lactobacillus rhamnosus GG; B.caccae, Bacteroides caccae; CRC, Colorectal cancer; CR, Colorectum; Fn, Fusobacterium nucleatum; GDC, Genomic Data Commons Data Portal
3.2 CeRNA network construction and analysis
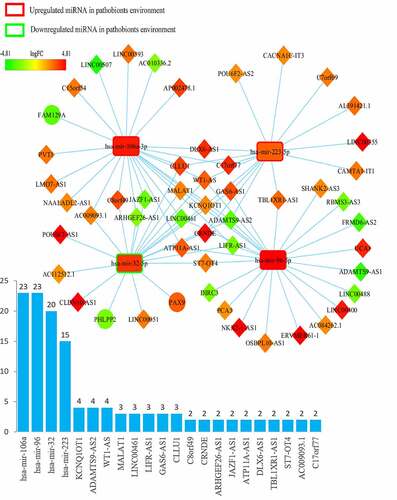
The ceRNA networks of CRC in a probiotic environment and a pathogenic environment are presented in , respectively. In the probiotic environment, 75 DELs, 8 DEMs, and 9 DEGs were identified by comparing the lncRNA-miRNA interaction pairs and the miRNA-mRNA interaction pairs. The expression values of DEMs in the probiotic environment from both the TCGA database and the GEO database are shown in , including hsa-mir-429, hsa-mir-141, hsa-mir-140, hsa-mir-22, hsa-mir-132, hsa-mir-454, hsa-mir-153, and hsa-mir-143. Among them, the regulating directions of four miRNAs (hsa-mir-429, hsa-mir-140, hsa-mir-132, and hsa-mir-153) in the GEO database are opposite to those of miRNAs in the TCGA database, which follow the hypothesis that probiotics can reverse gene expression in tumor cells, and subsequently turn over the effects of CRC carcinogenesis and tumor progression. In the pathogenic environment, 49 DELs, 4 DEMs, and 3 DEGs were identified using the same methods. displays the expression values of DEMs in the pathogenic environment, including hsa-mir-223, hsa-mir-32, hsa-mir-96, and hsa-mir-106a. The regulating directions of three miRNAs (hsa-mir-223, hsa-mir-96, and hsa-mir-106a) in the GEO database are identical to those of miRNAs in the TCGA database, which follow the principles that pathobionts can promote the expression of oncogenes or inhibit the expression of tumor suppressors, further promoting the effect of CRC carcinogenesis and tumor progression.
Table 1. The expression of 8 DEmiRNAs in probiotic environment from TCGA and GEO database
Table 2. The expression of 4 DEmiRNAs in pathogenic environment from TCGA and GEO database
Figure 2. Overview of lncRNA-miRNA-mRNA competing endogenous RNA (ceRNA) network in probiotics-mediated CRC. Red represents upregulation, and green represents downregulation. LncRNAs, miRNAs, and mRNAs in the networks are represented as diamonds, round rectangles, and circles, respectively. Bar plots show the key RNAs that have the top interaction number in the whole network
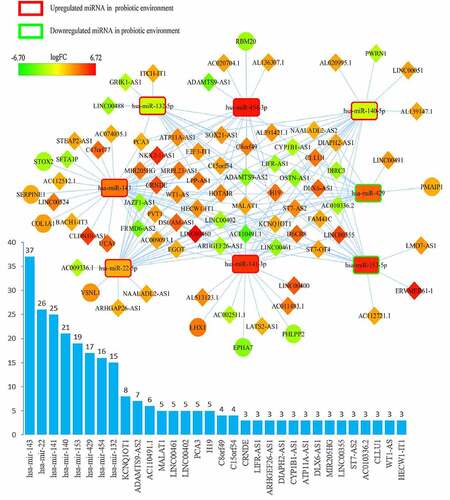
Figure 3. Overview of lncRNA-miRNA-mRNA competing endogenous RNA (ceRNA) network in pathobionts-mediated colorectal cancer. Red represents upregulation, and green represents downregulation. LncRNAs, miRNAs, and mRNAs in the networks are represented as diamonds, round rectangles, and circles, respectively. Bar plots show the key RNAs that have the top interaction number in the whole network
3.3 Functional annotation of the ceRNA network
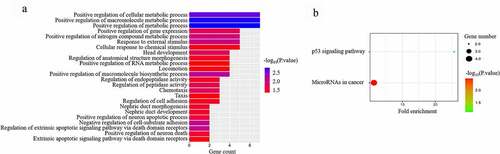
DAVID was used to analyze the differentially expressed RNAs in the ceRNA network. and Table S2 show that CRC in the different microbiota environment is mainly enriched in the positive regulation of cellular metabolic processes, positive regulation of macromolecule metabolic processes, and positive regulation of metabolic processes. These findings suggest that microbiota mostly regulate metabolic processes to participate in CRC carcinogenesis and progression. and Table S3 show that the main pathways for microbiota-mediated CRC are the p53 signaling pathway and microRNAs in cancer. These data suggest that microbiota mostly involve the p53 signaling pathway and microRNAs in cancer to participate in CRC carcinogenesis and progression.
Figure 4. GO functional analysis (a) and KEGG pathway (b) analysis of differentially expressed RNAs in microbiota-mediated colorectal cancer
3.4 Identification of prognostic signatures
The Cox proportional hazard regression model was used to screen the prognostic signatures (). The univariate analysis revealed that ten candidate genes were identified as prognostic factors, including FRMD6-AS2, LINC00461, DIRC3, LIFR-AS1, NAALADL2-AS2, LINC00402, ADAMTS9-AS2, MRPL23-AS1, LHX1, and RBM20. Four candidate genes were still considered as independent prognostic factors after the multivariate analysis, including FRMD6-AS2, DIRC3, LIFR-AS1 and MRPL23-AS1.
Table 3. Univariate and multivariate analysis
3.5 Survival analysis
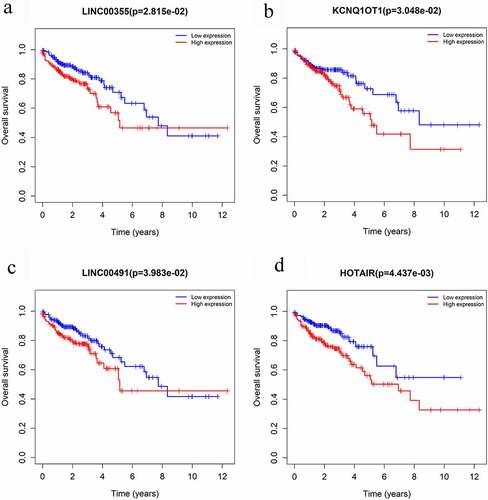
The Kaplan-Meier survival curves and log-rank tests were used to find survival-associated RNAs in the ceRNA network. In total, four lncRNAs were found to be associated with the overall survival (OS) of CRC patients, which are shown in . None of the miRNAs and mRNAs were identified as survival-associated genes. Four lncRNAs were obtained from CRC in the probiotic environment, including LINC00355, KCNQ1OT1, LINC00491, and HOTAIR, as shown in . Two lncRNAs were obtained from CRC in the pathogenic environment, including LINC00355 and KCNQ1OT1, as shown in . CRC patients with the high-expression of these lncRNAs are report poor prognosis.
Figure 5. Overall survival analysis of RNAs in the ceRNA network of microbiota-mediated colorectal cancer. (a), (b) Kaplan-Meier survival curves of prognostic DELs both in probiotics-mediated ceRNA network and pathobionts-mediated ceRNA network. (c), (d) Kaplan-Meier survival curves of prognostic DELs only in proniotics-mediated ceRNA network
3.6 PPI network construction, validation of hub genes, and screening of small molecule drugs
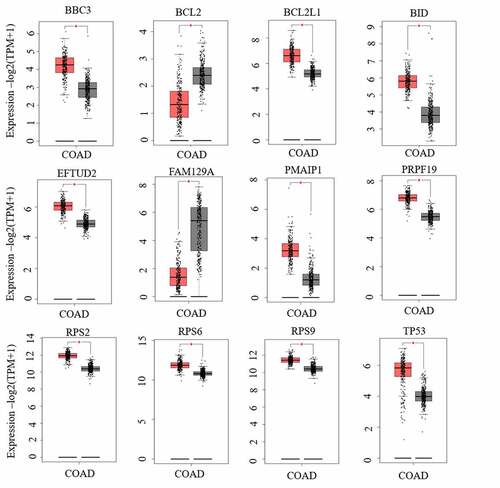
To identify the co-expression relationship of differentially expressed RNAs, a PPI network of microbiota-mediated CRC was constructed by the STRING database that included 40 nodes and 203 edges (). There are thirty-four nodes with a degree of connectivity ≥1; therefore, these thirty-four genes were considered as hub genes. The hub genes were then validated through the GEPIA database. Finally, a signature of 12 hub genes was identified, including BBC3, BCL2, BCL2L1, BID, EFTUD2, FAM129A, PMAIP1, PRPF19, RPS2, RPS6, RPS9, and TP53 ().
Figure 6. Protein-protein interaction network of differentially expressed RNAs in microbiota-mediated colorectal cancer, the nodes represent proteins, and the edges demonstrate the predicted functional associations between them, line thickness indicates the strength of data support
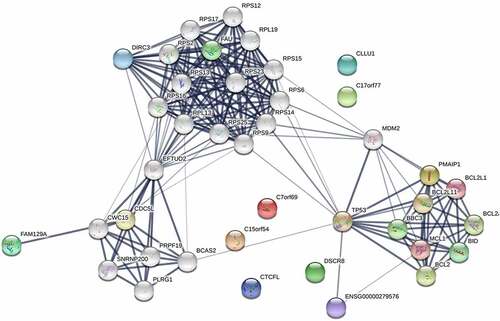
Figure 7. The expressions of 12 hub genes were determined using GEPIA. The expressions of genes are expressed as relative gene expression using transformed log2 (TPM+1) Value (Y-axis) of tumor (red bar) and normal (black bar) samples and displayed as a whisker plot. * p-value <0.05. GEIPIA, gene expression profiling interactive analysis
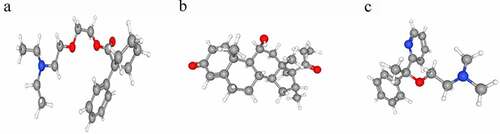
The validated hub genes were substituted into the CMap network. Among the ten most significantly correlated small molecule drugs, four were negatively scored, which indicated potential therapeutic effects for microbiota-mediated CRC (). Pentoxyverine, Rimexolone, and Doxylamine are the three most negatively-correlated molecules in microbiota-mediated CRC, while Netilmicin showed high enrichment correlated with microbiota-mediated CRC. Three-dimensional structure models of the top three candidate small molecule drugs found in the PubChem database are shown in .
Table 4. Results of connectivity map analysis
Figure 8. Three-dimensional diagram of the three most significant candidate drugs. (a) Pentoxyverine (b) Rimexolone (c) Doxylamine
3.7 Hub signature associated with immune infiltration level
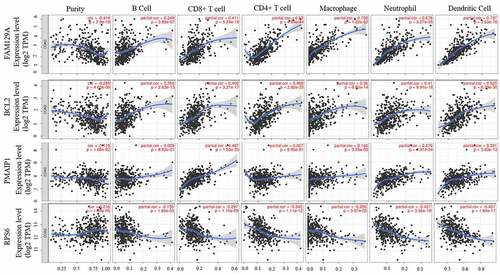
The relationship between hub-validated signatures and immune infiltration levels in CRC were investigated through the TIMER database. The four most significant positive signatures are displayed in . The most immune infiltration-relevant gene is FAM129A. The expression level of this gene shows significant positive correlations with infiltrating levels of B cells (r = 0.249, p = 3.89e-07), CD8 + T cells (r = 0.411, p = 5.24e-18), CD4 + T cells (r = 0.62, p = 4.69e-44), macrophages (r = 0.708, p = 1.22e-62), neutrophils (r = 0.678, p = 3.27e-55), and dendritic cells (r = 0.737, p = 3.63e-70), while it also has significant negative correlations with tumor purity. Similarly, other hub genes, e.g., BCL2, PMAIP1, and RPS6, have significant correlations with infiltrating levels of immune cells, which indicates that the microbiota plays an important role in immune infiltration in CRC.
Figure 9. Integrative analysis between hub identified signature with humor-infiltrating immune cells
4. Discussion
The microbiota is regarded as a ‘neglected organ’, reflecting a biological ecosystem that is closely interconnected with the host [Citation11,Citation35]. A precise balance in the microbiota plays an important role for health status and the prevention of some chronic diseases [Citation36]. When the balance is disrupted (dysbiosis), it can cause acute or chronic clinical disorders – for instance, antibiotic-associated diarrhea, ulcers [Citation37], inflammatory bowel disease [Citation38], irritable bowel syndrome [Citation39], and even some malignancies [Citation40]. The absence of probiotics and the overgrowth of pathobionts are the two main characteristics of dysbiosis. Previous studies have shown that probiotics are capable of binding to mutagenic amines, degrading nitrosamines, and reducing the production of carcinogens [Citation41]. In contrast, pathobionts have been implicated in DNA damage and tumor progression [Citation11]. Numerous studies have been conducted on microbiota-mediated carcinogenesis; however, the mechanism responsible for the microbiota-induced pathogenesis of CRC remains undefined. Therefore, identifying unique biomarkers and exploring the microbiota-mediated mechanisms are essential for conquering dysbiosis-induced CRC.
In this study, we first constructed the ceRNA networks of microbiota-mediated CRC based on the TCGA and GEO database. The ceRNA networks provide a comprehensive overview for exploring the regulatory mechanism of ceRNA in microbiota-mediated colorectal cancer. We identified 1038 differentially expressed miRNAs in the probiotic environment and 137 differentially expressed miRNAs in the pathogenic environment, which were extracted and analyzed from the GEO database. Meanwhile, we found 1068 lncRNAs, 355 miRNAs, and 2109 mRNAs with differentially expressed profiles from the TCGA database. After assessing the overlap of miRNAs, eight miRNAs and three miRNAs were screened out in the probiotic-mediated CRC network, and pathogenic CRC network, respectively. Therefore, 75 lncRNAs, 8 miRNAs, and 9 mRNAs were obtained in the probiotic-meditated ceRNA network, while 49 lncRNAs, 4 miRNAs, and 3 mRNAs were identified in the pathogenic-mediated ceRNA network.
Our study demonstrated that the probiotics can inhibit the expression of the oncogenes hsa-mir-153 and hsa-mir-429, and promote the expression of the tumor suppressors hsa-mir-140 and hsa-mir-132, while the pathobionts could promote the expression of the oncogenes hsa-mir-223, hsa-mir-96, and hsa-mir-106a. The results indicated that these miRNAs are crucial for microbiota-mediated colorectal carcinogenesis and progression. Of note, only one probiotic-mediated mRNA, PMAIP1, was identified as negatively regulating CRC, while one unique pathobiont-mediated mRNA, FAM129A, was identified as positively regulating CRC.
Subsequently, the enriched biological functions of mRNA in the microbiota-mediated ceRNA were evaluated by the GO and KEGG pathway analyses. The GO analysis revealed that the biological functions of the microbiota-mediated ceRNA network are mainly associated with the positive regulation of cellular metabolic process, positive regulation of macromolecule metabolic process, and positive regulation of metabolic process. Thus, microbiota may modulate the expression of ceRNAs, and further participate in the metabolic process to induce tumorigenesis. The pathway analysis showed that two unique pathways (p53 signaling pathway and MicroRNAs in cancer) were enriched in the ceRNA networks. Several studies have reported similar results to our observations. For example, according to the study of Kado et al., both intestinal microflora and p53 contribute to the development of adenocarcinoma of the colon [Citation42]. Also, it has been shown that the carcinogenesis of hepatocellular carcinoma (HCC) is also related to gut microbiota; the mechanism could be microRNAs in the cancer pathway [Citation43]. These enrichment results support the hypothesis that the microbiota plays essential roles via these pathways in colorectal carcinoma.
Through the overall survival analysis, four lncRNAs from the microbiota-mediated ceRNA network (LINC00355, KCNQ1OT1, LINC00491, and HOTAIR) were found to be associated with poor overall survival. Based on the previous studies, LINC00355 not only takes part in the regulation of the ceRNA network, but also contributes to the pathological staging in CRC [Citation44]. It was reported that LINC00355 is also associated with survival in other solid tumors, such as prostate cancer [Citation45] and bladder cancer [Citation46]. LINC00491 can positively regulate SERPINE1 expression through binding miR-145 and promoting the proliferation, migration, and invasion of colon adenocarcinoma cells [Citation47]. Many studies regarding KCNQ1OT1 and HOTAIR have been reported. It was stated that KCNQ1OT1 can enhance the chemoresistance of oxaliplatin/methotrexate and epithelial-mesenchymal transition (EMT) in colon cancer [Citation48–50]. Other tumor-promoting effects were also demonstrated in lung cancer [Citation51], tongue cancer [Citation52], and hepatocellular carcinoma [Citation53]. HOTAIR was reported as a negative prognostic factor, not only in primary tumors, but also in the blood of CRC patients [Citation54]. HOTAIR is also associated with EMT and stemness maintenance of cancer cell lines [Citation55]. Although many studies have been devoted to the prognostic effects of the above lncRNAs, there are no reports suggesting that these lncRNAs may act as microbiota-mediated survival biomarkers in CRC. Through univariate and multivariate Cox proportional model analysis, a four-gene signature (FRMD6-AS2, DIRC3, LIFR-AS1, and MRPL23-AS1) from the ceRNA networks was identified as independent prognostic factors. These genes have been verified in several carcinomas too, e.g. FRMD6-AS2 was found to increase the phosphorylation of LATS1 and YAP to promote the tumor growth, migration and invasion of endometrial cancer [Citation56,Citation57].
The DELs, DEMs, and DEGs in the microbiota-mediated ceRNA network were selected to construct a PPI network. Thirty-four hub genes were identified after the retrieval of the STRING databases. Twelve hub genes were validated through the GEPIA database. Among these twelve top hub genes, EFTUD2 ranked the highest. EFTUD2 is a component of the U5 snRNP in the spliceosome, and it was recently proven to promote colitis-associated tumorigenesis by mediating alternative splicing of components of the TLR4-NF-κB cascade [Citation58]. In addition, several small molecules drugs with therapeutic effects against microbiota-mediated CRC were screened. The top three are pentoxyverine, rimexolone, and doxylamine. Pentoxyverine is regarded as an antitussive that is commonly used for coughs. However, it is also a selective agonist of the sigma-1 receptor, which exhibits anti-proliferative activity in melanoma cells [Citation59]. Rimexolone is a highly lipophilic glucocorticoid receptor agonist, which suppresses the inflammatory response to various inciting agents of a mechanical, chemical and immunological nature. It is commonly used in eye inflammation and postoperative inflammation after cataract surgery [Citation60]. Doxylamine is a histamine H1 antagonist that has demonstrable sedative properties. It is used in allergies, and as a hypnotic, antiemetic and antitussive. The above three drugs have potential as new drugs for microbiota-related CRC.
Another important aspect of this study is that the hub identified the signature of microbiota-mediated CRC to be associated with different immune infiltration levels. Our results demonstrate that FAM129A is the most significant gene in the signature that induces immune infiltration. The expression level of FAM129A is positively correlated with the infiltration level of all selected immune cells, especially in macrophages and DCs. Other microbiota-mediated genes, e.g. BCL2, PMAIP1, and RPS6, also showed moderate to strong relationships between gene expression levels and immune infiltration levels in specific immune cells. These results could be indicative of a potential mechanism where microbiota regulates immune system functions in CRC. Also, the genes FAM129A, BCL2, PMAIP1, and RPS6 could plays significant roles in the recruitment and regulation of immune-infiltrating cells.
There were two limitations to the current study. Firstly, only a small number of datasets with microbiota data were included in the GEO database, which means that more experiments regarding ceRNA regulatory networks in microbiota-mediated carcinogenesis and progression are warranted. Secondly, our biomarker reservoir was identified based on the online databases through bioinformatics methods, which have not been validated in experiments. Further studies, including cell experiments, are therefore needed.
5. Conclusions
In conclusion, this study constructed ceRNA networks involving both probiotic- and pathobiont-mediated colorectal carcinogenesis and progression by analyzing the relevant data obtained from the TCGA and GEO databases. It provides a comprehensive analysis of the ceRNA regulatory mechanism in CRC. Furthermore, novel DELs, DEMs, and DEGs could be candidate diagnostic and prognostic biomarkers, or serve as potential therapeutic targets.
Research highlights
Microbiota mediates carcinogenesis of CRC via ceRNA networks;
The ceRNA networks participates in metabolic process, p53 and microRNA pathway;
A survival gene signature and a prognostic gene signature were identified;
Potential small molecules anti-cancer drug was screened out;
An immune-related gene signature was spotted
Acknowledgments
The results shown here are partly based upon data generated by the TCGA Research Network: https://www.cancer.gov/tcga. X. Tan acknowledges the program of China Scholarships Council (201806370236).
Supplemental Material
Download ()Disclosure statement
No potential conflict of interest was reported by the author(s).
Data availability statement:
The datasets generated during the current study are available in the Gene Expression Omnibus repository: https://www.ncbi.nlm.nih.gov/geo/query/acc.cgi?acc=GSE79383 and https://www.ncbi.nlm.nih.gov/geo/query/acc.cgi?acc=GSE122182, and the NCI’s Genomic Data Commons Data Portal: http://portal.gdc.cancer.gov.
Supplementary material
Supplemental data for this article can be accessed here.
Additional information
Funding
Related Research Data
References
- Bray F, Ferlay J, Soerjomataram I, et al. Global cancer statistics 2018: GLOBOCAN estimates of incidence and mortality worldwide for 36 cancers in 185 countries. CA Cancer J Clin. 2018;68(6):394–424.
- Arnold M, Sierra MS, Laversanne M, et al. Global patterns and trends in colorectal cancer incidence and mortality. Gut. 2017;66(4):683–691.
- Song M, Garrett WS, Chan AT. Nutrients, Foods, and Colorectal Cancer Prevention. Gastroenterology. 2015;148:1244–U217.
- Shanahan F, van Sinderen D, O’Toole PW, et al. Feeding the microbiota: transducer of nutrient signals for the host. Gut. 2017;66(9):1709–1717.
- Sanders ME, Guarner F, Guerrant R, et al. An update on the use and investigation of probiotics in health and disease. Gut. 2013;62(5):787–796.
- Vetizou M, Pitt JM, Daillere R, et al. Anticancer immunotherapy by CTLA-4 blockade relies on the gut microbiota. Science. 2015;350(6264):1079–1084.
- Pitt JM, Vetizou M, Waldschmitt N, et al. Fine-Tuning cancer immunotherapy: optimizing the gut microbiome. Cancer Res. 2016;76(16):4602–4607.
- Feng Q, Liang S, Jia H, et al. Gut microbiome development along the colorectal adenoma-carcinoma sequence. Nat Commun. 2015;6(1):6528.
- Pleguezuelos-Manzano C, Puschhof J, Rosendahl Huber A, et al. Mutational signature in colorectal cancer caused by genotoxic pks(+) E. coli. Nature. 2020;580(7802):269–273.
- Bhatt AP, Redinbo MR, Bultman SJ. The role of the microbiome in cancer development and therapy. CA Cancer J Clin. 2017;67(4):326–344.
- Tilg H, Adolph TE, Gerner RR, et al. The Intestinal Microbiota in Colorectal Cancer. Cancer Cell. 2018;33(6):954–964.
- Cech TR, Steitz JA. The noncoding RNA revolution-trashing old rules to forge new ones. Cell. 2014;157(1):77–94.
- Liu Y, Zhu J, Ma X, et al. ceRNA network construction and comparison of gastric cancer with or without Helicobacter pylori infection. J Cell Physiol. 2019;234(5):7128–7140.
- Liang L, Ai L, Qian J, et al. Long noncoding RNA expression profiles in gut tissues constitute molecular signatures that reflect the types of microbes. Sci Rep. 2015;5(1):11763.
- Okugawa Y, Grady WM, Goel A. Epigenetic alterations in colorectal cancer: emerging biomarkers. Gastroenterology. 2015;149:1204–25 e12.
- Conte F, Fiscon G, Chiara M, et al. Role of the long non-coding RNA PVT1 in the dysregulation of the ceRNA-ceRNA network in human breast cancer. PLoS One. 2017;12(2):e0171661.
- Salmena L, Poliseno L, Tay Y, et al. A ceRNA hypothesis: the Rosetta Stone of a hidden RNA language? Cell. 2011;146(3):353–358.
- Zhang XZ, Liu H, Chen SR. Mechanisms of long Non-Coding RNAs in cancers and their dynamic regulations. Cancers (Basel). 2020;12(5):12.
- Aguilo F, Zhou MM, Walsh MJ. Long noncoding RNA, polycomb, and the ghosts haunting INK4b-ARF-INK4a Expression: figure 1. Cancer Res. 2011;71(16):5365–5369.
- Poliseno L, Salmena L, Zhang J, et al. A coding-independent function of gene and pseudogene mRNAs regulates tumour biology. Nature. 2010;465(7301):1033–1038.
- Zou D, Wang Y, Wang M, et al. Bioinformatics analysis reveals the competing endogenous RNA (ceRNA) coexpression network in the tumor microenvironment and prognostic biomarkers in soft tissue sarcomas. Bioengineered. 2021;12(1):496–506. Epub 2021/ 02/16.
- Bao Y, Tang J, Qian Y, et al. Long noncoding RNA BFAL1 mediates enterotoxigenic Bacteroides fragilis-related carcinogenesis in colorectal cancer via the RHEB/mTOR pathway. Cell Death Dis. 2019;10(9):675. Epub 2019/ 09/14.
- Fang Y, Yan C, Zhao Q, et al. The roles of microbial products in the development of colorectal cancer: a review. Bioengineered. 2021;12(1):720–735. Epub 2021/ 02/24.
- Shah P, Fritz JV, Glaab E, et al. A microfluidics-based in vitro model of the gastrointestinal human-microbe interface. Nat Commun. 2016;7(1):11535. Epub 2016/ 05/12.
- Feng YY, Zeng DZ, Tong YN, et al. Alteration of microRNA-4474/4717 expression and CREB-binding protein in human colorectal cancer tissues infected with Fusobacterium nucleatum. PLoS One. 2019;14(4):e0215088. Epub 2019/ 04/06.
- Hsu SD, Lin FM, Wu WY, et al. miRTarBase: a database curates experimentally validated microRNA-target interactions. Nucleic Acids Res. Epub 2010/ 11/13 2011;39: D163–9.
- Lewis BP, Burge CB, Bartel DP. Conserved seed pairing, often flanked by adenosines, indicates that thousands of human genes are microRNA targets. Cell. 2005;120(1):15–20. Epub 2005/ 01/18.
- Chen Y, Wang X. miRDB: an online database for prediction of functional microRNA targets. Nucleic Acids Res. 2020;48:D127–D31. [ Epub 2019/ 09/11].
- Wang J, Zhang C. Identification and validation of potential mRNA- microRNA- long-noncoding RNA (mRNA-miRNA-lncRNA) prognostic signature for cervical cancer. Bioengineered. 2021;12(1):898–913. Epub 2021/ 03/09.
- Huang Da W, Sherman BT, Lempicki RA. Systematic and integrative analysis of large gene lists using DAVID bioinformatics resources. Nat Protoc. 2009;4(1):44–57. Epub 2009/ 01/10.
- Szklarczyk D, Franceschini A, Kuhn M, et al. The STRING database in 2011: functional interaction networks of proteins, globally integrated and scored. Nucleic Acids Res. Epub 2010/ 11/04 2011;39: D561–8.
- Tang Z, Li C, Kang B, et al. GEPIA: a web server for cancer and normal gene expression profiling and interactive analyses. Nucleic Acids Res. Epub 2017/ 04/14 2017;45: W98–W102.
- Lamb J, Crawford ED, Peck D, et al. The connectivity map: using gene-expression signatures to connect small molecules, genes, and disease. Science. 2006;313(5795):1929–1935. Epub 2006/ 09/30.
- Li T, Fu J, Zeng Z, et al. TIMER2.0 for analysis of tumor-infiltrating immune cells. Nucleic Acids Res. Epub 2020/ 05/23 2020;48: W509–W14.
- Charbonneau MR, Blanton LV, DiGiulio DB, et al. A microbial perspective of human developmental biology. Nature. 2016;535(7610):48–55.
- Ceapa C, Wopereis H, Rezaiki L, et al. Influence of fermented milk products, prebiotics and probiotics on microbiota composition and health. Best Pract Res Clin Gastroenterol. 2013;27(1):139–155.
- Friedman G. The role of probiotics in the prevention and treatment of Antibiotic-Associated Diarrhea and Clostridium Difficile Colitis. Gastroenterol Clin North Am. 2012;41(4):763-+.
- Geier MS, Butler RN, Howarth GS. Inflammatory bowel disease: current insights into pathogenesis and new therapeutic options; probiotics, prebiotics and synbiotics. Int J Food Microbiol. 2007;115(1):1–11.
- Barouei J, Adams MC, Hodgson DM. Prophylactic role of maternal administration of probiotics in the prevention of irritable bowel syndrome. Med Hypotheses. 2009;73(5):764–767.
- Serban DE. Gastrointestinal cancers: influence of gut microbiota, probiotics and prebiotics. Cancer Lett. 2014;345(2):258–270.
- Seidel DV, Azcarate-Peril MA, Chapkin RS, et al. Shaping functional gut microbiota using dietary bioactives to reduce colon cancer risk. Semin Cancer Biol. 2017;46:191–204.
- Kado S, Uchida K, Funabashi H, et al. Intestinal microflora are necessary for development of spontaneous adenocarcinoma of the large intestine in T-cell receptor beta chain and p53 double-knockout mice. Cancer Res. 2001;61(6):2395–2398.
- Feng Q, Chen WD, Wang YD. Gut microbiota: an integral moderator in health and disease. Front Microbiol. 2018;9:151.
- Yuan W, Li X, Liu L, et al. Comprehensive analysis of lncRNA-associated ceRNA network in colorectal cancer. Biochem Biophys Res Commun. 2019;508(2):374–379.
- Jiang T, Guo J, Hu Z, et al. Identification of potential prostate Cancer-Related Pseudogenes based on competitive endogenous RNA network hypothesis. Med Sci Monit. 2018;24:4213–4239.
- Seitz AK, Christensen LL, Christensen E, et al. Profiling of long non-coding RNAs identifies LINC00958 and LINC01296 as candidate oncogenes in bladder cancer. Sci Rep. 2017;7(1):395.
- Wan J, Deng D, Wang X, et al. LINC00491 as a new molecular marker can promote the proliferation, migration and invasion of colon adenocarcinoma cells. Onco Targets Ther. 2019;12:6471–6480.
- Bian Y, Gao G, Zhang Q, et al. KCNQ1OT1/miR-217/ZEB1 feedback loop facilitates cell migration and epithelial-mesenchymal transition in colorectal cancer. Cancer Biol Ther. 2019;20(6):886–896.
- Li Y, Li C, Li D, et al. lncRNA KCNQ1OT1 enhances the chemoresistance of oxaliplatin in colon cancer by targeting the miR-34a/ATG4B pathway. Onco Targets Ther. 2019;12:2649–2660.
- Xian D, Zhao Y. LncRNA KCNQ1OT1 enhanced the methotrexate resistance of colorectal cancer cells by regulating miR-760/PPP1R1B via the cAMP signalling pathway. J Cell Mol Med. 2019;23(6):3808–3823.
- Dong Z, Yang P, Qiu X, et al. KCNQ1OT1 facilitates progression of non-small-cell lung carcinoma via modulating miRNA-27b-3p/HSP90AA1 axis. J Cell Physiol. 2019;234(7):11304–11314.
- Zhang S, Ma H, Zhang D, et al. LncRNA KCNQ1OT1 regulates proliferation and cisplatin resistance in tongue cancer via miR-211-5p mediated Ezrin/Fak/Src signaling. Cell Death Dis. 2018;9(7):742.
- Hu H, Yang L, Li L, et al. Long non-coding RNA KCNQ1OT1 modulates oxaliplatin resistance in hepatocellular carcinoma through miR-7-5p/ ABCC1 axis. Biochem Biophys Res Commun. 2018;503(4):2400–2406.
- Svoboda M, Slyskova J, Schneiderova M, et al. HOTAIR long non-coding RNA is a negative prognostic factor not only in primary tumors, but also in the blood of colorectal cancer patients. Carcinogenesis. 2014;35(7):1510–1515.
- Padua Alves C, Fonseca AS, Muys BR, et al. Brief report: the lincRNA Hotair is required for epithelial-to-mesenchymal transition and stemness maintenance of cancer cell lines. Stem Cells. 2013;31(12):2827–2832.
- Wang J, Li Z, Wang X, et al. The tumor suppressive effect of long non-coding RNA FRMD6-AS2 in uteri corpus endometrial carcinoma. Life Sci. Epub 2020/ 01/10 2020;243: 117254.
- Tu C, Yang K, Wan L, et al. The crosstalk between lncRNAs and the Hippo signalling pathway in cancer progression. Cell Prolif. 2020;53(9):e12887. Epub 2020/ 08/12.
- Lv Z, Wang Z, Luo L, et al. Spliceosome protein Eftud2 promotes colitis-associated tumorigenesis by modulating inflammatory response of macrophage. Mucosal Immunol. 2019;12(5):1164–1173.
- Nordenberg J, Perlmutter I, Lavie G, et al. Anti-proliferative activity of haloperidol in B16 mouse and human SK-MEL-28 melanoma cell lines. Int J Oncol. 2005;27(4):1097–1103.
- Kavuncu S, Horoz H, Ardagil A, et al. Rimexolone 1% versus prednisolone acetate in preventing early postoperative inflammation after cataract surgery. Int Ophthalmol. 2008;28(4):281–285.