
ABSTRACT
Gastric cancer (GC) is one of the most common causes of cancer-related deaths worldwide and the identification of additional therapeutic targets and biomarkers has become vital. The A1-chimaerin (CHN1) gene encodes a ras-related protein that can be activated or inactivated by binding to GTP or GDP. The present study aimed to assess the expression of CHN1 in GC tissue and cells, to explore its relationship with GC progression, and to discover the potential mechanisms underlying these associations. The ONCOMINE database and The Cancer Genome Atlas (TCGA) were used to determine the transcriptional levels of CHN1 in GC. Western blot and immunohistochemistry were used for detecting protein expression. Correlations between CHN1 levels and the clinical outcomes of GC patients were examined using Kaplan–Meier and Cox regression analyses. Moreover, the CIBERSORT algorithm was used to estimate immune cell infiltration. In GC patients, CHN1 transcription and CHN1 protein expression were upregulated, and a high expression of CHN1 was remarkably linked to poor survival in GC patients. CHN1 expression was associated with immune infiltrates and this gene showed potential involvement in multiple cancer-related pathways. Furthermore, the expression of CHN1 was correlated with the immunotherapeutic response. Finally, our results indicated that the pro-carcinogenic role of CHN1 may involve DNA methylation. To our knowledge, this is the first report characterizing CHN1 expression in GC. Our results show that high CHN1 levels could be used as a clinical biomarker for poor prognosis and that CHN1 inhibitors may have potential as anti-cancer drugs.
Introduction
Gastric cancer (GC) is the third leading cause for cancer mortality worldwide [Citation1–4]. A few cases of GC can be cured surgically, but most patients present with more advanced, inoperable GC. To date, the effective interventions for advanced recurrent and refractory GC have been limited to systemic chemotherapy, radiotherapy, targeted therapy, and immunotherapy, and a sustained response is only observed in few cases. The 5-year overall survival in cases of advanced GC remains between 20% and 30% owing to a lack of known sensitive and specific biomarkers [Citation5]. Thus, there is a need for improving GC stratification and identifying new prognostic factors.
CHN1, also known as N-chimaerin, ARHGAP2, and RHOGAP2, is located in the q31-32.1 region of human chromosome 2. This gene encodes a GTP enzyme-activating protein (Rho GTPase-activating protein, Rho Gap) – a ras-related protein that can be activated or inactivated by binding to GTP or GDP [Citation6]. Rho GTPase and its related signaling complexes interact with other proteins and play a role in the tumor microenvironment, tumor invasion, and metastasis [Citation7,Citation8]. Currently, most research on CHN1 has been conducted in the field of neurobiology [Citation9], as this gene is expressed in the hippocampus and cerebral cortex of the human brain, where it plays an important role in neural signal transduction, brain development, and synaptic genesis [Citation10]. However, there are few reports regarding the role of CHN1 in tumorigenesis, especially in GC.
CHN1 expression was found to significantly differ between GC tissue and normal gastric tissue in our previous systematic analysis of genes differentially expressed in GC. Moreover, the upregulation of CHN1 expression was found to be associated with poor prognosis in GC patients. Hence, we hypothesized that this gene might be related to GC progression and could be a potential predictive biomarker for GC prognosis. In the present study, we aimed to explore the value of CHN1 in assessing GC prognosis along with the potential biological functions of the gene, in order to guide subsequent experimental validation and targeted drug development for GC.
Materials and methods
Expression analysis
The transcriptional expression of CHN1 in tumor tissue and normal tissue was first evaluated using the ONCOMINE and TIMER databases [Citation11,Citation12]. The GSE118916 [Citation13], GSE13861 [Citation14], and GSE292972 [Citation15] datasets from the GEO database were used to plot receiver operating characteristic (ROC) curves to further assess the value of CHN1 expression in discriminating tumors from normal tissue [Citation16].
We collected 15 cases sets of surgically removed GC tissue and paired paracancerous tissue samples from Jiangsu Provincial Hospital of Traditional Chinese Medicine, and we also collected detailed clinical information for all patients. The study protocol was approved by the Ethics Committee of the Affiliated Hospital of Nanjing University of Chinese Medicine, and clinicians and patients provided informed consent for using the tissue for research purposes.
Immunohistochemistry (IHC) was performed using 5-μm sections of paraffin-embedded tissue. The slides were dewaxed and incubated in 6% hydrogen peroxide in methanol to inactivate the endogenous peroxidase, and then, antigen recovery was performed using 0.1% pepsin [Citation17]. After blocking the sections with protein blocking solution, the slides were incubated with an anti-CHN1 polyclonal antibody (Proteintech, China) and immunohistochemical staining was performed according to manufacturer instructions. All slides used for comparison were also processed simultaneously and incubated for development for the same duration. Each section was stained with 3,3′-diaminobenzidene and counterstained with hematoxylin. The differential expression of CHN1 between cancerous and paracancerous tissue was evaluated at 200× magnification (Nikon ECLIPSE Ni-U, Japan). IHC results (intensity and extent of staining) were scored independently by two observers. The staining intensity was graded as follows: 0, negative staining; 1, weak staining; 2, moderate staining; and 3, strong staining. Based on the proportion of positively stained cells per specimen, the extent of staining was graded as follows: 0, no positively stained cells; 1 < 10% positively stained cells; 2, 10–50% positively stained cells; and 3, >50% positively stained cells. The histochemistry score (H-SCORE), which reflects both the ratio of positive cells and the intensity of expression, was calculated as follows:
H-SCORE = ∑ (PI × I) = (percentage of cells with weak intensity of staining × 1) + (percentage of cells with moderate intensity of staining × 2) + (percentage of cells with strong intensity of staining × 3) [Citation18]. In the formula, PI represents the percentage of positive cells in a particular field and I represent the intensity of staining. The range of H-SCOREs can be from 0 to 300, with a higher score representing stronger positive expression.
Western blotting was performed as previously described [Citation19]. Radio immunoprecipitation assay (RIPA) buffer (Beyotime Biotechnology, China) was used to isolate proteins, and then quantification was performed via the Bradford method. Samples containing the same amount of protein (20 µg) were separated using 10% sodium dodecyl sulfate-polyacrylamide gel electrophoresis (SDS-PAGE). Subsequently, the proteins were transfer-embedded onto polyvinylidene fluoride (PVDF) membranes. Thereafter, the membranes were blocked with 5% bovine serum albumin and then incubated with a primary anti-CHN1 polyclonal antibody (1:1,000; Proteintech, China). Both the primary antibody and secondary antibody (1: 5,000) were purchased from Zhongshan Golden Bridge Biotechnology (Beijing, China) and added for the binding reaction. After washing, the samples were incubated at 4°C for 1.5 h. Exposure was detected using a gel image processing system (ChemiDoc XRS+,USA) to analyze the target/β-actin bands, and the relative amounts of proteins were calculated. All experiments were performed at least thrice.
For both IHC and western blotting, data are reported as means ± standard deviation. Data were analyzed using SPSS 26.0 (SPSS Inc, USA) and presented using GraphPad Prism 8.0 (GraphPad Software, Inc., USA). * P < 0.05, **P < 0.01, ***P < 0.001, and **** P < 0.0001 were considered statistically significant.
Survival analysis
Kaplan–Meier (KM) curves were plotted based on information from the KMPLOT and GEPIA databases, and we further evaluated the clinical significance of CHN1 expression levels using TCGA-STAD data [Citation20].
To establish a Cox model for CHN1 and analyze the clinical value of its expression, raw counts of RNA-sequencing data and corresponding clinical information on CHN1 were obtained from The Cancer Genome Atlas (TCGA) (https://portal.gdc.cancer.gov/) in January 2020 [Citation14]. Multivariate Cox regression analysis was used to identify independent prognostic factors for CHN1 expression. A Forest map was used to display P-values and hazard ratios (HRs) with 95% confidence intervals (CIs) for each variable using the ‘forestplot’ R package.
KM survival analysis and log-rank tests were used to compare survival differences between high-CHN1 vs. low-CHN1 groups. Temporal ROC analysis was used to compare the prediction accuracy of CHN1 expression. For the KM curve, P-values and HRs with 95% CIs were generated using the log-rank test and univariate Cox proportional hazards regression.
Enrichment analysis
First, we imported the CHN1 gene into the GeneMANIA database to identify its associated genes [Citation21]. TCGA-STAD samples were assigned to high- or low-CHN1 expression groups in accordance with the median of the CHN1 RNA expression data. A total of 490 genes whose expression was positively correlated with that of CHN1 were obtained. A protein–protein interaction network (PPI) including CHN1 and its positively correlated genes was plotted using the GeNets database [Citation22]. Subsequently, these genes were imported into the Metascape database for enrichment analysis [Citation23] Biological Process (BP), Molecular Function (MF), Cellular Component (CC), and Kyoto Encyclopedia of Genes and Genomes (KEGG) pathway analysis.
Gene Set Enrichment Analysis (GSEA) generated an ordered list of all genes based on their relationship with CHN1 expression. Following this, predefined gene sets (biological signatures of gene expression under the perturbation of certain cancer-associated genes) were generated to obtain an enrichment score, which was a measure of the statistical evidence for rejecting the null hypothesis that the genes were randomly distributed in an ordered list [Citation24]. The expression level of CHN1 was used as a phenotype marker, and the ‘Measure of gene sequencing’ was set to Pearson correlation. All other basic and advanced fields were set to default values. Enrichment analysis was performed using the Hallmark gene set data resource (c2. KEGG.v4.0) in the Molecular Signatures Database-MsigDB (http://www.broad. mit.edu/gsea/msigdb/index.jsp) [Citation25]. A normal P-value < 0.05 was considered statistically significant.
Immunological analysis
To make reliable immune infiltration estimations, we utilized CIBERSORT, an R package tool that can evaluate multiple cell types [Citation26]. All the results from the previously mentioned analysis methods and the R package tool were assessed using the ‘ggplot2ʹ and ‘pheatmap’ packages. In addition, the immune module of the TIMER database was used to further calculate the Spearman coefficient of correlation between CHN1 expression and that of common immune checkpoints.
DNA methylation analysis
We evaluated whether the expression of the CHN1 gene was closely related to CHN1 gene methylation. The analysis of CHN1 DNA methylation and the correlation between disease prognosis and CHN1 methylation values was performed using the Methsurv and MEXPRESS databases [Citation27]. We also downloaded CHN1 DNA methylation data, transcriptome data, and clinical data from the TCGA database and visualized it using R software to identify the significance of DNA methylation in the promoter region of CHN1.
Results
In the present study, the differential expression of CHN1 was verified in several GC cell lines and tissues using western blot and IHC. Further, we found a relationship between CHN1 expression and clinical parameters and prognosis, indicating that CHN1 expression is an independent predictor of patient prognosis. Enrichment analysis showed that high expression of CHN1 may contribute to GC progression via multiple pathways. Further, CHN1 expression was correlated with the abundance of multiple immune cell infiltrates and positively correlated with the expression levels of common immune checkpoint proteins, suggesting that it may influence the effectiveness of immunotherapy against GC. Taken together, our results indicated that CHN1 expression influences tumorigenesis and progression in GC and could therefore be used as a potential therapeutic target and prognosticator.
Expression of CHN1 in GC
In order to assess the distinct prognostic and prospective therapeutic significance of differential CHN1 levels in GC patients, mRNA expression was analyzed using the ONCOMINE data repository (www.oncomine. org) and TIMER (http://timer.cistrome.org/). As indicated in ), the expression of CHN1 in 20 types of cancers was determined and compared with that in healthy tissues using the ONCOMINE web resource. Furthermore, we also checked for the expression of CHN1 expression in different types of tumors from the TCGA database via the TIMER web-tool (*P < 0.05, **P < 0.01, ***P < 0.001, and ****P < 0.001). As shown in ), CHN1 was highly expressed in GC. The GEPIA database also showed that the CHN1 expression in GC tissue was significantly elevated ()). Using the IHC analysis of CHN1 expression in 15 sets of GC tumor tissue and paired paracancerous tissue samples, we found that CHN1 immunostaining was cytoplasmic, and the different intensities of IHC staining are shown in ). The mean H-SCORE for CHN1 expression in GC tissues was 83.05, and that in paracancerous tissue was 8.43. Therefore, the expression of CHN1 in tumor tissues was significantly higher than that in paracancerous tissue (P < 0.0001; )).
Figure 1. Expression of CHN1 in gastric cancer (GC). (a-b) Differences in CHN1 expression between different types of human cancers. (c) Relative CHN1 expression in GC tissue based on TCGA data (*P < 0.05). (d) Representative images of different immunohistochemical staining intensities for CHN1. (e) Statistical comparison of CHN1 expression levels (H‑SCORE) in paracancerous and GC tissue (n = 15) (****P < 0.0001). (f-g) Differential expression of CHN1 in normal gastric epithelial cells and GC cells (**P < 0.01, ****P < 0.0001). (h-j) Receiver operating characteristic (ROC) curves and areas under the ROC curves for CHN1 expression obtained using three datasets
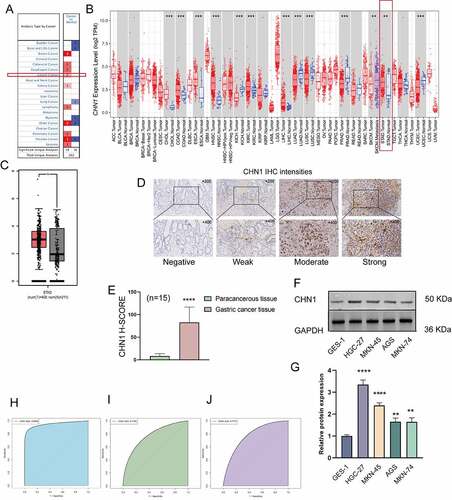
Next, we measured the expression of CHN1 in normal gastric epithelial cells and GC cells at different degrees of differentiation using western blot. As shown in , the levels of CHN1 in HGC-27 (undifferentiated GC cells), AGS (moderately differentiated GC cells), MKN-45 (poorly differentiated GC cells), and MKN-74 (well-differentiated GC cells) were remarkably different from those in GES-1 (healthy gastric epithelial cells) (**P < 0.01, ****P < 0.0001). An ROC curve was employed to detect the accuracy of CHN1 in distinguishing GC from healthy tissues. The area under the curve was 0.9508 ()) for GSE118919, 0.7785 ()) for GSE13861, and 0.7775 ()) for GSE29272.
Clinical significance of CHN1 expression in GC
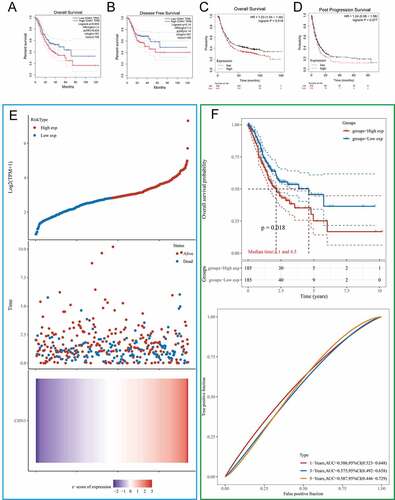
We first used the GEPIA and KMPLOT databases to clarify the association of CHN1 expression with overall survival, disease-free survival, and post-progression survival in GC patients. The results revealed that the probability of survival among GC patients with high CHN1 expression was significantly lower than that among those with low CHN1 expression (P < 0.05) (). According to TGCA-STAD data, the survival duration of the low-risk group was significantly longer than that of the high-risk group (); P < 0.05). Moreover, based on TCGA-STAD data, CHN1 expression was used to predict the OS of GC patients. The areas under the ROC curves of CHN1 expression for 1-, 3-, and 5-year survival were 0.586, 0.575, and 0.587, respectively ().
Figure 2. Kaplan–Meier curves comparing survival between patients with high vs. low expression of CHN1 from three probe sets in the Kaplan-Meier plotter databases and GEPIA. (a) Overall survival (OS) from the GEPIA database. (b) Disease-free survival (DFS) from the GEPIA database. (c) OS from the Kaplan–Meier plotter database. (d) Post-progression survival (PPS) from the Kaplan–Meier plotter database. (e) Curves of risk score. Patients were divided into low-risk and high-risk groups based on median CHN1 expression. The relationship between survival status and survival duration (years) is illustrated. The horizontal coordinates represent samples, and the samples are ordered consistently. (f) Kaplan–Meier survival analysis and time-dependent receiver operating characteristic curve analysis for CHN1 gene expression
We then explored the relationship between CHN1 mRNA expression and T, N, and M stages in GC. The mRNA expression of CHN1 was distinctly lower at the T1 stage than at other T stages in GC (P < 0.05). However, the mRNA expression of CHN1 did not show significant differences according to N and M stages ()).
Figure 3. Diagnostic value of CHN1 levels in GC further analyzed based on clinical characteristics. (a) CHN1 mRNA expression and its relationship with T, N, and M stages in GC. (b) Receiver operating characteristic curves for T stages. (c) Forest plot constructed by combining information on sex, age, tumor grade, stage, and the expression of CHN1. Hazard ratios and P-values of constituents identified using multivariate Cox regression and some parameters related to CHN1 genes are shown
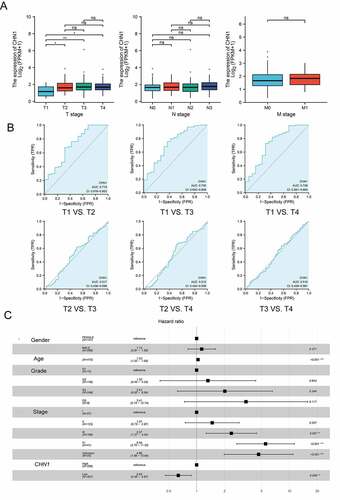
Therefore, we conducted a subsequent analysis of the diagnostic performance of CHN1 in differentiating between T stages. The areas of the ROC curves for ‘T1 vs. T2ʹ, ‘T1 vs. T3ʹ, ‘T1 vs. T4ʹ, ‘T2 vs. T3ʹ, ‘T2 vs. T4ʹ, and ‘T3 vs. T4ʹ were 0.715, 0.730, 0.728, 0.517, 0.512, and 0.510, respectively ()).
Then, a Cox regression model based on TCGA-STAD was used to calculate HRs for different variables. Multivariate analysis revealed that CHN1 overexpression, age, and tumor stage were all closely corelated with poor prognosis in GC (P < 0.05) ()). Importantly, CHN1 expression was verified to be an independent predictor of survival among GC patients.
Functional enrichment analysis for CHN1
The constructed functional network was based on the gene function predictions for CHN1 and was performed using GeneMANIA ()). The differentially expressed genes (DEGs) identified from TCGA-STAD are presented in ); of these, the genes whose expression was positively correlated with that of CHN1 were selected to create a PPI network ()).
Figure 4. Gene network and enrichment analysis. (a) CHN1 with its neighboring genes, along with details about its physical interactions, co-expressing genes, predicted, co-localization, functional pathways, genetic interaction, and shared protein domains. (b) Volcano map of differentially expressed genes (DEGs) in response to CHN1 expression. Red dots represent upregulated genes, and blue dots represent downregulated genes. The abscissa indicates variations in gene expression between different samples (log2 fold change), and the ordinate indicates the significance of the differences (−log10 padj). (c) Network of CHN1 and the genes that show a positive correlation with its expression, based on the GeNets database. (d) GO: BP, (e) GO: CC, (f) GO: MF (g) KEGG. The color of the circle indicates the adjusted P-value, and the size represents the number of genes enriched in the term or pathway
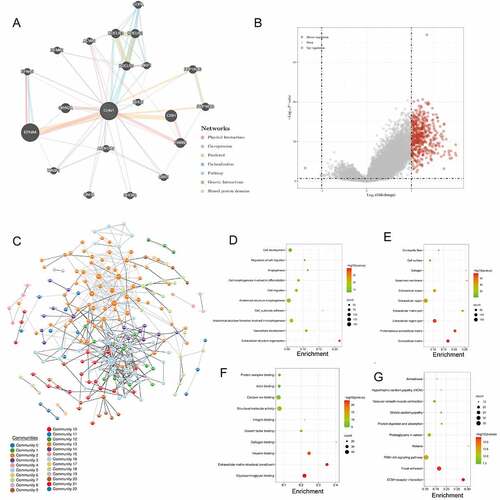
Figure 5. Functional enrichment analysis of CHN1.(a) Interrelation between CHN1 and other genes in GC. (b) GSEA for CHN1.(c) Relationship between CHN1 and six EMT-related factors. Red lines represent a positive correlation and blue lines represent a negative correlation
Then, the functions of CHN1 and its related genes were predicted using GO and KEGG analysis to identify the top 10 GO terms and KEGG pathways. Under the BP module, the DEGs were mainly involved in ‘Cell development’, ‘Regulation of cell migration’, ‘Angiogenesis’, and ‘Cell morphogenesis involved in differentiation’ ()). Under the CC module, the DEGs were mainly concentrated under the terms ‘Contractile fiber’, ‘Cell surface’, ‘Collagen’, ‘Basement membrane’, and ‘Extracellular space’ ()). In the MF module, the DEGs were primarily enriched under ‘Protein complex binding’, ‘Actin binding’, ‘Calcium ion binding’, ‘Structural molecule activity’, and ‘Integrin binding’ ()). KEGG pathway analysis indicated that the DEGs were mainly involved in ‘Amoebiasis’, ‘Hypertrophic cardiomyopathy (HCM)’, ‘Vascular smooth muscle contraction’, ‘Dilated cardiomyopathy’, and ‘Protein digestion and absorption’ ()).
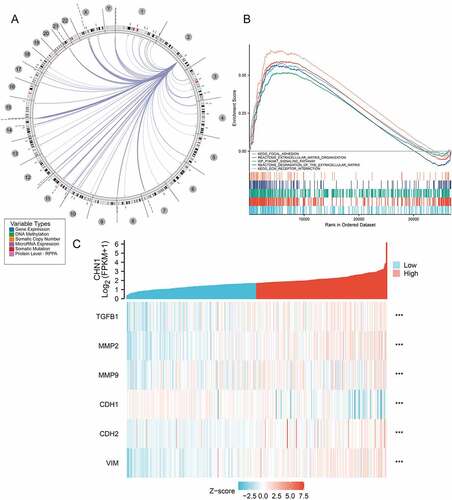
Using the Regulome Explorer, we further analyzed the location of the relevant human genes and the correlation between CHN1 and certain other genes in GC. According to gene associations, DNA methylation, somatic copy number, somatic mutations, and protein levels, circus plots were drawn to display the interrelation between CHN1 and other genes in GC ()). GSEA was applied to perform a hallmark analysis for CHN1. CHN1 was found to be enriched under the terms ‘Focal adhesion’, ‘Extracellular matrix organization’, ‘Degradation of the extracellular matrix’, ‘ECM receptor’, and ‘PI3K-AKT signaling pathway’. Importantly, these pathways were remarkably upregulation in high-risk cases ()). The expression of six epithelial–mesenchymal transition (EMT)-related factors – TGFβ1, MMP2, MMP9, CDH1, CDH2, and VIM – was found to be positively correlated to that of CHN1 (P < 0.001) ()).
Tumor-infiltrating immune cells associated with CHN1 expression in GC
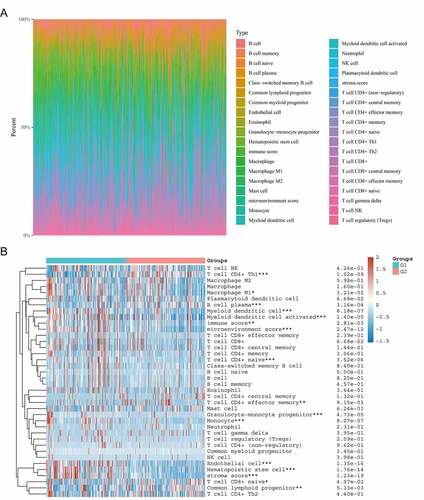
As shown in ), the composition of 35 immune cell types varied significantly across samples. The CIBERSORT algorithm was used to evaluate the correlation between CHN1 expression in the tumor microenvironment and tumor-infiltrating immune cells. We observed that the expression level of CHN1 was correlated with the abundance of infiltration by CD4 + T cells, Th1 cells, M1 macrophages, plasma B cells, myeloid dendritic cells, activated myeloid dendritic cells, naïve CD4 + T cells, CD4+ effector memory T cells, granulocyte–monocyte progenitors, monocytes, endothelial cells, hematopoietic stem cells, naïve CD8 + T cells, and common lymphoid progenitors (P < 0.05). It was also positively correlated with the immune score, microenvironment score, and stroma score (P < 0.05) ()).
Figure 6. Correlation between CHN1 expression and the infiltration of immune cells. (a) Immune cell score heat map, where different colors represent the expression trend in different samples. *P < 0.05, **P < 0.01, and ***P < 0.001, and the asterisk represents the degree of importance (*P). The significance in the two groups of samples passed the Wilcox test. (b) Percentage abundance of tumor-infiltrating immune cells in each sample, with different colors and different types of immune cells. The abscissa represents the sample, and the ordinate represents the percentage of immune in a single sample
Significance of CHN1 in immunotherapy against GC
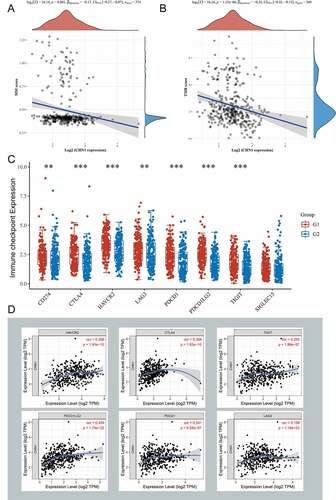
At first, we calculated the correlation between CHN1 levels and tumor mutation burden (TMB) as well as microsatellite instability (MSI) in GC and found that CHN1 expression was negatively correlated with both () and (b)). In addition, we divided patients with GC into high- and low-CHN1 expression groups, and found that CD274, CTLA4, HAVCR2, LAG3, PDCD1, PDCD1LG2, and TIGIT were differentially expressed in the high/low-CHN1 expression group ()). Finally, we calculated the correlation between CHN1 expression and that of these immune checkpoint, and the results are shown in ).
Figure 7. Significance of CHN1 in immunotherapy against gastric cancer. (a) Correlation of CHN1 expression with tumor mutation burden (TMB). (b) Correlation between CHN1 expression and microsatellite instability (MSI). (c) Relationship between the expression of CHN1 and that of common immune checkpoint proteins (ICPs). Red and ue represent the high and low CHN1 expression groups, respectively (*P < 0.05, **P < 0.01, ***P < 0.001). (d) Spearman correlation coefficients for the relationship between CHN1 expression levels and the expression levels of the six ICPs
CHN1 methylation in GC
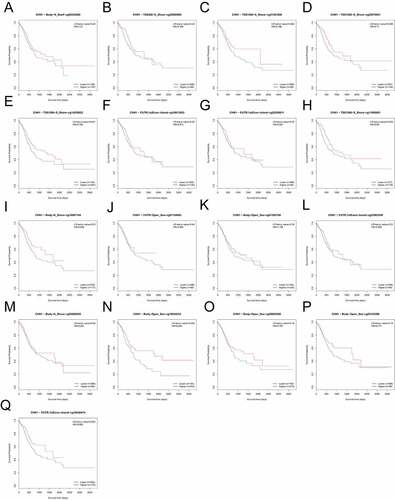
On the basis of methylation data from TCGA-STAD, we observed that methylation values from the methylation probes, cg20258811, cg16813053, cg18440474, cg07504288, cg05195612, cg23003258, cg00939301, cg09456216, cg25850998, cg20070631, cg16907154, cg11695601, cg14355622, and cg01592108 were negatively correlated with CHN1 expression level, while those from methylation probes cg05143398, cg03080493, cg09605298, cg07154063, cg00235460, and cg21361856 were positively correlated with CHN1 expression (, p < 0. 05). The correlation between the degree of CHN1 promoter methylation and CHN1 expression levels revealed a negative relationship between the two (). Further, we observed that low levels of promoter region methylation were predictive of a poor prognosis (). Finally, when all methylation probes were included in the survival analysis, hypomethylation at cg14355622, cg11695601, cg16907154, and cg18545433 showed a statistically significant relationship with survival ().
Figure 8. Analysis of CHN1 methylation in gastric cancer (GC). (a)Waterfall plot for methylation of the CHN1 gene. The correlations between CHN1 methylation and expression were also analyzed. The red cg probe was located in the promoter region.(b-c) Pearson’s correlation coefficient (b) and Spearman correlation coefficient (c) for the relationship between the methylation level at the CHN1 promoter and CHN1 expression.(d-f) Overall survival (d), disease-free survival (e), and progression-free survival (f) based on methylation at the CHN1 gene promoter; P < 0.05 was considered statistically significant
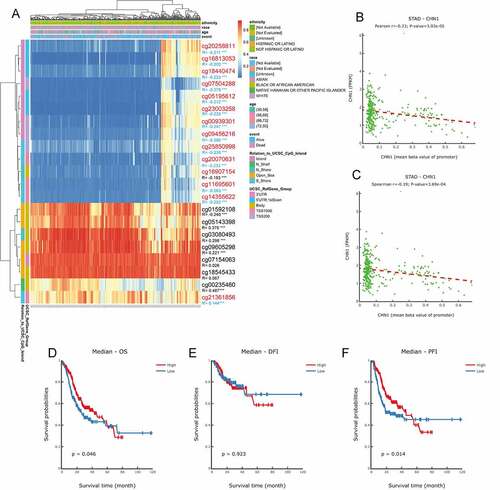
Figure 9. Survival analysis for all methylation probes; P < 0.05 was considered statistically significant
Discussion
GC has had one of the highest mortality and morbidity rates among all malignant tumors over the last five decades [Citation1]. GC development is a gradual process involving several factors such as genetic predisposition, dietary incontinence, H. pylori infection, smoking, alcohol consumption, and environmental pollution [Citation28]. Not only does carcinogenesis in this disease occur via a complex array of genetic structural alterations and expression abnormalities, but these genetic changes are also interrelated and comprise a delicate biological network [Citation29]. The genetic alterations in this network are not simply superimposed; cellular malignancies are triggered by abnormal functioning of a series of network systems regulating gene clusters that play a role in cell growth and differentiation and other pathways [Citation30,Citation31]. Fluctuations in any node can affect the equilibrium of the entire network. Therefore, we preliminarily explored how CHN1 is involved in the development of GC based on bioinformatics.
To date, there have been few reports on CHN1 in tumors, but CHN1 has been found to play an oncogenic role in cervical cancer. Liu et al. showed that CHN1 may induce EMT through the Akt/GSK-3β/Snail signaling pathway, thus participating in the occurrence and development of cervical cancer [Citation32]. In the present study, using public databases and IHC analysis, we demonstrated that the expression of CHN1 was significantly higher in GC than in normal tissue. GC patients with a high expression of CHN1 had a shorter survival duration than those with low expression. Taken together, these results indicated that CHN1 may be an oncogene in GC too and may play an important role in the occurrence and development of GC. Additionally, CHN1 expression levels differed between tumors at various T stages and could be used to differentiate T1 tumors from tumors at other stages. Accordingly, we constructed a PPI network centered around CHN1 as the core gene and found an association between the expression of CHN1 and ERBB2, which is involved in the pathogenesis and adverse consequences of various cancers, including terminal GC and gastro-esophageal junction cancer [Citation33,Citation34]. We then screened for genes co-expressed with CHN1 using TCGA-STAD, and enrichment analysis suggested that CHN1 and these genes may be involved in multiple pathways related to the extracellular matrix. Studies have demonstrated that CHN1 shows synergistic effects with Rac1 and Cdc42 Hs, which can induce the formation of lamellipodia and filopodia. This is the foundation of cell migration, and it is also a key step in tumor cell migration and invasion [Citation35,Citation36]. EMT, which is achieved through a disruption of cell-to-cell adhesion, regulation of cell-matrix interactions, cytoskeletal rearrangement, and acquisition of migration capacity [Citation37], is also related to the transformation of early noninvasive tumors into aggressive malignant tumors [Citation38]. Further, our co-expression analysis also showed that key EMT-related factors such as MMP2, MMP9, CDH2, TGFB1, and VIM were highly expressed when CHN1 was highly expressed, while CDH1 was expressed at lower levels, suggestive of a potential cancer-promoting function of CHN1.
Immunotherapy is currently a hot topic in tumor research [Citation39,Citation40]. Our study showed that CHN1 expression had a significant relationship with infiltration by CD4 + T cells, M1 macrophages, monocytes, plasma B cells, endothelial cells, dendritic cells, and hematopoietic stem cells. We further explored the correlation between CHN1 expression and common immune checkpoint and found positive correlations between the expressions of CHN1 and CD274, CTLA4, HAVCR2, LAG3, PDCD1, PDCD1LG2, and TIGIT. In addition, we also found that CHN1 expression was negatively correlated with TMB and MSI. Multiple studies have analyzed in detail and demonstrated the high correlation of TMB and MSI with immunotherapeutic efficacy [Citation41,Citation42]. Together, these results suggested that CHN1 expression may affect the effectiveness of immunotherapy
DNA methylation is an important epigenetic modification that is closely related to tumor occurrence and development [Citation43–45]. It is well-known that hypermethylation within the promoter region leads to the inactivation of some tumor-suppressor genes. Many studies on different cancer types have shown that a large number of genes are silenced by DNA methylation [Citation46]. Therefore, we evaluated the levels of CHN1 DNA methylation in GC. We found that the degree of methylation at the CHN1 promoter was negatively correlated with CHN1 expression and that hypomethylation of the promoter region was predictive of a poor prognosis in GC patients. Further, we also found that hypomethylation at cg14355622, cg11695601, cg16907154, and cg18545433 was correlated with a poor prognosis in GC patients. Further studies are warranted to elucidate how methylation at different sites in the CHN1 gene affects its expression and survival outcomes in GC patients.
Taken together, our results demonstrate for the first time that CHN1 encourages GC development by controlling several signaling pathways, and its expression is correlated with immune cell infiltration. However, there are some shortcomings and limitations to our study. First, our study was based on information from public databases and published literature, and uneven data quality may have affected our results. Second, the differences in accuracy among the databases used for data analysis and the choice of statistical methods may affect the interpretation of our research results. Nevertheless, we verified our research by analyzing multiple databases and data sets, datasets and obtained similar results, which points to the validity of our study.
Conclusion
Our study confirmed that the levels of CHN1 were higher in GC cells and tissues than in normal gastric epithelial cells and tissues. A high expression of CHN1 was associated with a poor prognosis and with some clinicopathological features of GC. Multivariate analysis revealed that upregulated CHN1 expression in GC is an independent risk factor for shortened OS. Our results showed that high CHN1 expression may regulate GC progression of gastric cancer through via multiple pathways and that CHN1 levels may influence the effectiveness of immunotherapy in GC. Our results suggest that the expression of CHN1 may be a diagnostic and prognostic indicator in GC and could be a potential target for GC treatment.
Disclosure of potential conflicts of interest
Jie-pin Li and Shu-hong Zeng are co-first authors. Dr. Yuan-jie Liu and Dr. Yong-hua Zhang are jointly designated as co-corresponding authors.
Disclosure of potential conflicts of interest
No potential conflict of interest was reported by the author(s).
Authors’ Contributions
Jie-pin Li and Shu-hong Zeng contributed equally to this work.
Ethical Standards
The study was approved by Jiangsu Province Hospital of Chinese Medicine, Affiliated Hospital of Nanjing University of Chinese Medicine, Ethics and Research Committee (protocol number: 2019NL-166-02).
Acknowledgements
The present study was supported by the Youth Science and Technology Project of Suzhou (No. KJXW2019059); the Suzhou Science and Technology Development Plan (No. SYSD2019006); National Nature Science Foundation of china (81973782).
Data Availability
We promise that all the data in this article are authentic, valid and available.
Additional information
Funding
References
- Smyth EC, Nilsson M, Grabsch HI, et al. Gastric cancer. Lancet. 2020;396(10251):635–648. .
- Deng Y, Wang M, Zhou L, et al. Global burden of larynx cancer, 1990-2017: estimates from the global burden of disease 2017 study. Aging (Albany NY). 2020;12(3):2545–2583. .
- Bray F, Ferlay J, Soerjomataram I, et al. Erratum: global cancer statistics 2018: GLOBOCAN estimates of incidence and mortality worldwide for 36 cancers in 185 countries. CA Cancer J Clin. 2020;70(4):313
- IBM SPSS Statistics. Available from: https://www.ibm.com/products/spss-statistics.
- Latest global cancer data: cancer burden rises to 19.3 million new cases and 10.0 million cancer deaths in 2020. Available from: https://www.iarc.who.int/faq/latest-global-cancer-data-2020-qa/.
- Lee J, Ahmed S, Kozma R, et al. The N-terminal region of n-Chimaerin allows lipid modulation of the C-terminal p21rac-GTPase activating domain. Biochem Soc Trans. 1992;20(3):310s. .
- Guan X, Guan X, Dong C, et al. Rho GTPases and related signaling complexes in cell migration and invasion. Exp Cell Res. 2020;388(1):111824. .
- Lawson CD, Ridley AJ. Rho GTPase signaling complexes in cell migration and invasion. J Cell Biol. 2018;217(2):447–457.
- Lim L. n-Chimaerin and neuronal signal transduction mechanisms. Biochem Soc Trans. 1992;20(3):611–614.
- Volk AE, Fricke J, Strobl J, et al. Analysis of the CHN1 gene in patients with various types of congenital ocular motility disorders. Graefes Arch Clin Exp Ophthalmol. 2010;248(9):1351–1357. .
- Rhodes DR, Yu J, Shanker K, et al. ONCOMINE: a cancer microarray database and integrated data-mining platform. Neoplasia. 2004;6(1):1–6. .
- Pan JH, Zhou H, Cooper L, et al. LAYN is a prognostic biomarker and correlated with immune infiltrates in gastric and colon cancers. Front Immunol. 2019;10:6.
- GSE118919. Available from: https://www.ncbi.nlm.nih.gov/geo/query/acc.cgi?acc=GSE118916.
- GSE13861. Available from: https://www.ncbi.nlm.nih.gov/geo/query/acc.cgi?acc=GSE13861.
- GSE29272. Available from: https://www.ncbi.nlm.nih.gov/geo/query/acc.cgi?acc=GSE29272.
- Na Z, Luo Y, Schofield JA, et al. The NBDY microprotein regulates cellular RNA decapping. Biochemistry. 2020;59(42):4131–4142. .
- Zheng J. Immunohistochemistry and immunocytochemistry. Methods Mol Biol. 1998;105:307–314.
- Son HK, Kim D, Lim Y, et al. A novel TGF-β receptor II mutation (I227T/N236D) promotes aggressive phenotype of oral squamous cell carcinoma via enhanced EGFR signaling. BMC Cancer. 2020;20(1):1163. .
- Kurien BT, Scofield RH. Western blotting: an introduction. Methods Mol Biol. 2015;1312:17–30.
- Chen W, Chen X, Li S, et al. Expression, immune infiltration and clinical significance of SPAG5 in hepatocellular carcinoma: a gene expression-based study. J Gene Med. 2020;22(4):e3155. .
- Franz M, Rodriguez H, Lopes C, et al. GeneMANIA update 2018. Nucleic Acids Res. 2018;46(W1):W60–w64. .
- Li T, Kim A, Rosenbluh J, et al. GeNets: a unified web platform for network-based genomic analyses. Nat Methods. 2018;15(7):543–546. .
- Zhou Y, Zhou B, Pache L, et al. Metascape provides a biologist-oriented resource for the analysis of systems-level datasets. Nat Commun. 2019;10(1):1523. .
- Subramanian A, Kuehn H, Gould J, et al. GSEA-P: a desktop application for gene set enrichment analysis. Bioinformatics. 2007;23(23):3251–3253. .
- Liberzon A, Subramanian A, Pinchback R, et al. Molecular signatures database (MSigDB) 3.0. Bioinformatics. 2011;27(12):1739–1740. .
- Chen B, Khodadoust M S , Liu C L , et al. Profiling tumor infiltrating immune cells with CIBERSORT. Methods Mol Biol. 2018;1711:243–259.
- Modhukur V, Iljasenko T, Metsalu T, et al. MethSurv: a web tool to perform multivariable survival analysis using DNA methylation data. Epigenomics. 2018;10(3):277–288. .
- Machlowska J, Baj J, Sitarz M , et al. Gastric Cancer: Epidemiology, Risk Factors, Classification, Genomic Characteristics and Treatment Strategies[J]. International Journal of Molecular Sciences, 2020;21(11):4012.
- Silverman EK, Schmidt H , Anastasiadou E , et al. Molecular networks in Network Medicine: Development and applications[J]. Wiley Interdisciplinary Reviews: Systems Biology and Medicine, 2020;(6951):e1489.
- Conte F, Fiscon G, Licursi V, et al. A paradigm shift in medicine: a comprehensive review of network-based approaches. Biochim Biophys Acta Gene Regul Mech. 2020;1863(6):194416. .
- Fiscon G, Conte F, Farina L, et al. Network-based approaches to explore complex biological systems towards network medicine. Genes (Basel). 2018;9(9):437.
- Liu J, Li Y, Chen X, et al. Upregulation of miR-205 induces CHN1 expression, which is associated with the aggressive behaviour of cervical cancer cells and correlated with lymph node metastasis. BMC Cancer. 2020;20(1):1029. .
- Gerson JN, Skariah S, Denlinger CS, et al. Perspectives of HER2-targeting in gastric and esophageal cancer. Expert Opin Investig Drugs. 2017;26(5):531–540. .
- Meric-Bernstam F, Johnson AM, Dumbrava EEI, et al. Advances in HER2-targeted therapy: novel agents and opportunities beyond breast and gastric cancer. Clin Cancer Res. 2019;25(7):2033–2041. .
- Kozma R, Ahmed S, Best A, et al. The GTPase-activating protein n-chimaerin cooperates with Rac1 and Cdc42Hs to induce the formation of lamellipodia and filopodia. Mol Cell Biol. 1996;16(9):5069–5080. .
- Machesky LM. Lamellipodia and filopodia in metastasis and invasion. FEBS Lett. 2008;582(14):2102–2111.
- De Craene B, Berx G. Regulatory networks defining EMT during cancer initiation and progression. Nat Rev Cancer. 2013;13(2):97–110.
- Pastushenko I, Blanpain C. EMT transition states during tumor progression and metastasis. Trends Cell Biol. 2019;29(3):212–226.
- Geukes Foppen MH, Donia M, Svane IM, et al. Tumor-infiltrating lymphocytes for the treatment of metastatic cancer. Mol Oncol. 2015;9(10):1918–1935. .
- Fridman WH, Pagès F, Sautès-Fridman C, et al. The immune contexture in human tumours: impact on clinical outcome. Nat Rev Cancer. 2012;12(4):298–306. .
- Ren Q, Zhu P, Zhang H, et al. Identification and validation of stromal-tumor microenvironment-based subtypes tightly associated with PD-1/PD-L1 immunotherapy and outcomes in patients with gastric cancer. Cancer Cell Int. 2020;20(1):92. .
- Parikh AR, He Y, Hong TS, et al. Analysis of DNA damage response gene alterations and tumor mutational burden across 17,486 tubular gastrointestinal carcinomas: implications for therapy. Oncologist. 2019;24(10):1340–1347. .
- Klutstein M, Nejman D, Greenfield R, et al. DNA methylation in cancer and aging. Cancer Res. 2016;76(12):3446–3450. .
- Das PM, Singal R. DNA methylation and cancer. J Clin Oncol. 2004;22(22):4632–4642.
- Koch A, Joosten SC, Feng Z, et al. Analysis of DNA methylation in cancer: location revisited. Nat Rev Clin Oncol. 2018;15(7):459–466. .
- Kulis M, Esteller M. DNA methylation and cancer. Adv Genet. 2010;70:27–56.