
ABSTRACT
Splicing factors (SFs) have been increasingly documented to perturb the genome of cancers. However, little is known about the alterations of SFs in hepatocellular carcinoma (HCC). This study comprehensively delineated the genomic and epigenomic characteristics of 404 SFs in HCC based on the multi-omics data from the Cancer Genome Atlas database. The analysis revealed several clinically relevant SFs that could be effective biomarkers for monitoring the onset and prognosis of HCC (such as, HSPB1, DDX39A, and NELFE, which were the three most significant clinically relevant SFs). Functional enrichment analysis of these indicators showed the enrichment of pathways related to splicing and mRNA processes. Furthermore, the study found that SF copy number variation is common in HCC and could be a typical characteristic of hepato-carcinogenesis; the complex expression regulation of SFs was significantly affected by copy number variant and methylation. Several SFs with significant mutation patterns were identified (such as, RNF213, SF3B1, SPEN, NOVA1, and EEF1A1), and the potential regulatory network of SFs was constructed to identify their potential mechanisms for regulating clinically relevant alternative splicing events. Therefore, this study established a foundation to uncover the broad molecular spectrum of SFs for future functional and therapeutic studies of HCC.
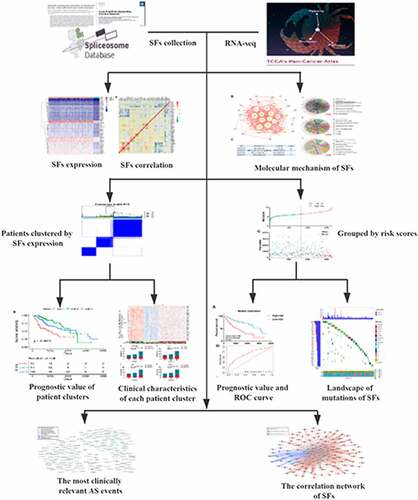
Graphical abstract
Introduction
Alternative splicing (AS) is the primary cause of transcript diversity, and global splicing abnormalities have emerged as remarkable hallmarks of cancers [Citation1–3]. These alternative splicing (AS) can be divided into seven classes: alternate acceptor (AA), alternate donor (AD), alternate promoter (AP), alternate terminator (AT), exon skip (ES), mutually exclusive exons (ME), and retained intron (RI). Intricate splicing events are orchestrated by limited splicing factors (SFs).
The essential roles of SFs in cancers are self-evident and increasing evidence has found significant links between the altered expression of SFs and tumorigenesis, cancer progression, and therapeutic resistance. For example, upregulated SF2/ASF has been identified in various kinds of cancer, and SF2/ASF suppresses the tumor-suppressing activity of BIN1 isoforms by regulating the AS of BIN1 [Citation4]. Furthermore, Jia et al. found that the overexpression of SRp20 promoted carcinogenesis and maintained tumor growth in nude mice [Citation5]. Similarly, hnRNP A2/B1 overexpression was observed in glioblastomas and indicated a poor prognosis. Functionally, the knockdown of hnRNP A2/B1 inhibited tumor formation in glioblastoma cells [Citation6]. These findings highlight the indispensable biological functions of SFs in tumorigenesis and tumor progression, which could provide novel insights into AS regulation and clinical cancer management.
Hepatocellular carcinoma (HCC) is the primary subtype of primary liver cancer, which ranks as the second most common cause of cancer-related death globally [Citation7]. Although the treatment of HCC has greatly improved over the past few decades, the survival rate of HCC patients is still relatively low, and systemic treatments are limited [Citation8]. Therefore, accurate prognostic assessment and studies of HCC mechanisms are important for the development of novel, effective treatments to improve the survival rate.
The phenomenon of turbulent AS was thought to be significantly correlated with the biological processes of HCC [Citation9]. Differential AS is prevalent in HCC and was found to be closely associated with hallmarks of HCC [Citation10]. However, despite the improved understanding of SFs’ function in HCC, the clinical relevance and molecular mechanisms of SFs in HCC have not been fully understood. By using ‘multi-omics’ data from the Cancer Genome Atlas (TCGA), this study characterized the SF expression profiles and their clinical significance for many HCC samples. Furthermore, systematic analyses of somatic mutations, copy number variants (CNVs), and DNA methylation aimed to reveal the potential molecular mechanisms of SFs.
This study focused on the genomic, epigenomic, and transcriptomic landscape of 404 SFs in 371 HCC patients. Multiple data types, including RNA expression, CNVs, point mutations, and DNA methylation, were analyzed to explore their molecular characteristics. It was hypothesized that several clinically relevant SFs could be effective biomarkers for monitoring the onset and prognosis of HCC. Thus, the study aimed to systematically analyze the splicing switch SFs to improve the clinical management and deepen the understanding of the molecular mechanisms of HCC. The present analyses provide a rich resource for understanding SF biology, with the potential to identify disease-specific therapeutic approaches and prognostic biomarkers for HCC, which are expected to improve patient survival.
Materials and Methods
Collection of splicing factors
A compendium of 404 SFs was obtained from a previous study [Citation11]. These genes were collected from three sources, namely 1) spliceosome proteins reported by Hegele et al. [Citation12], 2) SFs and splicing-related proteins annotated by Barbosa-Morais et al. [Citation13], and 3) the online database Spliceosome DB (http://spliceosomedb.ucsc.edu) [Citation14].
mRNA expression analysis and prognosis evaluation
Transcriptome profiling quantification data from the TCGA-LIHC project were downloaded using the TCGA biolinks package in R software. The downloaded date type was fragments per kilobase of exon per million fragments mapped (FPKM), and it was normalized to the transcripts per kilobase million (TPM) data type for differential expression analysis. Then, expression levels of SFs were converted into log2(TPM+1) for further analysis. The differential expression levels between tumor and normal tissues were analyzed using the Student’s t test, and |fold change| ≥ 2 and FDR < 0.05 were considered significant. A Pearson correlation analysis was used to study the co-expression of SFs.
After ruling out patients with an OS < 90 days, 329 HCC patients with an OS ranging from 91–3675 days (median, 643 days) were included. Prognostic assessments of differentially expressed SFs were calculated by univariate Cox analysis. These HCC-specific SFs were the focus of study, as they may be involved in the initiation and progression of HCC and used as clinically applicable molecular biomarkers. These SFs were also submitted to multivariate Cox analysis to construct prognostic signatures.
Evaluation of the correlation with clinical features
The value of these HCC-specific SFs in distinguishing patients into subtypes with distinct prognosis and molecular characteristics was also explored. Unsupervised clustering of the 329 HCC patients was performed using the ConsensusClusterPlus package in R software [Citation15]. K-means and Euclidean distances were used to distinguish subtypes. An 80% item resampling was selected with a maximum evaluated K of 12. The associations between clusters and clinical outcomes were assessed using the chi-squared test. Kaplan-Meier (K-M) survival analysis was used to explore the survival difference between subtypes.
Gene functional annotations
Bioinformatic functional annotations constitute a convenient and efficient way to assess the interconnections and biological characteristics of a panel of genes. The clusterProfiler package in R software was used to compare the biological themes of prognostic SFs [Citation16]. Gene functional enrichment analysis results were displayed using the Goplot package in R software [Citation17]. The protein-protein interaction (PPI) network was calculated via the STRING online database (https://string-db.org/), and Cytoscape software was used to identify hub genes visually.
Somatic mutation landscape of SFs in HCC
Somatic mutation data from TCGA were processed via VarScan [Citation18], and the mutation status of each SF was calculated and classified. The variant classifications included the following: 5ʹUTR, silent, 3ʹUTR, missense mutation, 5ʹFlank, splice site, splice region, frame shift del, nonsense mutation, RNA, intron, in frame del, frame shift ins, translation start site, 3ʹFlank, in frame ins, nonstop mutation, and IGR. The somatic mutation landscape of SFs was displayed using the GenVisR package in R software.
Integrative analysis of SF expression regulators
The relationships between the expression levels of SFs and their somatic mutations, CNV, and DNA methylation were calculated. These multi-omics data were also downloaded from TCGA. The average methylation value for all CpG sites associated with a gene was used as the genes’ methylation level. The methylation and expression data were integrated to identify methylation levels that resulted in changes to the expression profiles.
The average number of copies of overlapping whole genome fragments was estimated and used for analysis. The average truncation of the genomic identification of significant targets in cancer (GISTIC) algorithm was used to classify genes, and the Wilcoxon rank sum test was used to compare the CNV states of tumor samples versus those of normal samples.
Splicing regulatory analysis
Due to the indispensable role of SFs in regulating the process of splicing, the potential relationships between AS events and SFs in HCC were also explored. In the SpliceSeq database (https://bioinformatics.mdanderson.org/TCGASpliceSeq), RNA splicing patterns in HCC patients were calculated and stored as a value called ‘Percent Spliced In’ (PSI) [Citation19]. AS data were downloaded from the SpliceSeq database with stringent filters (samples with PSI value ≥ 80%, standard deviation of PSI value ≥ 0.05). Then, missing data were replenished using the k-nearest neighbor method provided by the impute package in R software. Differences in AS events between HCC and nontumor tissues were calculated using the Wilcoxon test and characterized by fold change and p-value. AS events with a fold change > 2 or < 0.5 and a p-value < 0.05 were identified as significant. Further univariate Cox regression analysis was performed to estimate the relationships between the PSI values of differentially expressed AS events and the OS of HCC patients.
To explore the regulation of SFs on prognostic AS events, the expression data of SFs were integrated with prognosis associated AS events. The Pearson correlation analysis was then conducted to estimate the potential regulatory relationships between the expression level of SFs and the PSI value of splicing events. Then, Cytoscape software (version 3.6.1) was used to generate the regulation network.
Results
The present study explored the clinical relevance of SFs and their potential to act as diagnostic and/or prognostic biomarkers. By using multi-omics data from TCGA, this work characterized the SF expression profiles and their clinical significance for many HCC samples. Furthermore, systematic analyses of somatic mutations, CNVs, and DNA methylation revealed the potential molecular mechanisms of SFs. HCC patients are at high risk and require reliable prognostic biomarkers. Therefore, reliable prognostic SFs might provide a novel prospective on splicing and thus benefit HCC patients with additional systemic therapy.
Expression landscape and clinical relevance of SFs
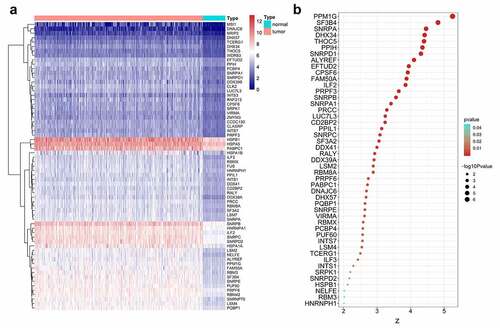
Differential gene expression analysis was conducted to observe the global expression of 404 SFs in 374 HCC patients with 50 adjacent nontumor samples. Notably, 65 SFs were found to be upregulated in HCC, and no SFs were significantly downregulated according to the threshold (). These results suggested the global overexpression of SFs in the initiation of HCC. To further explore the potential prognostic value of SFs, a univariate Cox analysis was performed. Interestingly, 47 of the 65 differentially expressed SFs were significantly negatively correlated with patients’ survival ().
Figure 1. Clinical value assessments of splicing factors (SFs). (a) Heatmap of differentially expressed SFs. (b) Bubble plots display the prognostic value of differentially expressed SFs
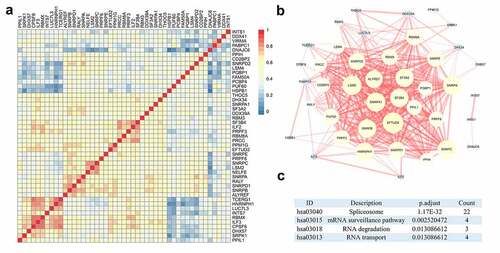
Using the above measures, several clinically relevant SFs were determined to hold potential for clinical applications. Given the overall upregulation of SFs in HCC and its clinical significance, the potential molecular function of these SFs was systematically assessed to determine whether these SFs had a close relationship. Correlation analysis revealed that the set of SFs was significantly correlated with each other by expression levels ( and Figure S1). Furthermore, the PPI network also hinted that SFs were closely connected to each other ().
Figure 2. Interactions and relationships among clinically relevant splicing factors (SFs). (a) The protein-protein interaction network revealed the close interrelationship among SFs. (b) Heatmap of the correlation coefficients of these SFs. (c) Enrichment pathways of clinically relevant SFs
Biomedical functions of clinically relevant SFs in HCC
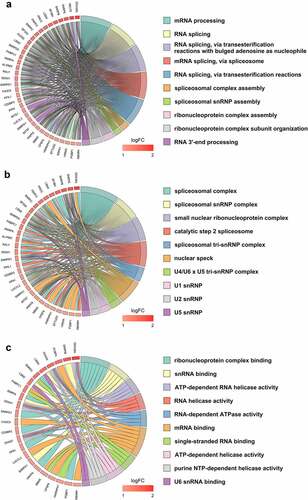
To demonstrate the functional landscape of clinically relevant SFs, several computational biomedical algorithms were conducted to excavate their potential molecular characteristics. Not surprisingly, the ‘spliceosome’ was the most significant KEGG pathway. The ‘mRNA surveillance pathway,’ ‘RNA degradation,’ and ‘RNA transport’ pathways were also enriched by these SFs (). But interestingly, the most significant KEGG pathway for all differentially expressed genes is also ‘spliceosome’ (Figure S2). Regarding the GO category, these genes were categorized into the following categories: biological process (BP), cellular component (CC), and molecular function (MF). For BP, ‘mRNA splicing,’ ‘RNA splicing,’ and ‘RNA splicing, via transesterification reactions with bulged adenosine as nucleophile’ were the three most significant terms (). For CC, ‘spliceosomal complex,’ ‘spliceosomal snRNP complex,’ and ‘small nuclear ribonucleoprotein complex’ ranked in the top three of the significant terms (). The top three MFs were ‘ribonucleoprotein complex binding,’ ‘snRNA binding,’ and ‘ATP-dependent RNA helicase activity’ ().
Figure 3. Gene ontology terms for clinically relevant splicing factors (SFs). (a) Biological process; (b) Cellular component; (c) Molecular function
SF clusters associated with prognosis and molecular characteristics
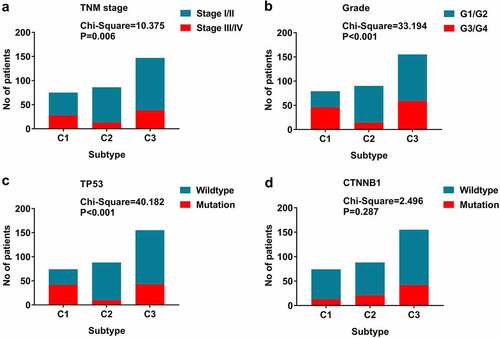
The expression profiles of SFs varied considerably from person to person and partly reflected the prognosis. The consensus unsupervised cluster suggested that patients were subdivided into three groups: C1 (80, 24.3%), C2 (91, 27.7%) and C3 (158, 48.0%; ). Additionally, the consensus matrix heatmap indicated that the three subtypes had significant interconnectivity. K-M plots indicated that the patients in each subgroup were associated with distinct patterns of OS (). C2 had the best prognosis relative to C3, while C1 had the least favorable outcome. The heatmap showed that C2 had the lowest SF expression levels relative to C3, while C1 had the highest SF expression levels (). The distribution of different TNM stages, histological grades, and TP53 mutations between clusters were different. For example, tumors classified as C1 were in an advanced TNM stage and had more frequent TP53 mutations ().
Figure 4. Splicing factors clusters associated with distinct prognosis. (a) Consensus matrix heatmap defined three clusters of samples for which consensus values range from 0 (in white, samples never clustered together) to 1 (dark blue, samples always clustered together). (b) Kaplan-Meier survival analysis of patients within different clusters on overall survival
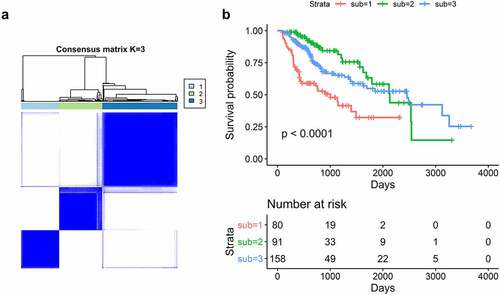
Figure 5. Heatmap of splicing factors clusters. Heatmap of the 329 HCC patients ordered by cluster, with annotations associated with each cluster
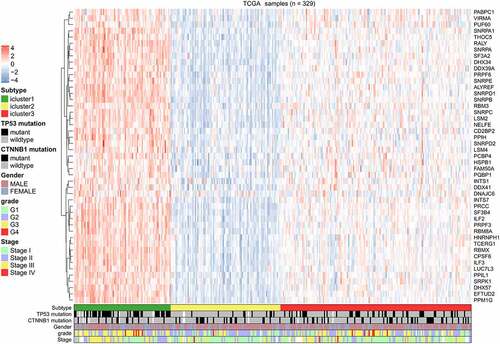
Figure 6. The relationship between molecular characteristics and subtypes. (a)TNM stage; (b) Histological grade; (c) TP53 mutation; (d) CTNNB1 mutation; P-values are from chi-square tests
Prognosis prediction value of SFs
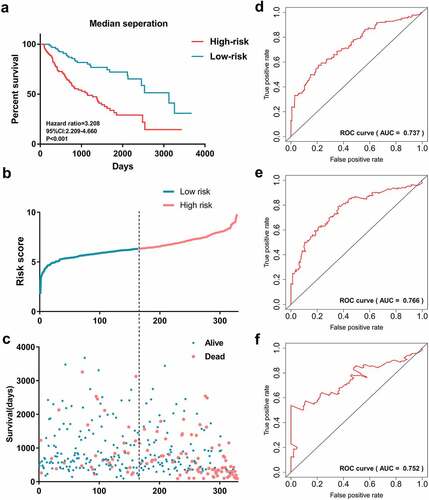
Prognosis prediction is important in clinical work. Therefore, the prognostic biomarkers were screened using univariate and multivariate Cox regression analysis. Then, 47 clinically relevant SFs were submitted to the multivariate Cox regression analysis, and a prognostic signature based on 19 SFs was developed. The formula was as follows: prognostic signature = ALYREF*0.525 + CD2BP2*(−0.444) + CPSF6*0.771 + DDX39A*(−0.451) + DHX34*0.544 + DHX57*(−0.896) + FAM50A*0.476 + ILF3*(−1.151) + LSM2*0.428 + LUC7L3*0.44 + NELFE*(−0.625) + PABPC1*0.506 + PPM1G*1.019 + PUF60*(−0.55) + RBMX*(−0.823) + SF3B4* 0.727 + SNRPA*0.572 + SNRPD2*(−0.769) + THOC5*0.701. The gene name represents its expression in this patient and each fixed-value represents the regression coefficient (namely beta value). Each patient obtained a risk score based on the formula. Patients were then separated into high-risk and low-risk groups based on the median risk score and optimum value. Patients in the high-risk group suffered poor OS compared with patients in the low-risk group (median separation: hazard ratio [HR] = 3.208, 95% confidence interval [CI]: 2.209–4.660, p < 0.001, ). Scatter plots also revealed that the survival status of HCC patients was significantly correlated with risk score (). The time-dependent ROC curves revealed a moderate prognostic value. The AUC of ROC curves were 0.737, 0.766, and 0.752 in 1000 days, 2000 days, and 3000 days, respectively (). Additionally, the protein levels for these 19 genes included in the prognostic signature were evaluated by immunohistochemical (IHC) from Human Protein Atlas. There is an overexpressed trend for all 18 genes (the protein of THOC5 is not detected by Human Protein Atlas project) in liver cancer tissues (Figure S3).
Figure 7. Survival prediction performance of the prognostic signature. (a)Kaplan-Meier curves generated based on median separation. Risk group separation based on median separation (b). Survival status of patients in different risk groups based on median separation (c). Receiver operating characteristic curves displayed the predicted performance in 1000 (d), 2000 (e) and 3000 days (f)
Somatic mutation landscape of SFs in HCC
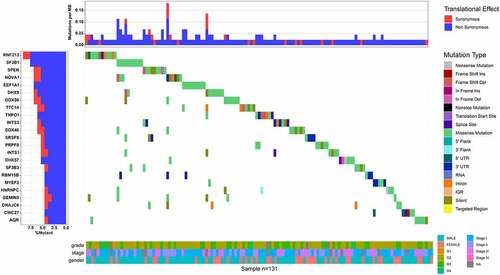
Among the SFs in HCC, 23 oncogenes were identified that consistently were more frequently mutated in HCC tissues than in the nontumor tissues (). The top five most frequently mutated genes were RNF213, SF3B1, SPEN, NOVA1, and EEF1A1 (11%).
Figure 8. Landscape of mutations of splicing factors (SFs) in hepatocellular carcinoma. The most frequent mutated SFs in hepatocellular carcinoma
Epigenetic regulation of SF expression
Given the important role of CNV alterations in the regulation of gene expression [Citation20], the CNV profiles of SFs were systematically analyzed through TCGA . The top 10 SFs most frequently involved in a CNV event in HCC samples were CLK2 (235/379, 62.0%), PRCC (233/379, 61.5%), INTS3 (231/379, 60.9%), ILF2 (231/379, 60.9%), CELF3 (222/379, 58.6%), CCAR2 (221/379, 58.3%), SNRPE (221/379, 58.3%), ZC3H11A (221/379, 58.3%), DHX9 (218/379, 57.5%), and INTS7 (218/379, 57.5%). Statistically significant differences in CNV were observed between tumor and nontumor tissues.
The correlation of SFs and DNA methylation, an epigenetic modification that actively participates in controlling gene expression, were calculated [Citation21]. Significant correlations were observed with DNA methylation for 15 SFs in HCC (Pearson coefficient < −0.3 and p < 0.05; Figure S4). The most 5 methylated SFs were FAM50B, SRSF12, SRSF8, HSPA1B, DDX39A. But of note, many anti-correlation seems to be false positive even though methylation and gene expression shows a negative correlation.
Potential interaction mechanisms of SFs
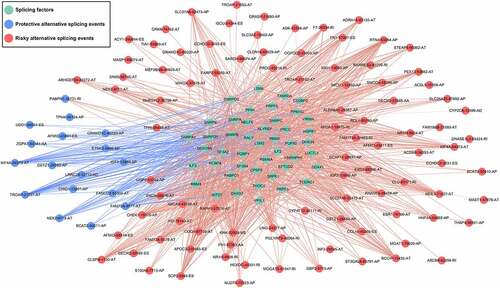
A total of 928 differentially expressed AS events were screened out based on the study’s criteria. Then, survival analysis screened out 177 prognostic predictors (). Subsequently, 45 survival-related SFs (green dots) were significantly correlated with 110 survival-related AS events, among which 17 were markedly related with favorable survival in patients (blue dots). Furthermore, 93 were markedly related with worse clinical outcome (red dots; ). Interestingly, the riskiest AS events (red dots) were positively correlated (red lines) with SF expression levels (green dots), while most protective AS events (blue dots) were negatively correlated (blue lines) with SF expression levels (blue dots).
Figure 9. The most clinically relevant alternative splicing events in hepatocellular carcinoma
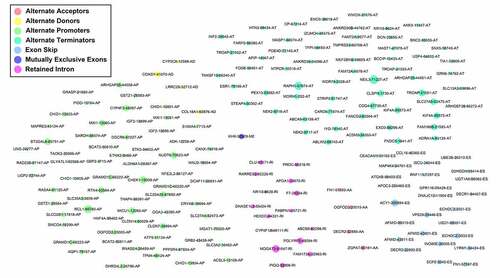
Figure 10. The interaction network of splicing factors. Correlation network between expression of survival AS factors and PSI values of AS genes generated using Cytoscape. Green dots were survival associated splicing factors. Blue/Red dots were favorable/adverse AS events. Red/blue lines represent positive/negative correlations between substances
Discussion
SFs orchestrate intricate and essential mechanisms in tumorigenesis and progression. Conventional experiments have focused on a single SF to capture the downstream mechanism, which is limited by technology. Next generation sequencing technology allows the global alterations of SFs in HCC to be surveyed from the perspective of multi-omics. Thus, the molecular perspective landscape of SFs and their potential regulatory mechanisms was systematically analyzed in the present study. Due to the large sample size, broad coverage of multi-omics data, and integral clinical information provided by TCGA, future functional and therapeutic studies of HCC from the perspective of SF perturbation can be performed.
This study focused on the genomic, epigenomic, and transcriptomic landscape of 404 SFs in 371 HCC patients. Multiple data types, including RNA expression, CNVs, point mutations, and DNA methylation, were analyzed to explore their molecular characteristics. Considering that a predominant task of the present study was to explore the clinical relevance of SFs and their potential to act as diagnostic and/or prognostic biomarkers, 47 individual SFs that were not only aberrantly expressed at the onset of HCC but also exerted significant prognostic value were identified. Intriguingly, these SFs were all upregulated in HCC tissues when compared with noncancerous tissues. Furthermore, the overexpression of these differentially expressed SFs indicated decreased survival. These results suggested that the unusually overexpressed SFs might be the carcinogenic factors in HCC. HSPB1, DDX39A, and NELFE were the three most significant clinically relevant SFs. HSPB1, also called Hsp27, is overexpressed in many kinds of cancers [Citation22]. Previously, researchers have proposed that Hsp27 is upregulated and confers aggressiveness in HCC to facilitate HCC malignancy [Citation23–25]. Similarly, DDX39A is upregulated in HCC and promotes HCC growth and metastasis [Citation26,Citation27]. Recently, Dang et al. reported NELFE as an oncogenic protein that induces a transcriptome perturbation by selectively regulating MYC signaling [Citation28]. These relevant published studies and the rigorous screening process herein could help cancer researchers identify clinically applicable biomarkers.
Further functional enrichment and correlation analyses revealed that these SFs were in mutual close contact. Not surprisingly, these SFs actively participated in the processing of spliceosomes, which confirmed the biological, functional roles of clinically relevant SFs in the AS process. This study’s findings also indicated that patients with higher SF expression profiles suffered poor prognosis. This may have been due to the more frequent splicing process in highly invasive tumors. HCC patients are at high risk and require reliable prognostic biomarkers. Thus, reliable prognostic SFs might provide a novel prospective on splicing and benefit HCC patients with additional systemic therapy. Significant research on gene expression-based prognostic signatures has led to the effective clinical management of HCC [Citation29,Citation30], but survival estimation research on SFs is limited. From the perspective of the splicing process, the clinical prognostic signature mediated by individual SFs was excellent for monitoring survival and provided a novel indicator for monitoring the status of splicing alterations.
SF mutations can induce a transcriptome-wide alteration of the splicing process, which leads to transcriptional disorders that are beneficial to cancers [Citation11]. This study observed the mutation landscape of SFs and found that many SFs possessed a high frequency of mutation. RNF213, SF3B1, and SPEN were the three genes that had the most frequent mutations. RNF213 and SF3B1 have also been identified as driver genes in HCC based on recent comprehensive genomic characterization analyses [Citation31,Citation32], while the roles of SPEN in HCC have not been fully explored. These genes have not been extensively studied and could have great promise in future studies.
CNV is an essential regulator of gene expression levels and has been actively explored in cancer research [Citation33]. Notably, the present systematic investigation showed common, frequent CNV events of SFs in HCC samples when compared with nontumor tissues; the expression levels of clinically relevant SFs had significant relationships with their CNV status. DNA methylation is a common epigenetic mechanism that regulates gene expression [Citation34]. Thus, these findings suggested that the expression of SFs may be regulated by CNV and DNA methylation.
The clinical significance and potential biological functions of AS events in cancers is one of the hotspots in cancer research [Citation35–37]. Cancer-specific splicing misregulation has been increasingly considered as a hallmark of tumorigenesis and tumor invasion [Citation38]. Furthermore, splicing regulatory mechanisms are some of the most important regulatory mechanisms of SFs. The splicing regulation network construction showed the potential relationships between clinically relevant SFs and splicing events. These findings also provided another insight into the biogenesis and progression mechanisms of HCC. This study built on a previously published tool and focused on seven types of AS events, including AA, AT, AP, AT, ES, ME, and RI [Citation19,Citation39]. The splicing-related network showed a clear trend that most prognostic AS events were positively correlated with SF expression, while poor prognosis AS events were negatively correlated with SF expression. SNRPA, SNRPB, and SNRPD1 ranked at the core of the network and regulated the most AS events.
The advantages of high-throughput sequencing technology were utilized by this study to rapidly generate high-quality multi-omics maps for different types of tumor samples. The study provided a cost-effective and systematic framework for assessing molecular characteristics to better understand the clinical significance and molecular characteristics of SFs.
Conclusion
By using multi-omics data from TCGA, this study found significant links between the altered expression of SFs and tumorigenesis, cancer progression, and therapeutic resistance. The potential regulatory network of SFs was constructed to identify their potential mechanisms in regulating clinically relevant AS events. Therefore, this study established a foundation to uncover the broad molecular spectrum of SFs for future functional and therapeutic studies of HCC. In the future, an in-depth investigation should be performed to validate these findings.
Highlights
The study comprehensively delineated the genomic and epigenomic characteristics of 404 SFs in HCC.
The potential regulatory network of SFs was constructed to identify their potential regulatory mechanisms.
A cost-effective and systematic framework was provided to understand SFs’ significance.
Supplemental Material
Download ()Acknowledgements
The authors would like to thank the TCGA Spliceseq and TCGA databases for the availability of the data.
Disclosure statement
No potential conflict of interest was reported by the author(s).
Supplementary material
Supplemental data for this article can be accessed here.
Additional information
Funding
References
- Dvinge H, Bradley RK. Widespread intron retention diversifies most cancer transcriptomes. Genome Med. 2015;7:45.
- Kim HK, Pham MHC, Ko KS, et al. Alternative splicing isoforms in health and disease. Pflugers Arch. 2018;470:995–1016.
- Danan-Gotthold M, Golan-Gerstl R, Eisenberg E, et al. Identification of recurrent regulated alternative splicing events across human solid tumors. Nucleic Acids Res. 2015;43:5130–5144.
- Karni R, De Stanchina E, Lowe SW, et al. The gene encoding the splicing factor SF2/ASF is a proto-oncogene. Nat Struct Mol Biol. 2007;14:185–193.
- Jia R, Li C, McCoy JP, et al. SRp20 is a proto-oncogene critical for cell proliferation and tumor induction and maintenance. Int J Biol Sci. 2010;6:806–826.
- Golan-Gerstl R, Cohen M, Shilo A, et al. Splicing factor hnRNP A2/B1 regulates tumor suppressor gene splicing and is an oncogenic driver in glioblastoma. Cancer Res. 2011;71:4464–4472.
- Valery PC, Laversanne M, Clark PJ, et al. Projections of primary liver cancer to 2030 in 30 countries worldwide. Hepatology. 2017.
- Sanduzzi-Zamparelli M, Diaz-Gonzalez A, Reig M. New systemic treatments in advanced hepatocellular carcinoma. Liver Transpl. 2018.
- Tremblay MP, Armero VE, Allaire A, et al. Global profiling of alternative RNA splicing events provides insights into molecular differences between various types of hepatocellular carcinoma. BMC Genomics. 2016;17:683.
- Vanderwalde A, Spetzler D, Xiao N, et al. Microsatellite instability status determined by next-generation sequencing and compared with PD-L1 and tumor mutational burden in 11,348 patients. Cancer Med. 2018;7:746–756.
- Seiler M, Peng S, Agrawal AA, et al. Somatic mutational landscape of splicing factor genes and their functional consequences across 33 cancer types. Cell Rep. 2018;23:282–96 e4.
- Hegele A, Kamburov A, Grossmann A, et al. Dynamic protein-protein interaction wiring of the human spliceosome. Mol Cell. 2012;45:567–580.
- Barbosa-Morais NL, Carmo-Fonseca M, Aparicio S. Systematic genome-wide annotation of spliceosomal proteins reveals differential gene family expansion. Genome Res. 2006;16:66–77.
- Cvitkovic I, Jurica MS. Spliceosome database: a tool for tracking components of the spliceosome. Nucleic Acids Res. 2013;41:D132–41.
- Wilkerson MD, Hayes DN. ConsensusClusterPlus: a class discovery tool with confidence assessments and item tracking. Bioinformatics. 2010;26:1572–1573.
- Yu G, Wang LG, Han Y, et al. clusterProfiler: an R package for comparing biological themes among gene clusters. OMICS. 2012;16:284–287.
- Walter W, Sanchez-Cabo F, Ricote M. GOplot: an R package for visually combining expression data with functional analysis. Bioinformatics. 2015;31:2912–2914.
- Koboldt DC, Zhang Q, Larson DE, et al. VarScan 2: somatic mutation and copy number alteration discovery in cancer by exome sequencing. Genome Res. 2012;22:568–576.
- Ryan M, Wong WC, Brown R, et al. TCGASpliceSeq a compendium of alternative mRNA splicing in cancer. Nucleic Acids Res. 2016;44:D1018–22.
- Gamazon ER, Stranger BE. The impact of human copy number variation on gene expression. Brief Funct Genomics. 2015;14:352–357.
- Zemach A, McDaniel IE, Silva P, et al. Genome-wide evolutionary analysis of eukaryotic DNA methylation. Science. 2010;328:916–919.
- Huang ZC, Li H, Sun ZQ, et al. Distinct prognostic roles of HSPB1 expression in non-small cell lung cancer. Neoplasma. 2018;65:161–166.
- Luk JM, Lam CT, Siu AF, et al. Proteomic profiling of hepatocellular carcinoma in Chinese cohort reveals heat-shock proteins (Hsp27, Hsp70, GRP78) up-regulation and their associated prognostic values. Proteomics. 2006;6:1049–1057.
- Cheng J, Lv Z, Weng X, et al. Hsp27 acts as a master molecular chaperone and plays an essential role in hepatocellular carcinoma progression. Digestion. 2015;92:192–202.
- Zhang Y, Tao X, Jin G, et al. A targetable molecular chaperone Hsp27 confers aggressiveness in hepatocellular carcinoma. Theranostics. 2016;6:558–570.
- Zhang T, Ma Z, Liu L, et al. DDX39 promotes hepatocellular carcinoma growth and metastasis through activating Wnt/beta-catenin pathway. Cell Death Dis. 2018;9:675.
- Naboulsi W, Megger DA, Bracht T, et al. Quantitative tissue proteomics analysis reveals versican as potential biomarker for early-stage hepatocellular carcinoma. J Proteome Res. 2016;15:38–47.
- Dang H, Takai A, Forgues M, et al. Oncogenic activation of the RNA binding protein NELFE and MYC signaling in hepatocellular carcinoma. Cancer Cell. 2017;32:101–14 e8.
- Wu Y, Wang PS, Wang BG, et al. Genomewide identification of a novel six-LncRNA signature to improve prognosis prediction in resectable hepatocellular carcinoma. Cancer Med. 2018. DOI:10.1002/cam4.1854
- Long J, Zhang L, Wan X, et al. A four-gene-based prognostic model predicts overall survival in patients with hepatocellular carcinoma. J Cell Mol Med. 2018;22:5928–5938.
- Cancer Genome Atlas Research Network. Electronic address wbe, Cancer Genome Atlas Research N. Comprehensive and integrative genomic characterization of hepatocellular carcinoma. Cell. 2017;169:1327–41 e23.
- Li X, Xu W, Kang W, et al. Genomic analysis of liver cancer unveils novel driver genes and distinct prognostic features. Theranostics. 2018;8:1740–1751.
- Zack TI, Schumacher SE, Carter SL, et al. Pan-cancer patterns of somatic copy number alteration. Nat Genet. 2013;45:1134–1140.
- Yang X, Han H, De Carvalho DD, et al. Gene body methylation can alter gene expression and is a therapeutic target in cancer. Cancer Cell. 2014;26:577–590.
- Mao S, Li Y, Lu Z, et al. Survival-associated alternative splicing signatures in esophageal carcinoma. Carcinogenesis. 2018.
- Xiong Y, Deng Y, Wang K, et al. Profiles of alternative splicing in colorectal cancer and their clinical significance: a study based on large-scale sequencing data. EBioMedicine. 2018;36:183–195.
- Huang ZG, He RQ, Mo ZN. Prognostic value and potential function of splicing events in prostate adenocarcinoma. Int J Oncol. 2018;53:2473–2487.
- Zhang J, Manley JL. Misregulation of pre-mRNA alternative splicing in cancer. Cancer Discov. 2013;3:1228–1237.
- Ryan MC, Cleland J, Kim R, et al. SpliceSeq: a resource for analysis and visualization of RNA-Seq data on alternative splicing and its functional impacts. Bioinformatics. 2012;28:2385–2387.