
 ?Mathematical formulae have been encoded as MathML and are displayed in this HTML version using MathJax in order to improve their display. Uncheck the box to turn MathJax off. This feature requires Javascript. Click on a formula to zoom.
ABSTRACT
Lung adenocarcinoma (LUAD) is one of the main causes of cancer deaths globally. Redox is emerging as a crucial contributor to the pathophysiology of LUAD, which can be regulated by long non-coding RNAs (lncRNAs). The aim of our research is to identify a novel redox-related lncRNA prognostic signature (redox-LPS) for better prediction of LUAD prognosis. 535 LUAD samples from The Cancer Genome Atlas (TCGA) database and 226 LUAD samples from the Gene Expression Omnibus (GEO) database were included in our study. 67 redox genes and 313 redox-related lncRNAs were identified. After performing LASSO-Cox regression analysis, a redox-LPS consisting of four lncRNAs (i.e., CRNDE, CASC15, LINC01137, and CYP1B1-AS1) was developed and validated. Our redox-LPS was superior to another three established models in predicting survival probability of LUAD patients. Univariate and multivariate Cox regression analysis revealed that risk score and stage were independent prognostic indicators. A nomogram plot including risk score and stage was constructed to predict survival probability of LUAD patients; this was further verified by calibration curves. Functional enrichment analysis and gene set enrichment analysis, were performed to determine the differences in cellular processes and signaling pathways between the high – and low-risk subgroups. A variety of algorithms (such as single-sample gene set enrichment analysis and CIBERSOFT) were conducted to uncover the landscape of tumor immune microenvironment in the high- and low-risk subgroups. In conclusion, a novel independent redox-LPS was constructed and validated for LUAD patients, which might provide new insights for clinical decision-making and precision medicine.
Graphical abstract
GRAPHICAL ABSTRACT
Introduction
Lung adenocarcinoma (LUAD) is the most common type of lung cancer, with an average five-year survival rate of 21.2% in the USA and 19.8% in China [Citation1,Citation2]. With the widespread application of gene chip and sequencing technology, a variety of sensitive and effective methods have been proposed for the diagnosis and prognostic prediction of LUAD [Citation3,Citation4]. Even so, LUAD is still the most common cause of mortality among all cancers worldwide. Therefore, the development of a novel prognostic signature for better prediction of LUAD prognosis is of critical significance.
Many scholars have concluded that redox homeostasis is a physiological regulation to stress responses such as tumors, which plays an important role in physical health [Citation5–8]. Additionally, several studies have indicated that redox is implicated in tumorigenesis, disease progression, and drug resistance in LUAD [Citation9–11]. Oxidative stress, a process caused by the accumulation of reactive oxygen species (ROS), is common in many types of tumor cells [Citation12,Citation13]. Interestingly, it can be either tumor-promoting or tumor-killing, which depends on the level of ROS. Oxidative eustress (a slight increase in ROS) can promote the occurrence and development of tumors through regulation of a variety of intracellular signaling pathways. However, oxidative distress (high level of ROS) can cause tumor cell death [Citation14,Citation15].
Long non-coding RNAs (lncRNAs) are functional RNA molecules of more than 200 nucleotides in length. Although they do not play a role in encoding proteins, they can regulate gene expression at the epigenetic, transcriptional, and post-transcriptional levels and participate in a variety of pathophysiological processes [Citation16]. Research has revealed that lncRNAs interact with redox regulation. Redox regulation can change the expression of lncRNAs. In turn, lncRNAs can also influence redox regulation [Citation17].
Hence, the aim of the current study was to identify and validate a novel redox-related lncRNA prognostic signature (redox-LPS) for better prediction of the prognosis of LUAD patients. In addition, the differences in cellular processes, signaling pathways, and immune status between the high– and low-risk subgroups would be explored. The goal was to develop a nomogram plot to predict survival probability of LUAD patients for clinical decision-making and individual management.
Methods
Data acquisition and data procession
First, the TCGA database was utilized to obtain the transcriptome profiling and complete clinical data of LUAD samples (535 samples; 55,268 genes). Next, the GEO database was accessed and a dataset (GSE31210) containing the transcriptome profiling and complete clinical data of LUAD samples (226 samples; 20,174 genes) was obtained. All data from the TCGA and GEO databases were converted into log2(x + 1) form for further analysis [Citation18]. After intersecting all genes from the two datasets, 18,870 differential genes were identified. Then, the ‘Surrogate Variable Analysis (sva)’ package in R was utilized to batch normalize the gene expression profile data from the different databases [Citation19]. Additionally, the Molecular Signatures Database (MSigDB) (https://www.gsea-msigdb.org/gsea/msigdb) was searched and two redox-related gene sets, ‘GO_CELL_REDOX_HOMEOSTASIS’ and ‘GO_RESPONSE_TO_REDOX_STATE’, were downloaded, which contained 59 and 14 genes, respectively. After removing two duplicate genes, there were 71 redox-related genes left. Furthermore, the human gene transfer format (gtf) file was obtained from the Ensembl database (http://www.ensembl.org/) and was further utilized to distinguish lncRNAs from protein-coding genes.
Identification of redox-related lncRNAs and group division
Based on the expression profiling of the TCGA dataset, the Pearson correlation coefficients between redox-related protein-coding genes and all lncRNAs were calculated by the built-in function ‘cor.test’ in R [Citation20]. Subsequently, lncRNAs with |correlation coefficients| >0.4 and p values <0.001 were considered as redox-related lncRNAs for further analysis [Citation21]. Then, the expression of redox-related lncRNAs was combined with clinical information in the TCGA and GEO datasets, respectively. Due to a lack of clinical survival data, 45 samples in the TCGA dataset were excluded. Subsequently, 490 samples in the TCGA dataset and 226 samples in the GEO dataset were retained. Then, the 490 samples in the TCGA dataset were randomly divided into a train cohort (n = 246) and test1 cohort (n = 244) at an approximate ratio of 1:1. In addition, all samples in the TCGA dataset were allocated to the test2 cohort (n = 490) and all samples in the GEO cohort were allocated to the test3 cohort (n = 226).
Construction and verification of a redox-LPS
In the train cohort, univariate Cox regression analysis was utilized to identify redox-related lncRNAs with prognostic value (filter criteria: p < 0.1) [Citation22]. Then, least absolute shrinkage and selection operator (LASSO) regression analysis was performed to avoid over-fitting and select appropriate variables among the redox-related lncRNAs with prognostic value [Citation23]. Subsequently, multivariate Cox proportional hazards regression analysis was utilized to construct a redox-LPS and risk score was calculated using the following formula: risk score = [Citation24]. After calculating the risk score of each sample in the train cohort, all 246 samples were stratified into high-risk and low-risk subgroups according to the median risk score [Citation25]. The LUAD patients in the test1 cohort, test2 cohort, and test3 cohort were all stratified into high– and low-risk subgroups according to the median risk score obtained in the train cohort [Citation26]. For internal and external validation of the redox-LPS, the following analyses were conducted in the train cohort, test1 cohort, test2 cohort, and test3 cohort, respectively (1) principal component analysis (PCA) to explore the distribution of different subgroups, utilizing the ‘ggplot2’ R package [Citation27]; (2) survival analysis to evaluate the predictive ability of the signature, utilizing the Kaplan-Meier method [Citation28]; (3) receiver operating characteristic (ROC) curves to test the redox-LPS diagnostic value of one-year, three-year, and five-year survival rates [Citation29]; (4) C-indices to evaluate the predictive effectiveness of the redox-LPS [Citation30].
In addition to these, the predictive performance of our redox-LPS was compared with another three prognostic signatures (an immune signature constructed by Guo et al, an autophagy-related gene prognostic signature constructed by Zhu et al, and a seven-gene signature constructed by Zhang et al) [Citation31–33]. All genes used for construction of Guo’s, Zhu’s and Zhang’s prognostic signatures were obtained. The gene expression profiles and corresponding clinical information were preserved for further analysis. Then, the ‘survival’, ‘tidyverse’, and ‘timeROC’ packages in R were applied to evaluate the predictive abilities of our redox-LPS, Guo’s signature, Zhu’s signature and Zhang’s signature.
Co-expression relationships between redox genes and their related lncRNAs, and their clinical significance
After validating the accuracy of redox-LPS for the prediction of LUAD prognosis, a Sankey diagram and correlation circle plot were constructed to reveal the co-expression relationships between redox genes and their related lncRNAs based on the gene expression profiles of the train cohort [Citation30]. Following this, the chi-square test was utilized to investigate the correlations between these redox genes, their related lncRNAs, and the clinical parameters of LUAD patients, including gender, smoking history, and stage [Citation27].
Identification and validation of the independent prognostic value of the risk score acquired from the redox-LPS
Univariate and multivariate Cox regression analyses were performed to identify the independent prognostic value of the risk score. Only the statistically significant indicators (p < 0.05) in both univariate and multivariate Cox regression analyses were considered to be independent prognostic factors. Because the clinical information provided by the TCGA and GEO databases was not the same, we only conducted independent prognostic analyses of three cohorts (i.e., train cohort, test1 cohort, and test2 cohort) from the TCGA database. Subsequently, these independent prognostic factors laid the foundation for the construction of nomogram plots for quantitative analysis of the clinical outcomes of LUAD [Citation34].
Construction and validation of a risk score-based nomogram plot
In order to offer a quantitative method to predict the survival probability of LUAD patients in clinical practice, the package ‘rms’ in R was utilized to construct a nomogram plot by integrating independent prognostic indicators based on the train cohort. Following this, its predictive performance was validated in train, test1, and test2 cohorts using calibration curves. In addition, multivariate ROC curves were plotted to compare the prognostic performance of the nomogram with other clinical prognostic factors, including age, gender, smoking history, and stage, on the basis of the area under the curve (AUC) [Citation35].
Characterization of the tumor immune microenvironment in high – and low-risk subgroups
Based on the algorithms of CIBERSORT, XCELL, EPIC, MCPCOUNTER, and QUANTISEQ, TIMER2.0 database (http://timer.cistrome.org/) provides a comprehensive immune signature of tumor infiltrating cells in a diverse array of tumor samples from TCGA database [Citation36]. The ‘pheatmap’ package in R was applied to demonstrate the infiltration of various immune cells for each sample in train, test1, and test2 cohorts. Subsequently, the ‘limma’ package in R was used to calculate the statistical differences of immune cell infiltration between high– and low-risk subgroups, and only those immune cells with statistically significant differences (p < 0.05) were preserved.
Gene ontology (GO) functional annotation, gene set enrichment analysis (GSEA), and single-sample gene set enrichment analysis (ssGSEA)
In order to better understand the potential mechanisms of the different prognoses between the high– and low-risk subgroups, GO functional annotation, GSEA, and ssGSEA were performed in the train cohort. First, the package ‘limma’ in R was used to determine the differentially expressed genes (DEGs; |log2FC| >1 and FDR <0.05) between the high– and low-risk subgroups [Citation37]. Following this, the ‘clusterProfiler’ package in R was used to conduct GO functional annotation of DEGs; meanwhile, GSEA was employed for Kyoto Encyclopedia of Genes and Genomes (KEGG) analysis using the software GSEA 4.0.3 (http://www.gsea-msigdb.org) [Citation38]. The gtm file or geneset for ssGSEA of immune cell and immune function has been shown in the ‘Supplementary gtm file’. Ultimately, the ‘gsva’ package in R was used to conduct ssGSEA to determine the immunocyte infiltrations and immune-related functions that differed between the high– and low-risk subgroups [Citation39].
Results
The novel redox-LPS was composed of four lncRNAs: Colorectal Neoplasia Differentially Expressed (CRNDE), Cancer Susceptibility 15 (CASC15), Long Intergenic Non-Protein Coding RNA 1137 (LINC01137), and CYP1B1 Antisense RNA 1 (CYP1B1-AS1). The redox-LPS could help predict the 1-year, 3-year, and 5-year survival probability of LUAD patients. Univariate and multivariate Cox regression analysis revealed that risk score and stage were independent prognostic indicators. A nomogram plot including risk score and stage was constructed to predict survival probability of LUAD patients. Functional enrichment analysis, GSEA, and ssGSEA were performed to determine the differences in cellular processes, signaling pathways, and immune status between the high– and low-risk subgroups.
Identification of redox-related lncRNAs and group division
Four of the 71 redox-related genes (i.e., NCF1, TXNDC5, TXNRD3, and PDIA5) were excluded due to an absence of expression among the 18,870 intersecting genes; thus, a total of 67 redox-related genes were included for further analysis. A total of 1630 lncRNAs were screened out from the list of 18,870 intersecting genes according to the gene annotation in the gtf file. After applying the threshold of |Pearson correlation coefficient| >0.4 and p value <0.001, 313 redox-related lncRNAs were retained for further analysis. In addition, after excluding LUAD samples with incomplete clinical data, there were 490 samples in the TCGA dataset and 226 samples in the GEO dataset remaining. In order to identify and validate a novel redox-LPS that could truly predict the prognosis of LUAD patients, the combination of internal verification and external verification was adopted. Of note, the test1 and test2 cohorts were considered as the internal verification, and the test3 cohort was considered as the external verification.
Construction of the redox-LPS based on the train cohort
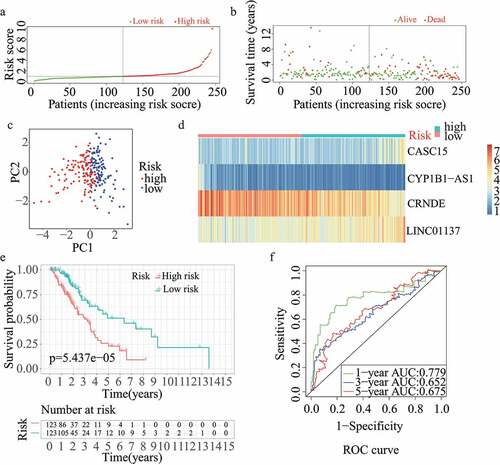
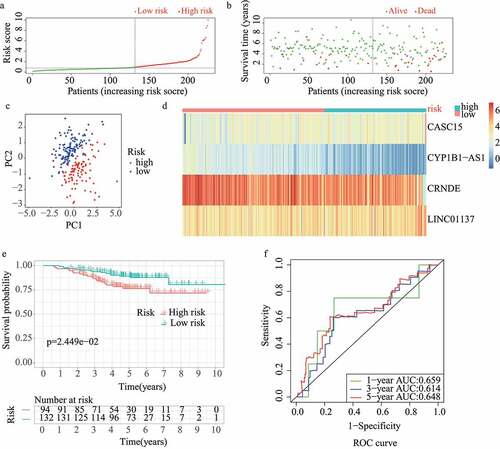
The results of the univariate Cox regression analysis showed that 57 of the 313 redox-related lncRNAs were potential prognostic indicators (Supplementary Table 1). Following this, LASSO regression analysis was conducted to eliminate collinearity among the 57 redox-related lncRNAs and avoid over-fitting of the prognostic model (Supplementary Figure 1A and 1B). 4 redox-related lncRNAs were obtained for further multivariate Cox regression analysis. Ultimately, multivariate Cox proportional hazards regression analysis involving four redox-related lncRNAs (i.e., CRNDE, CASC15, LINC01137, and CYP1B1-AS1) was performed to establish a novel redox-LPS (Supplementary Figure 1C). On the basis of the Cox coefficient, the risk score was calculated as follows: (0.351843870912946 × expression level of CASC15) – (0.336130524310107 × expression level of CRNDE) + (0.404548536917624 × expression level of LINC01137) – (0.747769589685504 × expression level of CYP1B1-AS1). Subsequently, LUAD patients in the train cohort were divided into high– and low-risk subgroups based on the median risk score of 0.951304 (). The distributions of the risk scores and survival status are shown in ; it can be seen that patients with high risk scores were more likely to die. The PCA result shown in indicates that the patients in the two subgroups could be clearly distinguished. The heatmap in depicts the expression levels of the four lncRNAs involved in the model, which are aligned with the coefficients in the calculation formula. Compared with the low-risk subgroup, CASC15 and LINC01137 were more highly expressed in the high-risk subgroup; however, CRNDE and CYP1B1-AS1 exhibited lower expression levels in the high-risk subgroup. Consistently, patients in the high-risk subgroup exhibited a worse overall survival rate (p < 0.05) (). Additionally, a prognosis evaluation of the risk score for LUAD patients was performed. The AUC values of the ROC curves were 0.779, 0.652, and 0.675 for one-, three-, and five-year survival, respectively (). The c-index was 0.704 in the train dataset, suggesting that the redox-LPS exhibited great prognostic performance.
Figure 1. Construction of redox-LPS in train cohort. (A) Group division on the basis of median risk score in train cohort. (B) Distributions of risk score and survival status in train cohort. (C) PCA in train cohort. (D) Heatmap about the expression levels of the four lncRNAs involved in the signature in train cohort. (E) Survival curve of train cohort. (F) ROC curves of train cohort
Validation of the redox-LPS based on the three test datasets
For validation of the reliability of the redox-LPS, risk scores were calculated, and samples were distinguished in the test1 cohort, test2 cohort, and test3 cohort, respectively (). Of note, the median risk score of 0.951304 obtained in the train cohort was a unified standard when distinguishing the samples. In both internal verification (test1 and test2 cohorts) and external verification (test3 cohort), the distributions of the risk scores and survival status in the three cohorts exhibited similar trends to those observed in the train cohort () and PCA demonstrated that patients in the two subgroups could be clearly distinguished (). The heatmaps obtained from the test1, test2, and test3 cohorts showed the same high-expression genes (CASC15, LINC01137) and low-expression genes (CRNDE, CYP1B1-AS1) in high-risk subgroup (). Additionally, patients with high risk scores had worse overall survival rates, in both internal verification and external verification (all p < 0.05) (). Regarding the ROC curves, the AUC values of the ROC curves were 0.645, 0.671, and 0.617 in the test1 cohort and 0.701, 0.662, and 0.65 in the test2 cohort for one-, three-, and five-year survival, respectively. In the external verification, the AUC values were 0.645, 0.671, and 0.617 in the test3 dataset (). In the external verification, the AUC values were 0.659, 0.614, and 0.648 in the test3 dataset (). The c-index was 0.614, 0.656, and 0.616 in the test1, test2, and test3 datasets, respectively.
Figure 2. Internal validation of redox-LPS in test1 cohort. (A) Group division in test1 cohort. (B) Distributions of risk score and survival status in test1 cohort. (C) PCA in test1 cohort. (D) Heatmap about the expression levels of the four lncRNAs involved in the signature in test1 cohort. (E) Survival curve of test1 cohort. (F) ROC curves of test1 cohort
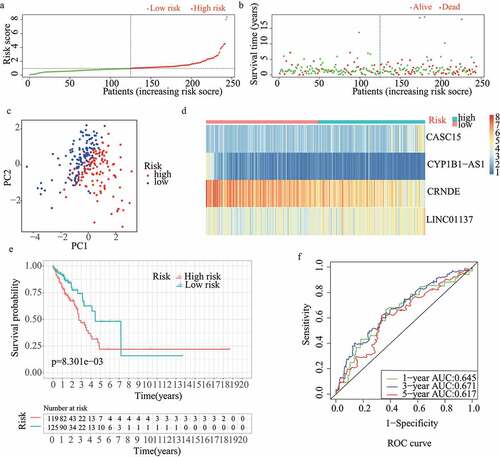
Figure 3. Internal validation of redox-LPS in test2 cohort. (A) Group division in test2 cohort. (B) Distributions of risk score and survival status in test2 cohort. (C) PCA in test2 cohort. (D) Heatmap about the expression levels of the four lncRNAs involved in the signature in test2 cohort. (E) Survival curve of test2 cohort. (F) ROC curves of test2 cohort
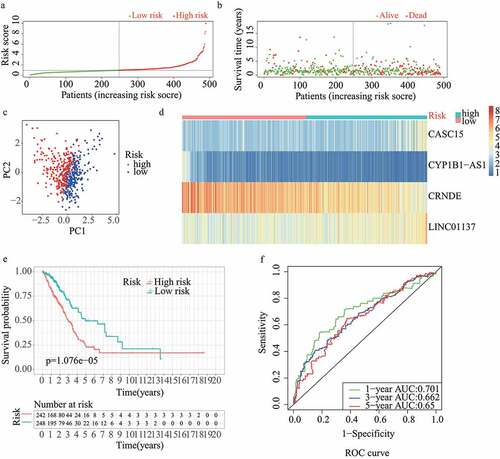
Figure 4. External validation of redox-LPS in test3 cohort. (A) Group division in test3 cohort. (B) Distributions of risk score and survival status in test3 cohort. (C) PCA in test3 cohort. (D) Heatmap about the expression levels of the four lncRNAs involved in the signature in test3 cohort. (E) Survival curve of test3 cohort. (F) ROC curves of test3 cohort
For the train and test2 cohorts, survival probability predicted by our redox-LPS is superior to the other three prognostic signatures. And for the test1 cohort, our redox-LPS showed a similar predictive power of survival probability to the other three prognostic signatures ().
Figure 5. Comparative analysis, co-expression analysis, and clinical significance analysis. The AUC values of the ROC curves for predictive performance of redox-LPS compared with Guo’s, Zhu’s and Zhang’s signatures in (A)train cohort, (B)test1 cohort, and (C)test2 cohort. (D)Sankey diagram for corresponding relationship and (E)circle plot for degree of co-expression between six redox-genes and four lncRNAs. Differential expression of these six redox-genes and four-lncRNAs between (F)female/male patients sex, (G)stage I/II/III/IV patients, and (H)patients with different smoking history (Smoker I: Lifelong Non-smoker (less than 100 cigarettes smoked in Lifetime); Smoker II: Current smoker (includes daily smokers and non-daily smokers or occasional smokers); Smoker III: Current reformed smoker for >15 years (greater than 15 years); Smoker IV: Current reformed smoker for ≤15 years (less than or equal to 15 years); Smoker V: Current reformed smoker, duration not specified)
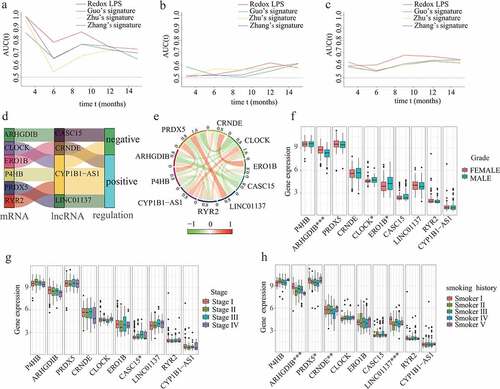
Co-expression relationships between redox genes and their related lncRNAs, and the clinical significance of them
Based on the LASSO-Cox regression analysis, a total of four lncRNAs were included in our prognostic model. According to the Pearson correlation analyses, there were obvious co-expression relationships between these four lncRNAs and six redox-related protein-encoding genes (i.e., ARHGDIB, CLOCK, ERO1B, P4HB, PRDX5, and RYR2). The Sankey diagram demonstrated the corresponding relationships between the six redox-related protein-encoding genes and four lncRNAs (). The correlation circle plot revealed the degree of co-expression between the six redox-related genes and four lncRNAs (). In order to explore the potential clinical significance of these six redox-related genes and four-lncRNAs, chi-square tests were performed to investigate differential expression of these six redox-related genes and four-lncRNAs between different clinical subgroups. The results showed that ARHGDIB, CLOCK, and ERO1B were significantly associated with LUAD gender (); CASC15 was significantly associated with LUAD stage (); ARHGDIB, PRDX5, CRNDE, and LINC01137 were significantly associated with LUAD smoking habits ().
Identification and validation of the independent prognostic value of the risk score acquired from the redox-LPS
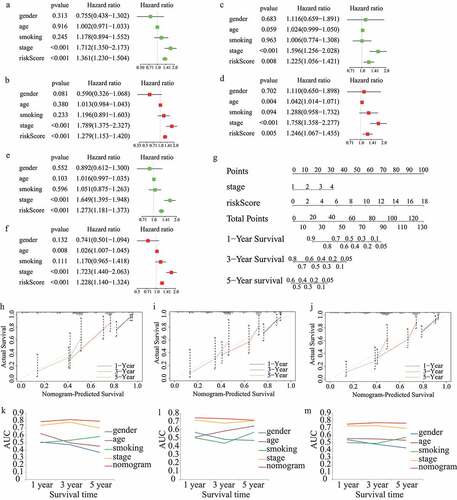
The results of the univariate and multivariate cox regression analyses in the train cohort showed that the risk score was an independent prognostic indicator (risk score: univariate HR = 1.361, 95%CI = 1.230 − 1.504, p < 0.001; multivariate HR = 1.279, 95%CI = 1.153 − 1.420, p < 0.001; ). In addition, stage was an independent prognostic index (). More importantly, the independent prognostic role of risk score and stage in LUAD was confirmed in the test1 cohort () and test2 cohort ().
Figure 6. Construction and validation of the risk score-based nomogram plot. Univariate and multivariate cox regression analyses in (A,B)train cohort, (C,D)test1 cohort, and (E,F)test2 cohort.(G)The nomogram plot for 1-year, 3-year, and 5-year survival rate in train cohort. Calibration curves for accuracy validation of the nomogram in (H)train cohort, (I)test1 cohort, and (J)test2 cohort. The AUC values of the ROC curves for better evaluating the prognostic performance of the nomogram in (K)train cohort, (L)test1 cohort, and (M)test2 cohort
Construction and validation of a risk score-based nomogram plot
In order to quantitatively evaluate the survival probabilities of LUAD patients, a nomogram plot for one-year, three-year, and five-year survival rates was constructed based on the risk score and stage of each LUAD patient in the train cohort (). Meanwhile, predictive performance of the nomogram plot was validated in the train, test1, and test2 cohorts using calibration curves. The results indicated that the nomogram-predicted and actual survival probabilities were generally aligned (). In addition, multivariate ROC curves were plotted to evaluate the prognostic performance of the nomogram and clinical parameters. The results showed that the nomogram was an effective prognostic indicator, even compared with tumor stage. The AUC values of the ROC curves were 0.787, 0.814, and 0.792 in the train cohort (), 0.746, 0.735, and 0.716 in the test1 cohort () and 0.750, 0.770, and 0.763 in the test2 cohort () for one-, three-, and five-year survival probability, respectively.
Tumor immune microenvironment analysis, GO functional annotation, GSEA, and ssGSEA
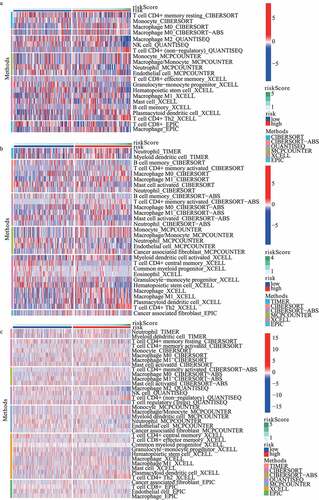
The landscape of the distribution of immune cell infiltration in train, test1, and test2 cohorts has been shown in , respectively. On the basis of the results from MCPCOUNTER, the infiltration of neutrophil showed a lower level in the high-risk subgroup in train cohort, test1 cohort and test2 cohort, respectively. Additionally, according to the results from XCELL, plasmacytoid dendritic cell (pDC) and Th2 cells in the high-risk subgroup revealed a higher proportion. Furthermore, compared with low-risk subgroup, endothelial cell significantly diminished in high-risk subgroup based on MCPCOUNTER algorithm.
Figure 7. The landscape of the distribution of immune cell infiltration in (A) train, (B) test1, and (C) test2 cohorts
Based on |log2FC| >1 and FDR <0.05, 274 DEGs (including 148 up-regulated and 126 down-regulated genes) between the high– and low-risk subgroups in the train dataset were identified (). Then, these DEGs were used for GO functional annotation, GSEA, and ssGSEA. As shown in , the DEGs were associated with many redox-related functions such as monooxygenase activity, oxidoreductase activity, and oxygen binding, as well as many other functions such as vitamin metabolic process, positive regulation of defense response to bacterium, and fibroblast growth factor receptor binding. In addition, several KEGG pathways were explored by GSEA, including amino sugar and nucleotide sugar metabolism, biosynthesis of unsaturated fatty acids, oxidative phosphorylation, P53 signaling pathway, pentose phosphate pathway, and proteasome. Of note, all these involved pathways had higher enrichment scores in the high-risk subgroup ().
Figure 8. GO functional annotation, GSEA, and ssGSEA. (A) DEGs between high- and low-risk subgroups. (B) GO functional annotation of DEGs. (C-H) KEGG pathways with higher enrichment score in high-risk subgroup explored by GSEA. (I) The difference of immune cells between high-risk and low-risk subgroups. (J) The difference of immune functions between high-risk and low-risk subgroups
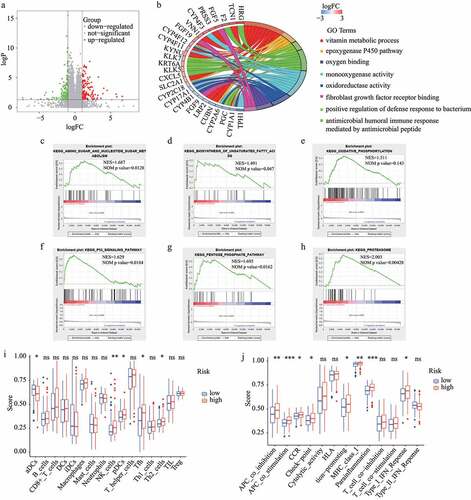
The results regarding the difference in immune status between the high-risk and low-risk subgroups were obtained from ssGSEA and are shown in . The antigen presentation process exhibited a noteworthy difference between the two subgroups. Notably, the aDCs score was lower in the high-risk subgroup while the scores for the other antigen presentation processes were higher in the high-risk subgroup, including APC co-inhibition, APC co-stimulation, and MHC class I. Further, the scores for NK cells, pDCs, Tfh, Th2 cells, CCR, check-point, inflammation-promoting, parainflammation, and Type I IFN response were higher in the high-risk subgroup. Interestingly, tumor immune microenvironment analysis showed similar results. The landscape of immune cell infiltration based on XCELL revealed a higher proportion of pDCs and Th2 cells in the high-risk subgroup, which is consistent with the analysis by ssGSEA. Yet, it is worth noting that some of these processes are protective while others are risk.
Discussion
At present, lung cancer has the highest mortality among all cancers, accounting for about one-quarter of all cancer deaths [Citation40]. Although progress has been made in the treatment of lung cancer in recent decades, the prognosis of patients is still poor [Citation41]. Lung adenocarcinoma is one of the most common pathological types of lung cancer [Citation42]. Therefore, it is of critical importance to explore more prognostic factors for lung adenocarcinoma. In recent years, many studies have shown that lncRNAs are associated with tumorigenesis, progression, drug resistance, and prognosis of LUAD [Citation43–45]. Additionally, it has been reported that redox can interact with lncRNAs and then influence the occurrence and progression of LUAD [Citation9]. Consequently, this research sought to develop and validate a specific redox-LPS for better prediction of LUAD prognosis.
In this study, the prognostic performance of redox-related lncRNAs in LUAD was extensively investigated. A novel redox-LPS consisting of four lncRNAs (i.e., CRNDE, CASC15, LINC01137, and CYP1B1-AS1) was identified based on LASSO-Cox regression analysis. It has been reported that CRNDE is associated with many cancers, including colorectal cancer [Citation46], hepatocellular carcinoma [Citation47], and pancreatic cancer [Citation48]. Many tumor-related pathways can be regulated by CRNDE, such as the wnt/β-catenin signaling pathway [Citation49], miR-33a-5p/CDK6 axis [Citation50], and miR-126-5p/ATAD2 axis [Citation51]. In addition, CRNDE can also decrease chemoresistance in gastric cancer [Citation52]. CASC15, a tumor-associated lncRNA, may serve as a therapeutic target in many tumors [Citation53]. Through targeting miR-101-3p, CASC15 promotes proliferation and metastasis in both cervical cancer and nasopharyngeal carcinoma [Citation54,Citation55]. CASC15 functions as an oncogene in bladder cancer through sponging miR-130b-3p [Citation56]. It has also been reported that the upregulation of CASC15 is connected with poor prognosis in lung cancer, which is consistent with the current findings. Interestingly, miR-130b-3p can also be targeted by CASC15 in non-small cell lung cancer [Citation57]. LINC01137, a short-lived lncRNA, can be degraded by nuclear RNases. It upregulates after exposure to hydrogen peroxide (oxidative stress), which is consistent with our proposal of its role as a redox-related lncRNA, and may become an indicator of stress responses [Citation58]. CYP1B1-AS1 is emerging as a powerful prognostic indicator for acute myeloid leukemia (AML), and plays an important part in the intracellular biological process and extracellular microenvironment of AML cells [Citation59]. Above all, the four lncRNAs in our signature showed potential impacts on multiple types of cancers.
Subsequently, the LUAD patients in the train, test1, test2, and test3 cohorts were all split into high– and low-risk subgroups according to the median risk score computed in the train cohort. For all cohorts, low-risk LUAD patients had a survival advantage over high-risk LUAD patients, which was verified by time-dependent ROC analyses.
Till now, multiple signatures have been established and validated to help predict the prognosis of LUAD patients. Compared with prognostic signatures conducted by Guo et al, Zhu et al and Zhang et al, our redox-LPS exhibits a higher predictive accuracy for LUAD patients.
Univariate and multivariate Cox regression analyses revealed the independent prognostic role of risk score and stage in LUAD patients. Hence, stage and risk score were selected to plot a nomogram in train cohort and the survival probabilities of LUAD patients were then quantitatively analyzed. The predictive accuracy of the nomogram was demonstrated by calibration curves in train, test1 and test2 cohorts. Time-dependent multivariate ROC curves indicated that the prognostic performance of nomogram for one-, three-, and five-year survival was superior to other clinical parameters including tumor stage.
After verifying the universality of the redox-LPS, four lncRNAs used to construct the redox-LPS were closely studied to investigate their co-expressed redox genes. Following this, the clinical significance of these redox genes and lncRNAs was revealed. In order to better understanding the potential mechanisms underlying the differential prognoses of the high– and low-risk subgroups, a total of 274 DEGs between these subgroups were then identified. GO annotation showed that the DEGs were primarily enriched in many redox processes, including the epoxygenase P450 pathway, monooxygenase activity, oxidoreductase activity, and oxygen binding. The GSEA results revealed that oxidative phosphorylation, biosynthesis of unsaturated fatty acids, P53 signaling pathway, and pentose phosphate pathway were significantly enriched in the high-risk subgroup. In addition to these, ssGSEA was conducted to reveal the discrepancy in immune status between the high – and low-risk subgroups.
It is generally accepted that the tumor immune microenvironment is complex, and anti-cancer and cancer-promoting immune responses often exist simultaneously in local tumor tissue. Consistently, the results of this study indicated that there were significant differences in both anti-cancer and cancer-promoting immune responses between the high– and low-risk subgroups. The results revealed significantly different scores between the high– and low-risk subgroups for dendritic cells (DCs), which are the most powerful professional antigen presenting cells (APCs) in the body. Activate DCs (aDCs) have the potential to promote the secretion of cytokines with anti-tumor abilities, including TNF-α and IL-12 from T helper (Th) 1 cells [Citation60]. Plasmacytoid DCs (pDCs) establish an immunosuppressive tumor microenvironment and promote immune tolerance [Citation61]. Th2 cells, as a mediator of humoral immunity, can limit the protective function of Th1 cells. In addition, the immune response is usually biased to Th2 in malignant tumors and the up-regulation of Th2 protects tumor cells from immune rejection [Citation62,Citation63]. The immune checkpoint involving CTLA-4, PD-1, and PD-L1 is involved in an inhibitory signaling pathway in the immune system. Expressed on the surface of T cells, CTLA-4 can inhibit the early stage of T cell activation, leading to tumor cell immune escape after binding with its ligand. The combination of PD-1 and PD-L1 can form an immunosuppressive tumor microenvironment [Citation64,Citation65]. The current results revealed that aDCs scores were significantly lower in the high-risk subgroup and pDCs, Th2, and immune checkpoint scores were significantly higher in the high-risk subgroup. Likewise, XCELL also revealed a higher proportion of pDCs and Th2 in the high-risk subgroup compared to that in the low-risk subgroup. This suggests that the anti-tumor immune response in the high-risk subgroup was weaker.
However, it is worth noting that the scores for certain anti-tumor immune cells and immune-related functions were significantly higher in the high-risk subgroup. NK cells, as an important part of the innate immune system, have a cytotoxic function and secrete various immune regulatory cytokines; they are the first line of defense against malignant tumors [Citation66,Citation67]. Follicular helper T cell (Tfh), as a CD4 + T cell, can help B cells to activate and mature and are conducive to the control of tumor development through expression of IL-21, CXCL13, and other molecules. Deletion of the CXCL13 gene leads to the occurrence of tumors [Citation68,Citation69]. Type I interferon (IFN-I) acts to enforce the killing and destructive effect of NK cells and cytotoxic T lymphocyte (CTL) cells on tumor cells. Additionally, IFN-I enhances endogenous antigen presentation by promoting the expression of major histocompatibility complex-I (MHC-I). Interestingly, the current results revealed that the NK, Tfh, IFN-I, and MHC-I scores were significantly higher in the high-risk subgroup. Notably, the inflammatory response score was also significantly higher in the high-risk subgroup compared to the low-risk subgroup. Overall, unbalanced anti-cancer and pro-cancer responses and an enhanced inflammatory response might be responsible for the poorer prognosis of high-risk LUAD patients.
There are several limitations of this study that should be noted. First, because the clinical data from the GEO database were inconsistent with the data from the TCGA database, only the TCGA data were used in the train, test1, and test2 cohorts to test if risk score was an independent prognostic predictor. Having external validation may be better when verifying this nomogram. Second, a relatively small number of LUAD patients from the TCGA and GEO databases were utilized to establish the redox-LPS. Hence, a large prospective clinical study is warranted to validate the predictive power of our prognostic signature. Third, the redox-LPS was constructed by pure bioinformatics analysis and further basic experiments are warranted to verify our results.
Conclusions
A redox-LPS was successfully constructed and verified for the accurate prediction of the clinical outcomes of LUAD patients. The potential clinical significance of redox genes and redox-related lncRNAs were explored. Then, a nomogram comprising this signature and clinical stage was developed as a quantitative tool to help predict the survival probability of LUAD patients. The work in this study broadens the horizon for clinical work about LUAD.
Ethics approval and consent to participate
Not applicable
Consent for publication
Not applicable
Availability of data and materials
The datasets analysed during the current study are available in the TCGA database and GEO database.
Authors’ contributions
The authors alone are responsible for the content and writing of the paper. Qihang Yuan and Jie Ren contributed to the design of the study, collection and interpretation of data, and drafting and revising the manuscript. Jiwei Liu and Aman Wang participated in the design of the study, collection of data and reviewed/edited the manuscript.
Supplemental Material
Download ()Acknowledgements
None.
Disclosure statement
No potential conflict of interest was reported by the author(s).
Supplemental material
Supplemental data for this article can be accessed here.
Additional information
Funding
Related Research Data
References
- Allemani C, Matsuda T, Di Carlo V, et al. Global surveillance of trends in cancer survival 2000-14 (CONCORD-3): analysis of individual records for 37 513 025 patients diagnosed with one of 18 cancers from 322 population-based registries in 71 countries. Lancet. 2018;391(10125):1023–1075.
- Herbst RS, Morgensztern D, Boshoff C. The biology and management of non-small cell lung cancer. Nature. 2018;553(7689):446–454.
- Jiang H, Xu S, Chen C. A ten-gene signature-based risk assessment model predicts the prognosis of lung adenocarcinoma. BMC Cancer. 2020;20(1):782.
- Li C, Long Q, Zhang D, et al. Identification of a four-gene panel predicting overall survival for lung adenocarcinoma. BMC Cancer. 2020;20(1):1198.
- D’Autréaux B, Toledano MB. ROS as signalling molecules: mechanisms that generate specificity in ROS homeostasis. Nat Rev Mol Cell Biol. 2007;8(10):813–824.
- Łuczaj W, Gęgotek A, Skrzydlewska E. Antioxidants and HNE in redox homeostasis. Free radical biology & medicine.. 2017;111: 87–101.
- Ray PD, Huang BW, Tsuji Y. Reactive oxygen species (ROS) homeostasis and redox regulation in cellular signaling. Cell Signal. 2012;24(5):981–990.
- Ursini F, Maiorino M, Forman HJ. Redox homeostasis: the Golden Mean of healthy living. Redox Biol. 2016;8:205–215.
- Lu GS, Li M, Xu CX, et al. APE1 stimulates EGFR-TKI resistance by activating Akt signaling through a redox-dependent mechanism in lung adenocarcinoma. Cell Death Dis. 2018;9(11):1111.
- Ma L, Chen T, Zhang X, et al. The m(6)A reader YTHDC2 inhibits lung adenocarcinoma tumorigenesis by suppressing SLC7A11-dependent antioxidant function. Redox Biol. 2021;38:101801.
- Mao Q, Wang L, Liang Y, et al. CYP3A5 suppresses metastasis of lung adenocarcinoma through ATOH8/Smad1 axis. Am J Cancer Res. 2020;10(10):3194–3211.
- Moloney JN, Cotter TG. ROS signalling in the biology of cancer. Semin Cell Dev Biol. 2018;80:50–64.
- Raza MH, Siraj S, Arshad A, et al. ROS-modulated therapeutic approaches in cancer treatment. J Cancer Res Clin Oncol. 2017;143(9):1789–1809.
- Sies H, Jones DP. Reactive oxygen species (ROS) as pleiotropic physiological signalling agents. Nat Rev Mol Cell Biol. 2020;21(7):363–383.
- Sosa V, Moliné T, Somoza R, et al. Oxidative stress and cancer: an overview. Ageing Res Rev. 2013;12(1):376–390.
- Zhang X, Hong R, Chen W, et al. The role of long noncoding RNA in major human disease. Bioorganic chemistry.. 2019;92: 103214.
- Leisegang MS, Schröder K, Brandes RP. Redox regulation and noncoding RNAs. Antioxid Redox Signal. 2018;29(9):793–812.
- Cao M, Cai J, Yuan Y, et al. A four-gene signature-derived risk score for glioblastoma: prospects for prognostic and response predictive analyses. Cancer Biol Med. 2019;16(3):595–605.
- Li Y, Gu J, Xu F, et al. Transcriptomic and functional network features of lung squamous cell carcinoma through integrative analysis of GEO and TCGA data. Sci Rep. 2018;8(1):15834.
- Zhang M, Sun L, Ru Y, et al. A risk score system based on DNA methylation levels and a nomogram survival model for lung squamous cell carcinoma. Int J Mol Med. 2020;46(1):252–264.
- Schober P, Boer C, Schwarte LA. Correlation coefficients: appropriate use and interpretation. Anesth Analg. 2018;126(5):1763–1768.
- Liu JH, Xu YM, An YJ. 11-lncRNA risk scoring model predicts prognosis of lung squamous cell carcinoma. Eur Rev Med Pharmacol Sci. 2020;24(10):5456–5464.
- Xiong Y, Yuan L, Xiong J, et al. An outcome model for human bladder cancer: a comprehensive study based on weighted gene co-expression network analysis. J Cell Mol Med. 2020;24(3):2342–2355.
- Qiu J, Sun M, Wang Y, et al. Identification and validation of an individualized autophagy-clinical prognostic index in gastric cancer patients. Cancer cell international.. 2020;20(1):178.
- Hu B, Yang XB, Sang XT. Construction of a lipid metabolism-related and immune-associated prognostic signature for hepatocellular carcinoma. Cancer Med. 2020;9(20):7646–7662.
- Li W, Liu J, Zhao H. Identification of a nomogram based on long non-coding RNA to improve prognosis prediction of esophageal squamous cell carcinoma. Aging (Albany NY). 2020;12(2):1512–1526.
- Sun Z, Jing C, Xiao C, et al. Long non-coding RNA profile study identifies an immune-related lncRNA prognostic signature for kidney renal clear cell carcinoma. Front Oncol. 2020;10:1430.
- Tu Z, Wu L, Wang P, et al. N6-methylandenosine-related lncRNAs are potential biomarkers for predicting the overall survival of lower-grade glioma patients. Front Cell Develop Biol. 2020;8:642.
- Obuchowski NA, Bullen JA. Receiver operating characteristic (ROC) curves: review of methods with applications in diagnostic medicine. Phys Med Biol. 2018;63(7):07tr1.
- Qi-Dong X, Yang X, Lu JL, et al. Development and validation of a nine-redox-related long noncoding RNA Signature in renal clear cell carcinoma. Oxid Med Cell Longevity. 2020;2020:6634247.
- Guo D, Wang M, Shen Z, et al. A new immune signature for survival prediction and immune checkpoint molecules in lung adenocarcinoma. J Transl Med. 2020;18(1):123.
- Zhang Y, Zhang X, Lv X, et al. Development and validation of a seven-gene signature for predicting the prognosis of lung adenocarcinoma. Biol Med Res Int. 2020;2020:1836542.
- Zhu J, Wang M, Hu D. Development of an autophagy-related gene prognostic signature in lung adenocarcinoma and lung squamous cell carcinoma. PeerJ 2020;8:e8288.
- Liu GM, Zeng HD, Zhang CY, et al. Identification of a six-gene signature predicting overall survival for hepatocellular carcinoma. Cancer cell international. 2019;19(1):138.
- Jiang Y, Gou X, Wei Z, et al. Bioinformatics profiling integrating a three immune-related long non-coding RNA signature as a prognostic model for clear cell renal cell carcinoma. Cancer cell international.. 2020;20(1):166.
- Li T, Fu J, Zeng Z, et al. TIMER2.0 for analysis of tumor-infiltrating immune cells. Nucleic Acids Res. 2020;48(W1):W509–w14.
- Zhang J, Zhang J, Yuan C, et al. Establishment of the prognostic index reflecting tumor immune microenvironment of lung adenocarcinoma based on metabolism-related genes. J Cancer. 2020;11(24):7101–7115.
- Wang J, Kong PF, Wang HY, et al. Identification of a gene-related risk signature in melanoma patients using bioinformatic profiling. J Oncol. 2020;2020:7526204.
- Liang JY, Wang DS, Lin HC, et al. A novel ferroptosis-related gene signature for overall survival prediction in patients with hepatocellular carcinoma. Int J Biol Sci. 2020;16(13):2430–2441.
- Siegel RL, Miller KD, Jemal A. Cancer statistics, 2019. CA Cancer J Clin. 2019;69(1):7–34.
- Allemani C, Weir HK, Carreira H, et al. Global surveillance of cancer survival 1995-2009: analysis of individual data for 25,676,887 patients from 279 population-based registries in 67 countries (CONCORD-2). Lancet. 2015;385(9972):977–1010.
- Zhang Y, Wang DC, Shi L, et al. Genome analyses identify the genetic modification of lung cancer subtypes. Semin Cancer Biol. 2017;42:20–30.
- Loewen G, Jayawickramarajah J, Zhuo Y, et al. Functions of lncRNA HOTAIR in lung cancer. J Hematol Oncol. 2014;7(1):90.
- Zhang YX, Yuan J, Gao ZM, et al. LncRNA TUC338 promotes invasion of lung cancer by activating MAPK pathway. Eur Rev Med Pharmacol Sci. 2018;22(2):443–449.
- Feng C, Zhao Y, Li Y, et al. LncRNA MALAT1 promotes lung cancer proliferation and gefitinib resistance by acting as a miR-200a sponge. Arch Bronconeumol. 2019;55(12):627–633.
- Galamb O, Barták BK, Kalmár A, et al. Diagnostic and prognostic potential of tissue and circulating long non-coding RNAs in colorectal tumors. World J Gastroenterol. 2019;25(34):5026–5048.
- Tang D, Zhao L, Peng C, et al. LncRNA CRNDE promotes hepatocellular carcinoma progression by upregulating SIX1 through modulating miR-337-3p. J Cell Biochem. 2019;120(9):16128–16142.
- Wang G, Pan J, Zhang L, et al. Long non-coding RNA CRNDE sponges miR-384 to promote proliferation and metastasis of pancreatic cancer cells through upregulating IRS1. Cell Prolif. 2017;50(6):6.
- Zhu L, Yang N, Du G, et al. LncRNA CRNDE promotes the epithelial-mesenchymal transition of hepatocellular carcinoma cells via enhancing the Wnt/β-catenin signaling pathway. J Cell Biochem. 2018;120(2):1156–1164.
- Lin C, Xiang Y, Sheng J, et al. Long non-coding RNA CRNDE promotes malignant progression of hepatocellular carcinoma through the miR-33a-5p/CDK6 axis. J Physiol Biochem. 2020;76(3):469–481.
- Liu C, Hou J, Shan F, et al. Long non-coding RNA CRNDE promotes colorectal carcinoma cell progression and paclitaxel resistance by regulating miR-126-5p/ATAD2 axis. Onco Targets Ther. 2020;13:4931–4942.
- Zhang F, Wang H, Yu J, et al. LncRNA CRNDE attenuates chemoresistance in gastric cancer via SRSF6-regulated alternative splicing of PICALM. Mol Cancer. 2021;20(1):6.
- Wang B, Xu W, Cai Y, et al. CASC15: A tumor-associated long non-coding RNA. Curr Pharm Des. 2021;27(1):127–134.
- Xue MY, Cao HX. Long non-coding RNA CASC15 promotes nasopharyngeal carcinoma cell proliferation and metastasis by downregulating miR-101-3p. Eur Rev Med Pharmacol Sci. 2019;23(20):8897–8904.
- Zhang YN, Liu B, Jiang T, et al. Long non-coding RNA CASC15 promotes proliferation and induces apoptosis of cervical cancer cells through targeting miR-101-3p. Eur Rev Med Pharmacol Sci. 2020;24(2):611–618.
- Yu X, Wang ZL, Han CL, et al. LncRNA CASC15 functions as an oncogene by sponging miR-130b-3p in bladder cancer. Eur Rev Med Pharmacol Sci. 2019;23(22):9814–9820.
- Yu DJ, Zhong M, Wang WL. Long noncoding RNA CASC15 is upregulated in non-small cell lung cancer and facilitates cell proliferation and metastasis via targeting miR-130b-3p. Eur Rev Med Pharmacol Sci. 2019;23(18):7943–7949.
- Tani H, Numajiri A, Aoki M, et al. Short-lived long noncoding RNAs as surrogate indicators for chemical stress in HepG2 cells and their degradation by nuclear RNases. Sci Rep. 2019;9(1):20299.
- Cheng Y, Wang X, Qi P, et al. Tumor microenvironmental competitive endogenous RNA network and immune cells act as robust prognostic predictor of acute myeloid leukemia. Front Oncol. 2021;11:584884.
- Alvarez-Dominguez C, Calderón-Gonzalez R, Terán-Navarro H, et al. Dendritic cell therapy in melanoma. Ann Transl Med. 2017;5(19):386.
- Mitchell D, Chintala S, Dey M. Plasmacytoid dendritic cell in immunity and cancer. J Neuroimmunol. 2018;322:63–73.
- Bing X, Xuelei L, Wanwei D, et al. EGCG maintains Th1/Th2 balance and mitigates ulcerative colitis induced by dextran sulfate sodium through TLR4/MyD88/NF-κB signaling pathway in rats. Can J Gastroenterol Hepatol. 2017;2017:3057268.
- Lin W, Niu Z, Zhang H, et al. Imbalance of Th1/Th2 and Th17/Treg during the development of uterine cervical cancer. Int J Clin Exp Pathol. 2019;12(9):3604–3612.
- Keir ME, Butte MJ, Freeman GJ, et al. PD-1 and its ligands in tolerance and immunity. Annual review of immunology.. 2008;26(1):677–704.
- Leach DR, Krummel MF, Allison JP. Enhancement of antitumor immunity by CTLA-4 blockade. Science. 2017;2017(5256):1–9.
- Freud AG, Mundy-Bosse BL, Yu J, et al. The broad spectrum of human natural killer cell diversity. Immunity. 2017;47(5):820–833.
- Lupo KB, Matosevic S. Natural killer cells as allogeneic effectors in adoptive cancer immunotherapy. Cancers 2019;11:6.
- Crotty S. T follicular helper cell differentiation, function, and roles in disease. Immunity. 2014;41(4):529–542.
- Gu-Trantien C, Loi S, Garaud S, et al. CD4⁺ follicular helper T cell infiltration predicts breast cancer survival. J Clin Invest. 2013;123(7):2873–2892.