
ABSTRACT
During the pandemic of the coronavirus disease 2019, there exist quite a few studies on angiotensin-converting enzyme 2 (ACE2) and SARS-CoV-2 infection, while little is known about ACE2 in hepatocellular carcinoma (HCC). The detailed mechanism among ACE2 and HCC still remains unclear, which needs to be further investigated. In the current study with a total of 6,926 samples, ACE2 expression was downregulated in HCC compared with non-HCC samples (standardized mean difference = −0.41). With the area under the curve of summary receiver operating characteristic = 0.82, ACE2 expression showed a better ability to differentiate HCC from non-HCC. The mRNA expression of ACE2 was related to the age, alpha-fetoprotein levels and cirrhosis of HCC patients, and it was identified as a protected factor for HCC patients via Kaplan–Meier survival, Cox regression analyses. The potential molecular mechanism of ACE2 may be relevant to catabolic and cell division. In all, decreasing ACE2 expression can be seen in HCC, and its protective role for HCC patients and underlying mechanisms were explored in the study.
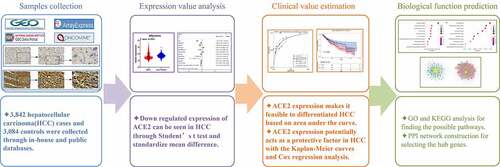
Graphical Abtstract
KEYWORDS:
Introduction
Cancer is a serious worldwide public health threat. During the pandemic of the coronavirus disease 2019 (COVID-19), cancer patients are reported to be easier to infect SARS-CoV-2 and have a higher risk of severe events[Citation1]. Taking the United States as an example, liver cancer mortality ranks fourth among males and seventh among females, with a five-year relative survival rates of only 20%[Citation2]. Recent reports have demonstrated that especially in females, the incidence is still increasing by 2% per year while it has been temporarily steady in males[Citation2]. Hepatocellular carcinoma (HCC) is the major subtype of liver cancer [Citation3,Citation4] with complex pathogenesis. In the United States nationally, the recent and ongoing hepatitis C virus (HCV) epidemic poses a threat to the prevention of liver cancer [Citation2], while hepatitis B virus (HBV) infection [Citation4], obesity, excessive alcohol consumption [Citation2], and intake of aflatoxin [Citation5] are also recognized as risk factors for HCC. As for molecular events, multiple studies have confirmed that the abnormal expression of oncogenes plays an important part in the progression of HCC [Citation6–8]. Thus, the mechanism of the occurrence and development of HCC are intricate and in urgent need of clarification.
With the SARS-CoV-2 (COVID-19) pandemic, the COVID-19-related angiotensin-converting enzyme 2 (ACE2) has attracted worldwide attention because it is a major receptor that allows the virus to enter human cells[Citation9], while few reports about ACE2 expression and its value in HCC can be seen. ACE2, which belongs to the renin-angiotensin-aldosterone system (RAAS), is the homolog of angiotensin-converting enzyme (ACE) [Citation10,Citation11]. As the antagonist of Angiotensin II (Ang II), ACE2 converts Ang II into Ang (1–7) and meditates vasodilator, anti-inflammatory, anti-fibrosis, anti-apoptosis, and anti-proliferation processes [Citation12–14]. ACE2 exists in vascular endothelial cells and smooth muscle cells of all organs [Citation15], as well as in tissues rich in glucose, such as liver and adipose tissue[Citation13]. Interestingly, in the digestive and respiratory tracts, ACE2 expression was found to be almost restrained in epithelial cells, whether in normal or malignant tissues[Citation16]. In tumors, the ACE2 is considered to be a protective factor against tumorigenesis; the up-regulation of ACE2 indicates a good prognosis in multiple cancers and is inversely associated with some crucial pathways of tumor progress, such as proliferation and mismatch repair[Citation17]. Studies have shown that in HCC, ACE2 could serve as a protective factor and its expression was reduced in HCC patients [Citation18–20], and also might improve the survival of patients without vascular invasionCitation[18]; however, some limitations could be seen in these reports, such as small sample size and a lack of validation with in-house clinical samples. Furthermore, little integrated computational analysis based on samples from diverse sources can be seen, where the potential clinical value and molecular mechanism of ACE2 in HCC were explored.
From the preparatory work, we reasonably assumed that low ACE2 expression has a closely relation with HCC development. Based on in-house immunohistochemistry (IHC), tissue microarrays and high-throughput datasets from multiple public databases, the current study aims to investigate expression level, clinical values and potential mechanisms of ACE2 in HCC, which may contribute to clinical management of HCC and understanding of the pathogenesis of this disease.
Materials and methods
The clinical value of ACE2 expression in HCC tissues
Protein and mRNA expression of ACE2 in HCC
IHC with in-house samples
The current work was approved by the institutional review board of the First Affiliated Hospital of Guangxi Medical University (No. 2019-KY-Guoji-113). All experiments were conducted according to applicable rules, and informed consent was obtained from all patients. IHC was applied to analyze the protein expression of ACE2. A total of 55 HCC and 71 non-tumor liver samples was included, while 47 HCC and 63 non-tumor liver cases were obtained from Pantomics Company’s tissue array (TMA No. LVC1601, Guilin, P.R. China) and eight pairs of HCC and corresponding nonmalignant counterparts were collected from the First Affiliated Hospital of Guangxi Medical University.
The formalin-immobilized and embedded samples went through a dehydration process, and then endogenous peroxidases were inhibited and the antigen was exposed. A two-step IHC technique was applied. Anti-ACE2 antibody (ab, rabbit polyclonal to ACE2, Abcam) was used as the first antibody in the experimental group, and phosphate-buffered saline (PBS) was used as a comparison taking the place of the first antibody. Both were incubated overnight at 37°C. Then, the second antibody was added to the samples at 25°C, which was incubated for half an hour. After hematoxylin staining, two pathologists, respectively, evaluated the staining intensity and the percentage of stained positive cells. The score of ACE2 protein expression was the product of staining strength score and score of percentage of positive stained cells, as we previously reported [Citation21].
Collection of the public datasets
Using the search terms ‘hepatocellular carcinoma’ and ‘HCC’, the Gene Expression Omnibus, ArrayExpress [Citation22], Sequence Read Archive, Oncomine, The Cancer Genome Atlas (TCGA), and PubMed databases were searched for high-throughput datasets. In this study, each dataset was considered for further analyzed only when it met the following inclusion criteria: 1) Homo sapiens-related studies; 2) containing both HCC and non-HCC samples; 3) including ACE2 mRNA expression data. Exclusion criteria were as follows: 1) the sample number of HCC or non-HCC <3; 2) containing duplicate or unavailable data. The Genotype-Tissue Expression (GTEx) project was also used to expand normal samples and was combined with TCGA.
Log2(X+1) transformation (X means the raw data of gene expression) was undertaken for gene levels of the public datasets. Microarrays from Gene Expression Omnibus with the same platform, such as ‘Affymetrix’, were combined for further analysis. For combined microarrays, the batch effect was eliminated through surrogate variable analysis [Citation23] package in R (v 4.02), and ACE2 expression was finally measured on the basis of the above datasets.
ACE2 expression in HCC and non-HCC samples
To obtain a stronger result, in-house IHC and high-throughput datasets were combined in order to increase the number of cases. Computed with Stata 15.0 (StataCorp LLC, College Station, TX, USA), the standardized mean difference (SMD) and summary receiver operating characteristic (SROC) were the two major indices used to measure the expression and discriminating ability of ACE2 in HCC. The model selected was dependent on the I2 value of I2 test, and random effect model was chosen when I2 > 50%, as it indicates significant heterogeneity. Moreover, jitter plots and receiver operating characteristic (ROC) curves were drawn with GraphPad Prism 8. Finally, the Egger’s diagram and Deek’s funnel plot were applied to measure publication bias.
Clinical value and prognosis prediction ability of ACE2 in HCC
Clinical parameters, containing gender, age, vital status, Tumor Node Metastasis (TNM) stage, pathological stage, cirrhosis, alpha-fetoprotein (AFP) level, HBV infection, HCV infection, alcohol consumption, and vascular invasion, were collected from the IHC samples and TCGA database. For assessing the correlation between ACE2 and clinical features of HCC patients, student’s t test and analysis of variance was chosen to compare ACE2 expression between the subgroups of clinical features. p < 0.05 represented statistical significance.
In order to evaluate the prognostic capacity of ACE2, survival status, overall survival (OS), and recurrence-free survival (RFS) time were all collected from the above datasets. In a dataset, HCC patients were divided into two groups, those with less than median ACE2 expression level were classified to low-ACE2 expression group, while the remaining HCC patients were classified into the high-ACE2 expression group. Kaplan–Meier survival and univariate Cox regression analyses were then performed, while multivariate Cox regression analysis was based on clinical characteristic with a p < 0.05 in univariate Cox regression. Moreover, in the computation of the pooled hazard ratio (HR), which is essential for measuring the prognosis prediction capabilities of ACE2 expression, studies that met the above requirements with prognostic information were searched for and included.
Selection of ACE2-related upregulated expression genes (UEGs) and downregulated expression genes (DEGs)
To screen the genes that were closely associated with the mechanism of ACE2 expression in HCC, Pearson’s correlation analysis was performed based on the datasets above. Genes with both absolute value of Pearson’s correlation coefficient ≥ 0.3 and p < 0.05 were identified as ACE2-related genes. UEGs were selected through the threshold Log2 fold change >1 and p<0.05 (based on the limma package [Citation24] in R) and the 95% confidence interval of SMD without zero; while DEGs were those with the threshold Log2 fold change <1 and p<0.05 and the 95% confidence interval of SMD without zero. ACE2-related UEGs were the intersection of ACE2-related genes (those with Pearson’s correlation coefficient ≥0.3) and UEGs, while ACE2-related DEGs were the intersection of ACE2-related genes (those with Pearson’s correlation coefficient <−0.3) and DEGs.
Potential mechanism analysis of ACE2 in HCC
Based on ACE2-related UEGs and DEGs, Gene Ontology (GO) annotation and the Kyoto Encyclopedia of Genes and Genomes (KEGG) were applied to assess the possible items and pathways in which ACE2 might involve. Protein–protein interaction (PPI) networks were exploited through The Search Tool for the Retrieval of Interacting Genes database, and then the hub genes of ACE2-related UEGs and DEGs were screened in the cytoHubba plugin in Cytoscape (v3.5.0) with the highest degree centrality. The subnetwork of PPI consisted of some ACE2-related DEGs, where ACE2 involved, was selected for further exploring the molecular functions (in GO analysis) of ACE2 in HCC.
Results
The short summary of the results
Little was known about the important role of ACE2 in HCC, which was exploited in the study. Both mRNA and protein levels of ACE2 were significantly lower in HCC based on 6,926 samples. ACE2 expression made it feasible to differentiate HCC via AUC. The mRNA expression of ACE2 was related to some clinical parameters of the HCC patients, containing age, AFP level and cirrhosis. High-ACE2 expression is found to be associated with the considerable prognoses of HCC patients. Chemical carcinogenesis and the cell cycle were potential pathways that ACE2 involved in HCC.
Expression and clinical value of ACE2 in HCC
ACE2 protein expression with in-house samples
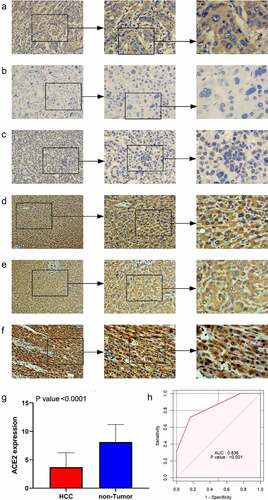
ACE2 expression in HCC samples was manifestly downregulated compared with non-tumor cases (), and the positive of stained signaling of ACE2 can mainly be seen in the cytoplasm of HCC cells rather than non-HCC hepatocytes. The area under the curve (AUC) of downregulated ACE2 expression to identify HCC was 0.836, indicating the considerable ability of ACE2 expression to distinguish HCC from non-HCC tissues.
Figure 1. The expression level of ACE2 protein in hepatocellular carcinoma (HCC) and non-tumor liver tissues based on immunohistochemistry. Panels a-c: representative images of ACE2 protein expression in HCC tissues. Panels d-f: representative images of ACE2 protein expression in non-tumor normal liver tissues. In panels a-f, the magnifications of the three images of each panel are 100, 200, and 400 respectively. Panel g: ACE2 protein expression. Panel h: receiver operating characteristic (ROC) curve with area under the curve (AUC) of ACE2 protein expression in HCC tissues
Integrative analysis of ACE2 mRNA expression in HCC and non-HCC samples
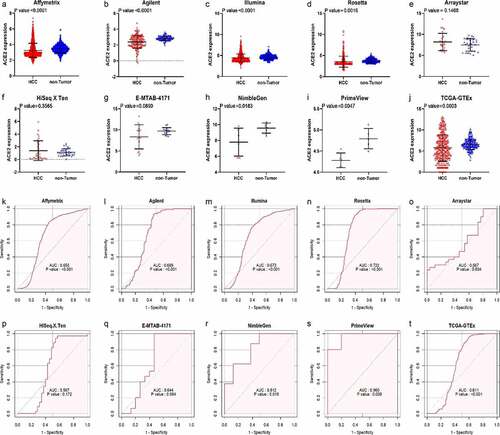
After in-house IHC and high-throughput datasets were combined, a total of 3,842 HCC cases and 3,084 controls were involved in the comprehensive analysis of ACE2 expression in HCC. shows the recruitment procedure for the high-throughput datasets; details about the 10 high-throughput datasets and results from IHC is shown in . From the jitter plots (–j)) and , except for Arraystar, HiSeq X Ten, and E-MTAB-4171, the majority of the studies included showed downregulated expression of ACE2 in HCC with p < 0.05. As for ROC curves (–t)), seven of ten mRNA datasets all showed AUC > 0.6 (p < 0.05).
Table 1. Details of IHC result and the 10 high-throughput datasets from public databases with corresponding ACE2 expression level, AUC of the ROC curve, sensitivity and specificity of ACE2 in HCC
Figure 2. The flow chart of the recruitment procedure for the high-throughput datasets
Figure 3. Jitter plots and receiver operating characteristic (ROC) curves of all high-throughput datasets from public databases. Panels a–j the jitter plots of the 10 datasets. Panels k–t: receiver operating characteristic (ROC) curves of the 10 mRNA datasets
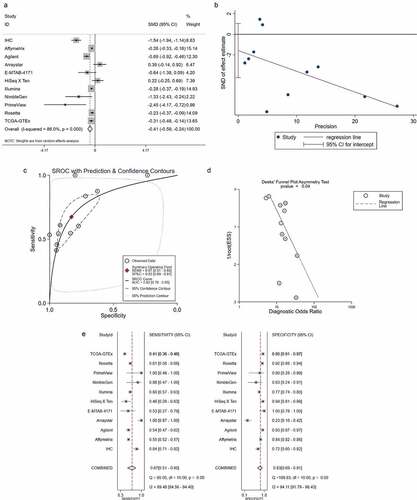
The total SMD displayed by the forest plot was −0.41 (95% confidence interval: −0.59 to −0.24), which further verified the reduced expression of ACE2 in HCC ()). Little publication bias of the SMD was found based on the Egger’s analysis (p = 0.208, )).
Figure 4. Integrated analysis of the 10 high-throughput datasets and in-house immunohistochemistry (IHC). Panel a: forest plot. Panel b: Egger diagram. Panel c: summary receiver operating characteristic (SROC) curve. Panel d: Deek’s funnel plot, Panel e: chart of the sensitivity and specificity
Clinical values of ACE2 in the progression of HCC
The AUC of the SROC was 0.82 (95% confidence interval: 0.78 to 0.85) and indicated favorable distinguishing ability (–d)). The combined sensitivity and specificity are shown in ) and were 0.67 and 0.83, respectively.
Although no clinical features appeared statistically significant, Node stage with p = 0.058 might be considered a related factor to ACE2 protein expression with in-house IHC analysis (data not shown), which should be further verified in the future.
Based on TCGA dataset (), cases with higher age (≥60 years old) and cirrhosis possessed higher ACE2 mRNA expression, while those with poorer vital status – dead, and higher AFP levels (≥400 μg/L) had lower ACE2 mRNA expression. Accordingly, positive relationships appeared between ACE2 expression level and age (r [Pearson’s correlation coefficient] = 0.148, p = 0.004) and cirrhosis (r = 0.186, p = 0.006), while negative relationships can be seen between ACE2 expression value and vital status (r = −0.110, p = 0.035) and AFP content (r = −0.177, p = 0.03).
Table 2. Clinical value of ACE2 mRNA expression in HCC based on RNA-sequencing data
Prognosis prediction ability of ACE2 in HCC
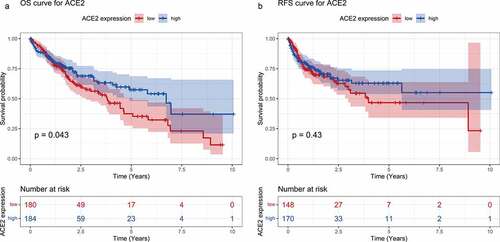
As shown in ), higher ACE2 expression predicted better prognosis on overall survival OS time with p = 0.043, while recurrence-free survival (RFS) time appeared to have no statistical significance. The total HRs of OS and RFS were 0.80 and 0.84, respectively. Although no significant difference of HR has been found (95% confidence level includes one), a trend can be seen that ACE2 expression could potentially act as a protective indicator for the survival status of HCC (data not shown). As a result, the prognostic role of ACE2 needs to be verified with larger numbers of cases and cohorts.
Figure 5. Survival curves for high- and low-ACE2 expression based of the dataset from The Cancer Genome Atlas. Panel a: overall survival (OS) curve of hepatocellular carcinoma patients. Panel b: recurrence-free survival (RFS) curve of hepatocellular carcinoma patients
According to the result of the Cox regression analysis shown in , ACE2 mRNA expression and HBV infection were the independent influential factors of prognosis for HCC patients based on TCGA RNA-sequencing data.
Table 3. Univariate Cox regression and multivariate Cox regression analyses based on the RNA- sequencing data
Screening of the ACE-2 related DEGs and UEGs and their biological functional analyses of ACE2 in HCC
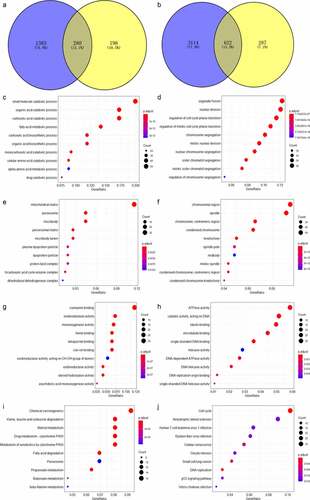
A total of 280 genes were identified as the ACE2-related DEGs ()), while 622 genes were selected as ACE2-related UEGs ()). The 280 ACE2-related DEGs were mostly enriched in small molecule catabolic process, mitochondrial matrix, and coenzyme binding in aspects of biological process, cellular component, and molecular function based on GO enrichment analysis. The 622 ACE2-related UEGs were significantly enriched in the gene annotations of organelle fission, chromosomal region, and ATPase activity (–h)). As for KEGG, chemical carcinogenesis and the cell cycle were the two pathways enriched separately by the ACE2-related UEGs and DEGs (–j)).
Figure 6. Venn plot showing the result of the two intersections and the result of the Gene Ontology (GO) and Kyoto Encyclopedia of Genes and Genomes (KEGG) analysis visualized by dot plots. The color of the dot represents the p value of each enriched item, and the size of the dot reflects the genes enriched to the corresponding items. Panel a: selection of ACE2-related downregulated genes. Panel b: selection of ACE2-related upregulated genes. Biological processes (panels c–d), cellular compartments (panels e–f) and molecular functions (panel g) of GO analysis based on ACE2-related downregulated genes. Panel h: molecular function of GO analysis based on ACE2-related upregulated genes. Panel i: KEGG analysis based on ACE2-related downregulated genes. Panel j: KEGG analysis based on ACE2-related upregulated genes
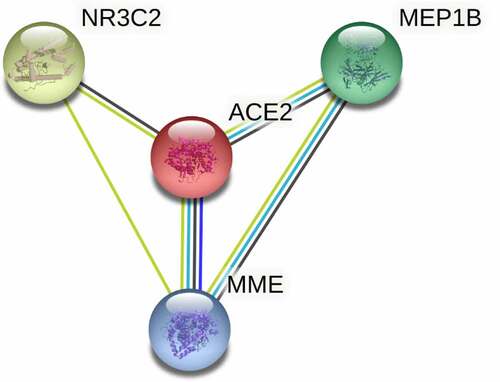
In PPI network () analysis, the hub gene CYP3A4 was selected from ACE2-related DEGs due to its highest degree centrality, while the hub gene of ACE2-related UEGs was CDC20. Low-CYP3A4 expression and high-CDC20 expression could be seen in HCC cases ()), and both of the two hub genes were correlated with ACE2 expression ()) and prognoses of HCC patients (p < 0.05, )). According to the GO and KEGG analysis, CYP3A4 was enriched to the following 13 predicted items: fatty acid metabolic process, carboxylic acid biosynthetic process, organic acid biosynthetic process, drug catabolic process, monooxygenase activity, oxidoreductase activity, steroid hydroxylase activity, heme binding, tetrapyrrole binding, iron ion binding, chemical carcinogenesis, retinol metabolism, drug metabolism – cytochrome P450 and metabolism of xenobiotics by cytochrome P450, while CDC20 was enriched to the predicted 10 items below: nuclear division, organelle fission, mitotic nuclear division, mitotic sister chromatid segregation, chromosome segregation, regulation of cell cycle phase transition, spindle, cell cycle, Human T-cell leukemia virus 1 infection and oocyte meiosis. Furthermore, the subnetwork () where ACE2 involved consisted of four ACE2-related DEGs – ACE2, NR3C2, MME, and MEP1B. The GO analysis of the four ACE2-related DEGs showed that, ACE2, MME, and MEP1B clustered in metallopeptidase activity molecular function (data not shown).
Figure 7. Protein-protein interaction (PPI) network construction of ACE2-related upregulated genes and regulated genes. Panel a: PPI of 280 total down-regulated ACE2-related genes. Panel b: PPI of 622 total up-regulated ACE2 related genes. Larger dot size represents greater degree centrality, and the genes in yellow are the hub genes
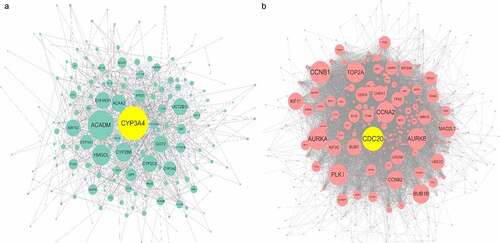
Figure 8. Expression, correlation, and survival analysis of CYP3A4 and CDC20 expression. Panel a: the jitter plot of CYP3A4 expression. Panel b: correlation analysis of CYP3A4 and ACE2 expression. Panel c: overall survival curve of CYP3A4 expression in hepatocellular carcinoma (HCC). Panel d: the jitter plot of CDC20 expression. Panel e: correlation analysis of CDC20 and ACE2 expression. Panel f: overall survival curve of CDC20 in HCC
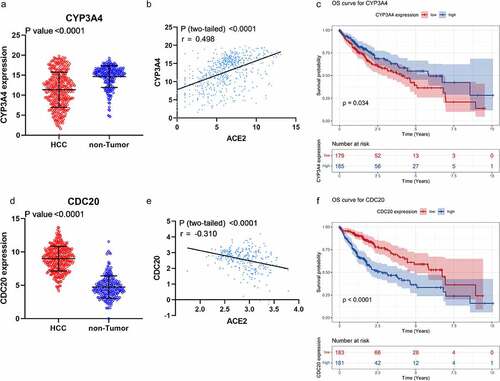
Figure 9. The subnetwork of protein–protein interaction network construction of ACE2-related upregulated genes and downregulated genes
Discussion
As the homolog of angiotensin-converting enzyme, ACE2 is closely related to COVID-19, but little is known about its important part in HCC. Based on 6,926 samples and various statistical methods, we found that both mRNA and protein levels of ACE2 were significantly lower in HCC. ACE2 expression made it feasible to differentiate HCC, which has not been reported in previous studies. The mRNA expression of ACE2 was related to some clinical parameters – age, AFP level and cirrhosis – of the HCC patients, it was also found to be associated with the prognoses of HCC patients, where the potential clinical value of ACE2 expression could be seen. Furthermore, we analyzed the potential molecular mechanism of ACE2 expression in HCC through the ACE2-related UEGs and DEGs. In a word, the study reveals the lower expression of ACE2 and its potential clinical value in HCC, improving the understanding of its prospective molecular mechanism in HCC.
Low-ACE2 expression in HCC is obvious. Furthermore, a number of studies have reported the down-regulated expression of ACE2 in various tumors such as breast tumors [Citation25], non-small cell lung cancer [Citation26], pancreatic ductal adenocarcinoma [Citation27], and gallbladder cancer[Citation28]. Reduced expression of ACE2 was also previously reported in HCC [Citation18–20]; however, there exist some limitations in these reports, such as small sample size (n < 500), little data sources and lack of multilevel research. Our study further, based on 6,926 samples from multiple research centers and several statistical methods, reveals significant low-ACE2 expression in HCC at both the mRNA and protein levels.
Downregulated expression of ACE2 show quite a few clinical values in HCC. Through ACE2 expression, HCC patients were likely distinguished from non-HCC patients, indicating its ability to differentiate HCC, which has not been reported before. The mRNA expression of ACE2 was related to some clinical parameters of the HCC patients, containing age, AFP level and cirrhosis. An impressive finding is that the higher the ACE2 expression, the lower AFP level, suggesting their negative correlation. Interestingly, AFP is a crucial oncogenic biomarker for HCC, indicating the potential protective role of ACE2 in HCC. This trend was supported by the OS curve, while ACE2 expression was further considered a protective and independent prognostic factor for the prognosis of HCC patients via multivariate Cox regression analysis. Thus, the important clinical value of ACE2 in HCC may include the identification of HCC and its protective effect on HCC patients.
Reduced expression of ACE2 may take part in tumorigenesis. A report demonstrated that in lung, breast, colon, and pancreatic cancers, ACE2 was considered an inhibitor of growth, metastasis, and angiogenesis of tumor cells [Citation11]. In breast tumors, the down-regulation of ACE2 contributes to the invasion and metastasis of breast cancer cells through the store-operated calcium entry (SOCE) and PAK1/NF- κB/Snail1 pathways[Citation14]. In lung cancer, the up-regulation of ACE2 was considered an inhibitor of cancer progression [Citation26], while its down-regulation was associated with poor prognosis [Citation29]. It can be seen that the down-regulation of ACE2 plays an important role in tumorigenesis. As a member of the renin-angiotensin-aldosterone system, ACE2 was reported to be associated with CD34 expression, VEGF, and the Notch signal pathway, thus participating in angiogenesis in HCC[Citation19]. Based on GO and KEGG analyses, we found that ACE2-related UEGs and DEGs were mostly enriched in catabolic and cell division processes, which were both essential processes for carcinogenesis. The possibility of HCC progression due to ACE2 gene mutation was also considered, but few alterations were found in the mutation spectrum. In conclusion, ACE2 may be a cancer-related gene involved in the development and progress of HCC.
Through the PPI network, CYP3A4 and CDC20 were the two hub genes selected with the highest degree centrality and were associated with the prognosis of HCC patients. CYP3A4 belongs to cytochrome P450 and participates in the metabolic activation of procarcinogens[Citation30]. In HCC, the downregulation of CYP3A4 was regarded as an independent predictor for early recurrence and a suppressor associated with poor prognosis [Citation31,Citation32]. A previous study by our team showed that CYP3A4 could facilitate the transformation of aflatoxin B1 to AFB1-exo-8,9-epoxide, therefore participating in the tumorigenesis of HCC[Citation33]. In GO and KEGG analysis, CYP3A4 was enriched to some carcinogenesis process like fatty acid metabolic process, monooxygenase activity, oxidoreductase activity and chemical carcinogenesis, which indicated the carcinogenic effect of CYP3A4 in HCC. Participating in the HIF-1 pathway and influencing the secretion of VEGF, CDC20 also played an important role in HCC progression[Citation34]. Besides, GO and KEGG analysis also showed that CDC20 might be involved in nuclear division and chromosome segregation which were largely correlated with carcinogenesis. In conclusion, CYP3A4 and CDC20 were closely associated with HCC development as the ACE2-related genes in HCC. However, few studies had reported the relation between ACE2 and CYP3A4 in HCC, and that might be a direction worthy of further study.
ACE2 playing roles in HCC might be relevant to its classical molecular function – metallopeptidase activity. The expression of matrix metalloproteinase (MMP) 2 and MMP9 is closely related to different types of tumor metastasis. Non-small cell lung cancer cells have decreased invasion ability due to the inhibition of the expression of these two genes by ACE2, which reveals that ACE2 as a zinc metalloprotease plays an important inhibitory role in cancer cells[Citation35]. In our research, ACE2 and the three ACE2-related genes – NR3C2, MME, and MEP1B – in the PPI subnetwork clustered simultaneously in the metallopeptidase activity function, which suggests that metallopeptidase activity may be one of the mechanisms by which ACE2 plays a role in HCC. Regrettably, there is currently a lack of sufficient literature to prove this suppose, which is a direction worthy of experimental research.
There are some limitations in our study, such as insufficiency of samples for the prognosis analysis and the lack of in vitro experiments.
Conclusion
To sum up, we confirmed the downregulation of ACE2 in HCC and explored the potential clinical value and mechanisms of ACE2 expression in HCC. ACE2 expression was related to favorable prognosis, and it makes it feasible to distinguish HCC. Chemical carcinogenesis, catabolic process and the cell cycle were potential pathways that ACE2 involved in HCC, and this needs to be further explored.
Acknowledgements
We are very grateful to the anonymous reviewers for their serious work and thoughtful suggestions, which have greatly improved this article.
Disclosure statement
No potential conflict of interest was reported by the author(s).
Additional information
Funding
References
- Liang W, Guan W, Chen R, et al. Cancer patients in SARS-CoV-2 infection: a nationwide analysis in China. Lancet Oncol. 2020;21(3):335–337.
- Siegel RL, Miller KD, Fuchs HE, et al. Cancer Statistics, 2021. CA Cancer J Clin. 2021;71(1):7–33.
- Bray F, Ferlay J, Soerjomataram I, et al. Global cancer statistics 2018: GLOBOCAN estimates of incidence and mortality worldwide for 36 cancers in 185 countries. CA Cancer J Clin. 2018;68(6):394–424.
- Shi JF, Cao M, Wang Y, et al. Is it possible to halve the incidence of liver cancer in China by 2050? Int J Cancer. 2021;148(5):1051–1065.
- Rushing BR, Selim MI. Aflatoxin B1: a review on metabolism, toxicity, occurrence in food, occupational exposure, and detoxification methods. Food Chem Toxicol. 2019;124:81–100.
- Duan F, Wu H, Jia D, et al. O-GlcNAcylation of RACK1 promotes hepatocellular carcinogenesis. J Hepatol. 2018;68(6):1191–1202.
- Seehawer M, Heinzmann F, D’Artista L, et al. Necroptosis microenvironment directs lineage commitment in liver cancer. Nature. 2018;562(7725):69–75.
- Li Z, Zhang J, Liu X, et al. The LINC01138 drives malignancies via activating arginine methyltransferase 5 in hepatocellular carcinoma. Nat Commun. 2018;9(1):1572.
- Fan C, Lu W, Li K, et al. ACE2 Expression in Kidney and Testis May Cause Kidney and Testis Infection in COVID-19 Patients. Front Med (Lausanne). 2020;7:563893.
- Bourgonje AR, Abdulle AE, Timens W, et al. Angiotensin-converting enzyme 2 (ACE2), SARS-CoV-2 and the pathophysiology of coronavirus disease 2019 (COVID-19). J Pathol. 2020;251(3):228–248.
- Xu J, Fan J, Wu F, et al. The ACE2/Angiotensin-(1-7)/Mas Receptor Axis: pleiotropic Roles in Cancer. Front Physiol. 2017;8:276.
- Sanchis-Gomar F, Lavie CJ, Perez-Quilis C, et al. Angiotensin-Converting Enzyme 2 and Antihypertensives (Angiotensin Receptor Blockers and Angiotensin-Converting Enzyme Inhibitors) in Coronavirus Disease 2019. Mayo Clin Proc. 2020;95(6):1222–1230.
- Nair MG, Prabhu JS, Ts S. High expression of ACE2 in HER2 subtype of breast cancer is a marker of poor prognosis. Cancer Treat Res Commun. 2021;27:100321.
- Yu C, Tang W, Wang Y, et al. Downregulation of ACE2/Ang-(1-7)/Mas axis promotes breast cancer metastasis by enhancing store-operated calcium entry. Cancer Lett. 2016;376(2):268–277.
- Hamming I, Timens W, Bulthuis ML, et al. Tissue distribution of ACE2 protein, the functional receptor for SARS coronavirus. A first step in understanding SARS pathogenesis. J Pathol. 2004;203(2):631–637.
- Stewart CA, Gay CM, Ramkumar K, et al. SARS-CoV-2 infection induces EMT-like molecular changes, including ZEB1-mediated repression of the viral receptor ACE2, in lung cancer models. bioRxiv:Preprint Serv Biol. 2020.
- Zhang Z, Li L, Li M, et al. The SARS-CoV-2 host cell receptor ACE2 correlates positively with immunotherapy response and is a potential protective factor for cancer progression. Comput Struct Biotechnol J. 2020;18:2438–2444.
- Feng H, Wei X, Pang L, et al. Prognostic and Immunological Value of Angiotensin-Converting Enzyme 2 in Pan-Cancer. Front Mol Biosci. 2020;7:189.
- Ye G, Qin Y, Lu X, et al. The association of renin-angiotensin system genes with the progression of hepatocellular carcinoma. Biochem Biophys Res Commun. 2015;459(1):18–23.
- Dai YJ, Hu F, Li H, et al. A profiling analysis on the receptor ACE2 expression reveals the potential risk of different type of cancers vulnerable to SARS-CoV-2 infection. Ann Transl Med. 2020;8(7):481.
- Zhang L, Luo B, Dang YW, et al. The clinical significance of endothelin receptor type B in hepatocellular carcinoma and its potential molecular mechanism. Exp Mol Pathol. 2019;107:141–157.
- Athar A, Füllgrabe A, George N, et al. ArrayExpress update - from bulk to single-cell expression data. Nucleic Acids Res. 2019;47(D1):D711–d5.
- Leek JT, Storey JD. Capturing heterogeneity in gene expression studies by surrogate variable analysis. PLoS Genet. 2007;3(9):1724–1735.
- Ritchie ME, Phipson B, Wu D, et al. limma powers differential expression analyses for RNA-sequencing and microarray studies. Nucleic Acids Res. 2015;43(7):e47.
- Zhang Q, Lu S, Li T, et al. ACE2 inhibits breast cancer angiogenesis via suppressing the VEGFa/VEGFR2/ERK pathway. J Exp Clin Cancer Res. 2019;38(1):173.
- Feng Y, Wan H, Liu J, et al. The angiotensin-converting enzyme 2 in tumor growth and tumor-associated angiogenesis in non-small cell lung cancer. Oncol Rep. 2010;23(4):941–948.
- Zhou L, Zhang R, Yao W, et al. Decreased expression of angiotensin-converting enzyme 2 in pancreatic ductal adenocarcinoma is associated with tumor progression. Tohoku J Exp Med. 2009;217(2):123–131.
- Zong H, Yin B, Zhou H, et al. Loss of angiotensin-converting enzyme 2 promotes growth of gallbladder cancer. Tumour Biol. 2015;36(7):5171–5177.
- Qian YR, Guo Y, Wan HY, et al. Angiotensin-converting enzyme 2 attenuates the metastasis of non-small cell lung cancer through inhibition of epithelial-mesenchymal transition. Oncol Rep. 2013;29(6):2408–2414.
- Zhou J, Wen Q, Li SF, et al. Significant change of cytochrome P450s activities in patients with hepatocellular carcinoma. Oncotarget. 2016;7(31):50612–50623.
- Ashida R, Okamura Y, Ohshima K, et al. CYP3A4 Gene Is a Novel Biomarker for Predicting a Poor Prognosis in Hepatocellular Carcinoma. Cancer Genomics Proteomics. 2017;14(6):445–453.
- Ma X, Zhou L, Zheng S. Transcriptome analysis revealed key prognostic genes and microRNAs in hepatocellular carcinoma. PeerJ 2020;8:e8930.
- Pang YY, Li JD, Gao L, et al. The clinical value and potential molecular mechanism of the downregulation of MAOA in hepatocellular carcinoma tissues. Cancer Med. 2020;9(21):8004–8019.
- Shi M, Dai WQ, Jia RR, et al. APC(CDC20)-mediated degradation of PHD3 stabilizes HIF-1a and promotes tumorigenesis in hepatocellular carcinoma. Cancer Lett. 2021;496:144–155.
- Feng Y, Ni L, Wan H, et al. Overexpression of ACE2 produces antitumor effects via inhibition of angiogenesis and tumor cell invasion in vivo and in vitro. Oncol Rep. 2011;26(5):1157–1164.