
ABSTRACT
Warburg phenomenon refers to the development of unique metabolic patterns during the growth of tumor cells. This study stratified gastric cancer into prognostic metabolic subgroups according to changes in gene expressions related to glycolysis and cholesterol synthesis. The RNA-seq expression data, single nucleotide variants (SNV), short insertions and deletions (InDel) mutation data, copy number variation (CNV) data and clinical follow-up information data of gastric cancer tissues were downloaded from The Cancer Genome Atlas (TCGA) database. ConsensusClusterPlus was used to stratify the metabolic subtypes of gastric cancer. Four metabolic subtypes (Cholesterogenic, Glycolytic, Mixed and Quiescent) of gastric cancer were identified, and patients with cholesterogenic tumors had the longest disease-specific survival (DSS). Genome-wide analysis showed that aberrant amplification of TP53 and MYC in gastric cancer was associated with abnormal cholesterol anabolic metabolism. The mRNA levels of mitochondrial pyruvate carriers 1 and 2 (MPC1/2) differed among the four subtypes. Tumors in the glycolytic group showed a higher PDCD1. A genomic signature based on tumor metabolism of different cancer types was established. This study showed that genes related to glucose and lipid metabolism play an important role in gastric cancer and facilitate a personalized treatment of gastric cancer.
GRAPHICAL ABSTRACT
Introduction
Gastric cancer is the fifth most common malignant tumor, with the third highest mortality [Citation1]. Studies reported that the 5-year survival rate for patients with advanced gastric cancer is 5–20%, but that for those with early gastric cancer is as high as 85–100%, indicating the significance of an early diagnosis in reducing mortality and improving prognosis of gastric cancer [Citation2–5]. However, atypical and unobvious early symptoms of gastric cancer often lead to a late diagnosis of the cancer, which is often accompanied by liver metastasis and combined peritoneal metastasis [Citation6]. Therefore, it is necessary to better understand the mechanism of specific cellular tumor progression pathways in promoting the prognostic stratification of gastric cancer and developing personalized treatment for gastric cancer patients.
Otto Warburg reported that the glycolytic activity of liver cancer cells is significantly higher than that of normal liver cells, and indicated that aerobic glycolysis supports a rapid proliferation of tumor cells [Citation7]. Metabolic remodeling is a special metabolic mode of tumor cells, which is obviously different from that of normal cells [Citation8]. Metabolic reprogramming of tumor cells mainly involves overactive glycolysis and fatty acid synthesis [Citation9]. Previous evidence showed an inverse relationship between total body cholesterol level and risk of developing gastric cancer [Citation10]. It has been found that genes related to metabolism, including isoenzymes in specific pathways, show higher mutation in cancer patients and heterogeneity in different types of cancers [Citation11,Citation12]. In addition, based on the related bases of glucose metabolism and cholesterol metabolism, four metabolic subtypes have been previously found in liver cancer and pancreatic cancer [Citation13,Citation14]. However, so far, the relationship between abnormal glucose and lipid metabolism have not been studied; moreover, the molecular mechanism in relation to prognosis and treatment of gastric cancer should be investigated.
Most gastric cancers contain oncogenic CTNNB1 and loss-of-function TP53 mutation [Citation15]. In addition to general hypoxia, CTNNB1 and TP53 are inducers of glycolytic pathways in cancers [Citation16]. Glycolysis contributes to tumor progression and chemotherapy resistance [Citation17]. The effect of glycolysis on tumor progression can be attenuated by transferring the metabolite pyruvate from lactic acid to mitochondria through the activity of the mitochondrial pyruvate complex (MPC). MPC is composed of pyruvate carriers 1 and 2 (MPC1 and MPC2) [Citation14]. Pyruvate is a metabolic intermediate product of the tricarboxylic acid cycle, providing the precursor citrate of lipogenesis, including the biosynthesis of cholesterol and free fatty acids.
In this study, our main purpose is to identify the metabolic subtypes of gastric cancer with prognostic differences. Gastric cancer patients were divided into different subtypes based on the expression of genes related to glycolysis and cholesterol synthesis. We explored the differences in patients’ survival and other clinical characteristics of different metabolic subtypes of gastric cancer, and determined the carcinogenic molecular events of different subtypes. This study developed a clinically feasible gastric cancer classification scheme, which could guide the design of targeted therapy of gastric cancer.
Material and methods
Data collection and processing
RNA-Seq expression data, single nucleotide variants (SNV), short insertion and deletion (InDel) mutation data, copy number variation (CNV) data and clinical follow-up information data of tissues derived from gastric cancer patients were downloaded from the The Cancer Genome Atlas (TCGA) database [Citation18]. For the RNA-Seq data of TCGA-gastric cancer, the expression profiles of primary solid tumor and solid tissue normal samples were retained. Ensembl were converted to Gene symbol, median value of expressions with multiple gene symbols were taken, and the expression spectrum with fragments per kilobase of transcript per million mapped reads (FPKM) was converted to transcript per million (TPM). After data preprocessing, TCGA gastric cancer contained a total of 407 samples, which consisted of 375 tumor samples and 32 normal samples.
Metabolic subtype classification
Glycolysis and cholesterol-related genes came from REACTOME_GLYCOLYSIS (n = 29) and REACTOME_CHOLESTEROL_BIOSYNTHESIS (n = 24) in the MsigDB database [Citation19]. After removing the genes with an expression level lower than 1 and lower than 50% from all the samples, only 43 glycolysis and cholesterol genes incorporating 23 GLYCOLYSIS genes and 20 CHOLESTEROL genes were obtained. ConsensusClusterPlus [Citation20] (V1.48.0; parameters: reps = 100, pItem = 0.8, pFeature = 1, distance = ‘spearman’) was used to cluster glycolysis and cholesterol genes. D2 and Euclidean distance were respectively used as clustering algorithms and distance measures. The median expression levels of co-expressed glycolysis and cholesterol genes were calculated for Z-score [Citation21]. The TCGA dataset (n = 375) was divided into four subtypes, specifically, the sample with GLYCOLYSIS ≤ 0 and CHOLESTEROL ≤ 0 was defined as quiescent group (Quiescent); the sample with GLYCOLYSIS > 0 and CHOLESTEROL ≤ 0 were defined as the glycolysis group (Glycolysis); the sample with GLYCOLYSIS ≤ 0 and CHOLESTEROL> 0 was defined as cholesterol group (Cholesterol); the samples with GLYCOLYSIS ≥ 0 and CHOLESTEROL ≥ 0 were defined as mixed group (Mixed).
Mutant molecular event analysis
Gene sequences were identified and analyzed from the human genome conference GRCh37/hg19 [Citation22]. To determine carcinogenic molecular events in the metabolic subtypes of gastric cancer, we examined the frequencies of SNV, InDel and CNV, and analyzed their relationship with metabolic subtypes. For tumor ploidy, DNA fragments with replication status ≥ 3 and ≤ 1 were considered as amplification (the average value of fragments > 0.2) and deletion (the average value of fragments < −0.2), respectively. According to a previous research [Citation23], gastric cancer copy number events with at least 10 supporting probes were screened. Bedtools v2.26 [Citation24] was used to map the coordinates of the copy number event to gene coding region, and SNV and CNV of each gene were determined through contingency analysis. The selected genes in each subgroup were tested, and Fisher’s exact test was performed to detect loss-of-function mutations or copy number amplification/deletion in each subgroup. Benjamini–Hochberg (BH) correction was applied in determining the p-value.
RNA expression analysis of MPC1/2
Gene sets positively or negatively correlated with MPC1/2 (calculated by Spearman correlation analysis) were identified by RNA-seq expression analysis, and BH [Citation25] correction was performed for multiple test corrections. Based on the adjusted p value <0.01, a significant correlation between the two genomes was established. The correlation coefficient of r > 0 was used to identify a positive correlation with the gene of MPC1/2, whereas the correlation coefficient of r < 0 was used to identify a negative correlation. A comprehensive gene set enrichment analysis on the two sets of genes was conducted to determine the pathway enrichment of genes positively or negatively correlated with MPC1/2.
Pan-cancer RNA-seq analysis
The ‘per million transcripts’ data of all pan-cancer samples were downloaded, and samples were screened according to cancer types. After the initial screening, there were at least 100 samples and 26 matching cancer types. Next, RNA expression analysis was performed for logarithmic conversion, batch correction, grouping and cluster analysis. For each gene cluster, the ratio of glycolysis genes and cholesterol genes in the cluster was calculated. Gene clusters containing >90% cholesterol genes or >30% glycolytic genes were considered as ‘core’ gene clusters. For cancer types with multiple core clusters in the same gene set, the most uniformed cluster was regarded as the core cluster. According to the median value of each core glycolysis gene and cholesterol gene, the metabolic subtype of each cancer type was determined.
Statistical analysis
The R software package ‘estimate’ [Citation26] was used to calculate the scores of immunity and matrix of each sample. Kaplan–Meier diagrams were plotted using the R packages ‘survival’. The Limma package [Citation27] was used to calculate the differential expression genes between Cholesterol subtype and Glycolysis subtype, according to the threshold FDR <0.05 and |FC|> 1.2. Based on the differential expression genes between Cholesterol subtype and Glycolysis subtype, R software package WebGestaltR (v0.4.2) [Citation28] was performed for Kyoto Encyclopedia of Genes and Genomes (KEGG) pathway analysis and Gene Ontology (GO) function enrichment analysis.
Results
In this study, our main purpose is to identify the metabolic subtypes of gastric cancer with prognostic differences. And we stratified gastric cancer into prognostic metabolic subgroups (Cholesterogenic, Glycolytic, Mixed and Quiescent) according to changes in gene expressions related to glycolysis and cholesterol synthesis.
Identification of molecular subtypes of gastric cancer
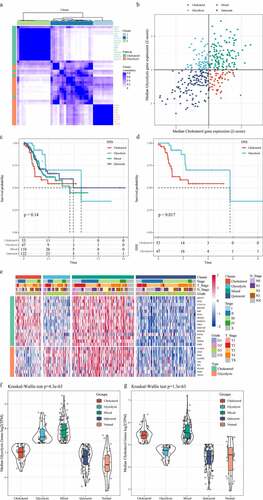
ConsensusClusterPlus was first used for consistent clustering of glycolysis and cholesterol genes, and here we obtained 43 genes. When K = 3, glycolysis genes and cholesterol genes were clustered together (). Z-score was performed using the median expression value of co-expressed glycolysis and cholesterol genes, and the TCGA-gastric cancer data set (n = 375) was divided into four subtypes as previously mentioned (). We further analyzed the prognostic relationship of the four groups, and the results demonstrated that the prognosis of the four subtypes did not show significant differences (); however, there was a significant difference in prognosis between the Cholesterol subtype and the Glycolysis subtype (, p < 0.05), and that the prognosis of Cholesterol subtype was more unfavorable than Glycolysis subtype. Cholesterol genes were generally high expressed in Cholesterol subtypes and Mixed groups but low-expressed in Quiescent and Glycolysis groups. Glycolysis genes were high expressed in the Glycolysis and Mixed groups but low-expressed in the Quiescent and Cholesterol groups (). Furthermore, we compared the expressions of glycolysis and cholesterol-related genes in normal samples with those in tumor samples, and observed that lower expressions of glycolysis genes in normal samples than the other four metabolic subtypes (). Similarly, except Quiescent, the expressions of cholesterol genes in normal samples were also lower than those of the three subtypes (). These results indicated that the occurrence and development of gastric cancer may be accompanied by a higher glycolysis and cholesterol gene expression.
Figure 1. Identification of molecular subtypes of gastric cancer. A: Consistent clustering of glycolysis and cholesterol genes. B: Samples were classified into four subtypes according to glycolysis and cholesterol gene expression levels (Quiescent, Glycolysis, Cholesterol and Mixed). C: Disease-specific survival time prognostic survival curves of the four molecular subtypes. D: Disease-specific survival time prognostic survival curves of the Cholesterol and Glycolysis subtypes. E: Heatmaps of 24 Cholesterol- and Glycolysis-related genes. F: Glycolysis Genes expression levels in four subtypes and normal groups in the TCGA dataset. G: Cholesterol Genes expression levels in four subtypes and normal groups in the TCGA dataset
MPC complex was copy number variation in gastric cancer metabolic subtypes
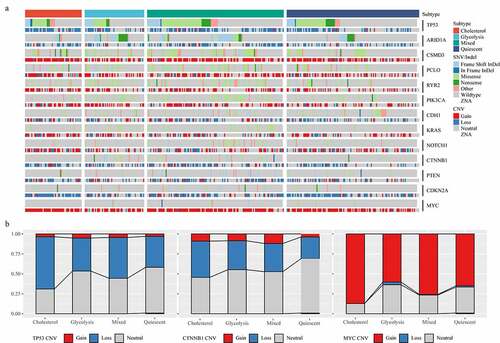
The amplification of the oncogenic mutation MYC and the TP53 mutation could drive the metabolic reprogramming of gastric cancer. The carcinogenic events between different metabolic subtypes were determined by studying the frequency of frequently mutated genes in gastric cancer on SNV/InDel and CNV. The results showed that TP53 mutation and ARID1A mutation had mutually exclusive behaviors (). Subsequently, we analyzed the distribution of TP53, CTNNB1 and MYC genes in the four metabolic subtypes (). Although the mutation frequency of each gene did not differ significantly among different subtypes, we noticed that the occurrence of TP53 Loss sample and the proportion of Cholesterol group samples were higher than that of Glycolysis group samples, and that the proportion of Cholesterol group samples was higher than that of Glycolysis group samples in the samples with MYC Gain.
Figure 2. Mutant molecular events in four subtypes. A: Heat map analysis of mutations of 13 molecules in four subtypes. B: CNV distribution of TP53, CTNNB1 and MYC in four subtypes
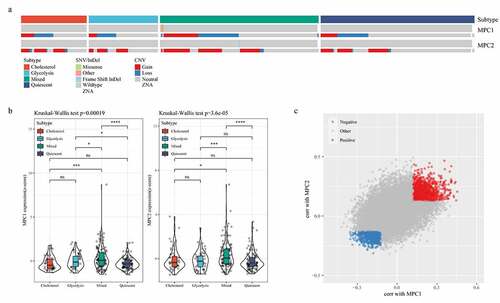
To examine the relationship of MPC1/MPC2, glycolysis and cholesterol production phenotypes, we compared the mutation frequency and expression of the two genes in metabolic subgroups. The data revealed that MPC1 mainly showed CNV deletion in metabolic subtypes, while MPC2 mainly showed CNV amplification in metabolic subtypes (). Compared with the other groups, the expressions of MPC1 and MPC2 in the Mixed group were significantly higher than the other three metabolic groups (). The cellular pathways related to the expression of MPC1/2 were also detected, and Spearman correlation coefficient analysis showed that 1178 and 905 genes were positively and negatively correlated with MPC1/2, respectively ().
Figure 3. MPC complex as a potential regulator of tumor glycolysis-cholesterol synthesis axis. A: MPC1 is mainly CNV deletion in metabolic subtypes, while MPC2 is mainly CNV amplification in metabolic subtypes. B: The expressions of MPC1 and MPC2 in the four subtypes. C: Spearman correlation coefficient analysis showed positive and negative correlation with MPC1/2 genes, respectively
Analysis of clinical features and immune score
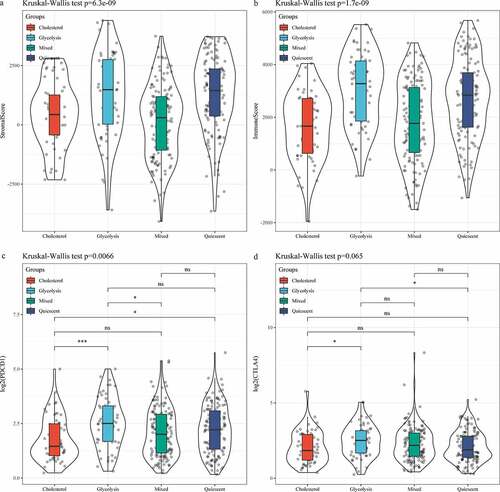
In the TCGA data set, the distribution of clinical characteristics in the four metabolic subtypes was analyzed, and we found differences in the four metabolic subtypes in terms of age, Grade, T Stage, and Stage (, C, D, G); however, no difference was detected in terms of gender, N Stage and M Stage (, E, F). Matrix and immune scores of each sample results demonstrated that the StromalScore and ImmuneScore of Glycolysis subtype were higher than that of Cholesterol subtype samples (, b). After comparing the expressions of immunotherapy-related genes PDCD1 and CTLA4 in the four metabolic subtypes, we observed that the expressions of the two were significantly higher in the Glycolysis subtypes than in the Cholesterol subtype (, d).
Figure 4. Analysis of clinical features in subtypes. A: Analysis of Age in four subtypes. B: Analysis of Gender in four subtypes. C: Analysis of Grade in four subtypes. D: Analysis of T stage in four subtypes. E: Analysis of N stage in four subtypes. F: Analysis of M stage in four subtypes
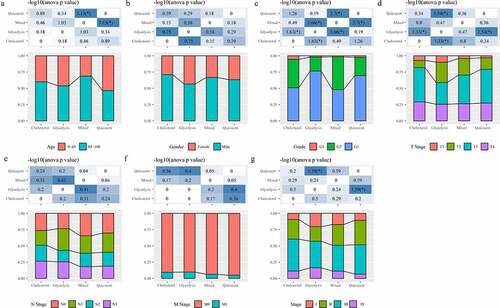
Figure 5. Analysis of and immune score in subtypes. A: Distribution of StromalScore in four subtypes. B: Distribution of ImmuneScore in four subtypes. C: PDCD1 expression of in four subtypes. D: CTLA4 expression of in four subtypes
Identification of differentially expressed genes and functional enrichment analysis
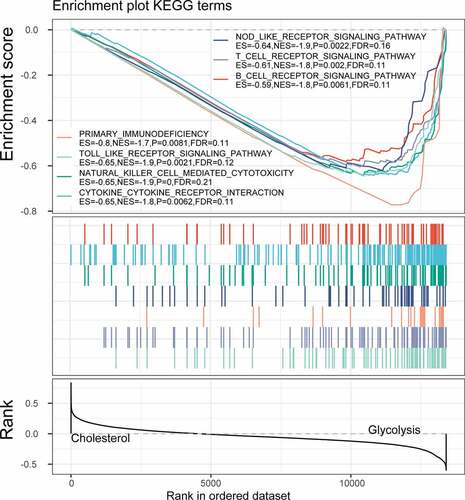
Limma package was used to calculate the differentially expressed genes between Cholesterol subtypes and Glycolysis subtypes in the TCGA dataset. There were a total of 1966 differentially expressed genes, of which 302 were up-regulated, while the rest 1664 were down-regulated (). The top 100 the most differentially expressed genes were selected for constructing a heat map (). Furthermore, the R software package WebGestaltR (v0.4.2) was performed on these up-regulated and down-regulated genes for KEGG pathway and GO function enrichment analyses. Up-regulated genes and down-regulated genes were respectively annotated to 238 and 1197 BP pathways (P < 0.05) (, e), 29 and 147 MF pathways (P < 0.05) (, f), 14 and 155 CC pathways (, g). KEGG pathway enrichment data indicated that the up-regulated and down-regulated genes were annotated to 9 and 74 KEGG pathways, respectively (, h). Finally, GSEA was used in the TCGA data set to analyze the significantly enriched KEGG pathway in the Cholesterol and Glycolysis groups. The results showed that Glycolysis subtypes were associated with immune-related T_CELL_RECEPTOR_SIGNALING_PATHWAY, B_CELL_RECEPTOR_SIGNALING_PATHWAY, NATURAL_KILLER_CELL_MEDIATED_CYTOTOXICITY and PRIMARY_IMMUNODEFICIENCY pathways (). The data indicated that the high expressions of glycolysis-related genes were significantly related to a favorable prognosis of gastric cancer.
Figure 6. Identification of differentially expressed genes. A: A total of 1966 differentially expressed genes, of which 302 are up-regulated and 1664 are down-regulated. B: 100 most expressed genes were selected for heatmap
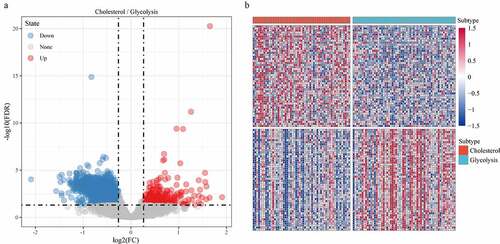
Figure 7. Functional enrichment analysis of differentially expressed genes. A: Pathways annotated on BP for up-regulated expressed genes. B: Pathways annotated on CC for up-regulated expressed genes. C: Pathways annotated on MF for up-regulated expressed genes. D: Pathways annotated on KEGG for up-regulated expressed genes. E: Pathways annotated on BP for down-regulated expressed genes. F: Pathways annotated on CC for down-regulated expressed genes. G: Pathways annotated on MF for down-regulated expressed genes. H: Pathways annotated on KEGG for down-regulated expressed genes
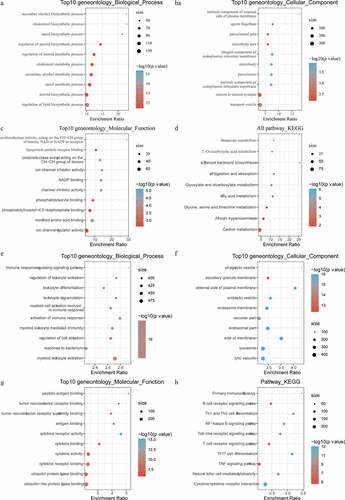
Figure 8. GSEA enrichment analysis in the Cholesterol and Glycolysis group
Correlation analysis of glycolysis and cholesterol gene clusters with pan-cancer types
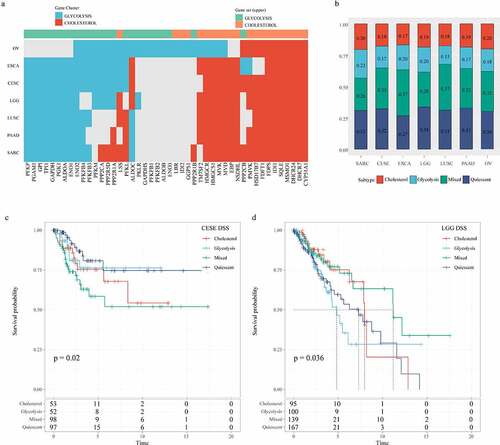
To determine the correlation between glycolysis and cholesterol gene expression subtypes in other cancer types, we repeated the consistent clustering of glycolysis and cholesterol gene expressions in 24 TCGA cancer types (sample size > 100, solid tumors). We found discrete clusters of co-expression pathway-specific genes in seven cancer types (OV, ESCA, CESE, LGG, LUSC, PAAD, and SARC). Although many genes were uniformly co-expressed in most tumor types, in the co-expressed glycolysis and cholesterol production pathways, certain genes were specific to a small number of cancers, indicating that these genes were cell-specific to the metabolic processes of a particular cancer (). According to the clustering glycolysis and cholesterol gene expressions, the seven cancer types were also classified into four metabolic subtypes using the same method (). The DSS time KM curves of the four metabolic subtypes were significantly different in CESE (log rank p = 0.02, ) and LGG (p = 0.036, ). These results indicated that according to the specificities of different genomic characteristics and tumor microenvironmental factors to particular cancer types, tumor metabolism dependence may be different.
Figure 9. Correlation analysis of glycolysis and cholesterol gene clusters with pan-cancer types. A: Clusters of co-expression pathway-specific genes in seven cancer types (OV, ESCA, CESE, LGG, LUSC, PAAD, SARC). B: The seven cancer types are also classified into four metabolic subtypes according to the clustering glycolysis and cholesterol gene expression levels. C: Disease-specific survival time prognostic survival curves of the four molecular subtypes in CESE. D: Disease-specific survival time prognostic survival curves of the four molecular subtypes in LGG
Discussion
In this research, four metabolic subtypes of gastric cancer were identified, namely, Cholesterogenic, Glycolytic, Mixed and Quiescent, noticeably, patients with Cholesterogenic tumors showed the longest DSS. Genome-wide analysis demonstrated that aberrant amplification of TP53 and MYC in gastric cancer was associated with abnormal cholesterol anabolic metabolism. The mRNA levels of MPC1 and 2 differed among the gastric cancer metabolic subtypes. Tumors in the glycolytic group had a higher level of PDCD1. Genomic signature of tumor metabolism between different cancer types was established.
Otto Warburg indicated that even in the presence of sufficient oxygen, cancer cells will produce more lactic acid than normal tissues, suggesting that these cells are transporting glucose through glycolytic fermentation. A relatively high proportion of malignant tumor tissues, including gastric cancer tissues, exhibit increased glycolytic properties [Citation29]. Weichun Chang showed that lipoprotein-mediated cholesterol entry and steroid production are the biological characteristics of gastric cancer progression [Citation30]. Higher levels of metabolic genes promote the growth of gastric cancer and inhibit tumor cell apoptosis [Citation31]. At present, four metabolic subtypes have been identified in pancreatic cancer and liver cancer based on genes related to glucose metabolism and cholesterol metabolism [Citation13,Citation14]. Here we compared the prognostic correlation of other metabolic pathways in gastric cancer with REACTOME_GLYCOLYSIS and REACTOME_CHOLESTEROL_BIOSYNTHESIS pathways, and evaluated the metabolic pathway enrichment scores for each patient using a single-sample enrichment analysis to analyze the relationship between each metabolic pathway enrichment score and prognosis. The data showed that 12 pathways were significantly associated with prognosis, with REACTOME_GLYCOLYSIS and REACTOME_VALOL_BIOSYNTHESIS being the most significant predictors, as expected (Figure S1), which indicated that REACTOME_GLYCOLYSIS and REACTOME_DEMENTIA BIOSYNTHESIS are key prognostic pathways in gastric cancer. Understanding impaired metabolic pathways in cancer facilitates the prediction of cause of cancer, thereby promoting the development of novel and effective therapeutic targets. In this study, four specific subgroups of gastric cancer were determined based on cholesterogenic and glycolytic pathways, which significantly affected the survival of gastric cancer patients.
Up-regulation MYC expression is associated with a more invasive phenotype in gastric cancer cell lines. MYC amplification is a common mechanism of MYC mutation in gastric cancer [Citation32]. MYC amplification in human plasma samples of gastric cancer has been previously reported [Citation33]. TP53 mRNA expression is markedly low in gastric cancer than in paired non-neoplastic specimens [Citation34]. Some studies have shown that most missense mutations in TP53 could cause changes in protein conformation, thereby prolonging its half-life and leading to tumor accumulation in the nucleus includes gastric cancer [Citation35]. In our study, compared with Glycolysis group samples, patients in the Cholesterol group were more likely to have TP53 Loss or MYC amplification. The results suggested that abnormal expression of TP53 and MYC could promote malignant procession of gastric cancer through enhancing cholesterol synthesis and affecting the use of cholesterol. In addition, the detection of mutant genes in the metabolic pathway showed that the MPC complex regulating pyruvate flux was abnormally expressed in gastric cancer, indicating that the changes in MPC were related to the progression of gastric cancer.
This study still had certain limitations. Firstly, this research was based on retrospective public data set; therefore, the performance of subtypes should be verified by future clinical studies. Secondly, the current diagnostic model was only based on RNA expression as a single set of data, which also require the combination of more molecular omics data, such as ncRNA expression, CpG methylation, and genomic information, to further improve model accuracy. Finally, more in-depth functional studies could be performed in the future.
Conclusion
To our knowledge, this is the first time that metabolic genes in gastric cancer have been genotyped. Different tumors have similar metabolic subtypes, but the prognosis of these metabolic subtypes is not exactly the same. The Cholesterol subtype has the worst prognosis in gastric cancer, and the mixed subtype has the worst prognosis in pancreatic cancer, suggesting the differences in the metabolic changes that occur in different cancers, which indicated the difference in the metabolic changes that occur in different cancers. In addition, we have also observed that the Glycolysis subtype has higher immune infiltration and could benefit from immunotherapy. The current findings showed that mutations in different metabolic genes and expressions of specific enzymes resulted in unique metabolic profiles and clinical prognosis specific to gastric cancer. Metabolic profiling of gastric cancer based on metabolic reprogramming may provide an important guide for deciding treatment options, predicting potential responses, treatment resistance, and potential treatment outcomes.
Highlights
1. Four metabolic subtypes of gastric cancer were identified.
2.Aberrant amplification of TP53 and MYC was associated with metabolic subtypes.
3.MPC complex was copy number variation metabolic subtypes.
Abbreviations
Single nucleotide variants (SNV); insertions and deletions (InDel); copy number variation (CNV); The Cancer Genome Atlas (TCGA); disease-specific survival (DSS); mitochondrial pyruvate carriers 1 and 2 (MPC1/2); fragments per kilobase of transcript per million mapped reads (FPKM); transcript per million (TPM); Benjamini–Hochberg (BH); Kyoto Encyclopedia of Genes and Genomes (KEGG); Gene Ontology (GO).
Supplemental Material
Download ()Disclosure statement
No potential conflict of interest was reported by the author(s).
Supplementary material
Supplemental data for this article can be accessed here
Additional information
Funding
Related Research Data
References
- Song F, Yang D, Liu B, et al. Integrated microRNA network analyses identify a poor-prognosis subtype of gastric cancer characterized by the miR-200 family. Clin Cancer Res off J Am Assoc Cancer Res. 2014 Feb 15;20(4):878–889.
- Jemal A, Siegel R, Xu J, et al. Cancer statistics, 2010. CA Cancer J Clin. 2010;60(5):277–300.
- Mizuguchi A, Takai A, Shimizu T, et al. Genetic features of multicentric/multifocal intramucosal gastric carcinoma. Int J Cancer. 2018 Oct 15;143(8):1923–1934.
- Wen L, Li YZ, Zhang J, et al. Clinical analysis of bone metastasis of gastric cancer: incidence, clinicopathological features and survival. Future Oncol. 2019 Jul;15(19):2241–2249.
- Jin X, Bai Y, Gao L, et al. Incidence of and risk factors for cardiotoxicity after fluorouracil-based chemotherapy in locally advanced or metastatic gastric cancer patients. Cancer Chemother Pharmacol. 2019 Sep;84(3):599–607.
- Schlansky B, Sonnenberg A. Epidemiology of noncardia gastric adenocarcinoma in the United States. Am J Gastroenterol. 2011 Nov;106(11):1978–1985.
- Courtnay R, Ngo DC, Malik N, et al. Cancer metabolism and the Warburg effect: the role of HIF-1 and PI3K. Mol Biol Rep. 2015 Apr;42(4):841–851.
- Klionsky DJ, Abdelmohsen K, Abe A, et al. Guidelines for the use and interpretation of assays for monitoring autophagy. Autophagy. 2016;12(1):1–222.
- Koop AC, Bossers GPL, Ploegstra MJ, et al. Metabolic remodeling in the pressure-loaded right ventricle: shifts in glucose and fatty acid metabolism-a systematic review and meta-analysis. J Am Heart Assoc. 2019 Nov 5;8(21):e012086.
- Lim SC, Parajuli KR, Duong HQ, et al. Cholesterol induces autophagic and apoptotic death in gastric carcinoma cells. Int J Oncol. 2014 Mar;44(3):805–811.
- Min DJ, Vural S, Krushkal J. Association of transcriptional levels of folate-mediated one-carbon metabolism-related genes in cancer cell lines with drug treatment response. Cancer Genet. 2019Sep;237:19–38.
- Ose J, Botma A, Balavarca Y, et al. Pathway analysis of genetic variants in folate-mediated one-carbon metabolism-related genes and survival in a prospectively followed cohort of colorectal cancer patients. Cancer Med. 2018 May 29;7(7):2797–2807.
- Jiang J, Zheng Q, Zhu W, et al. Alterations in glycolytic/cholesterogenic gene expression in hepatocellular carcinoma. Aging (Albany NY). 2020 Jun 1;12(11):10300–10316.
- Karasinska JM, Topham JT, Kalloger SE, et al. Altered gene expression along the glycolysis-cholesterol synthesis axis is associated with outcome in pancreatic cancer. Clin Cancer Res off J Am Assoc Cancer Res. 2020 Jan 1;26(1):135–146.
- Yoshida T, Yamaguchi T, Maekawa S, et al. Identification of early genetic changes in well-differentiated intramucosal gastric carcinoma by target deep sequencing. Gastric Cancer. 2019 Jul;22(4):742–750.
- Gao Q, Zhu H, Dong L, et al. Integrated proteogenomic characterization of HBV-Related hepatocellular carcinoma. Cell. 2019 Oct 3;179(2):561–577.e22.
- Xu M, Chen S, Yang W, et al. FGFR4 links glucose metabolism and chemotherapy resistance in breast cancer. Cell Physiol Biochem. 2018;47(1):151–160.
- Wang Z, Jensen MA, Zenklusen JC. A Practical. Guide to The Cancer Genome Atlas (TCGA). Methods Mol Biol. 2016;1418:111–141.
- Liberzon A, Subramanian A, Pinchback R, et al. Molecular signatures database (MSigDB) 3.0. Bioinformatics. 2011 Jun 15;27(12):1739–1740.
- Wilkerson MD, Hayes DN. ConsensusClusterPlus: a class discovery tool with confidence assessments and item tracking. Bioinformatics. 2010 Jun 15;26(12):1572–1573.
- Kim SS, Aprahamian ML, Lindert S. Improving inverse docking target identification with Z-score selection. Chem Biol Drug Des. 2019 Jun;93(6):1105–1116.
- Mefford H, Mitchell E, Hodge J 17q12 recurrent duplication. In: Adam MP, Ardinger HH, Pagon RA, et al, Editors. GeneReviews(®). University of Washington, SeattleCopyright © 1993-2020, University of Washington, Seattle. GeneReviews is a registered trademark of the University of Washington, Seattle. All rights reserved; 1993
- Laddha SV, Ganesan S, Chan CS, et al. Mutational landscape of the essential autophagy gene BECN1 in human cancers. Mol Cancer Res. 2014 Apr;12(4):485–490.
- Quinlan AR, Hall IM. BEDTools: a flexible suite of utilities for comparing genomic features. Bioinformatics. 2010 Mar 15;26(6):841–842.
- Ferreira JA The Benjamini-Hochberg method in the case of discrete test statistics Int J Biostat 2007 3(1). Article 11doi:10.2202/1557-4679.1065.
- Chakraborty H, Hossain A. R package to estimate intracluster correlation coefficient with confidence interval for binary data. Comput Methods Programs Biomed. 2018Mar;155:85–92.
- Ritchie ME, Phipson B, Wu D, et al. limma powers differential expression analyses for RNA-sequencing and microarray studies. Nucleic Acids Res. 2015 Apr 20;43(7):e47.
- Liao Y, Wang J, Jaehnig EJ, et al. WebGestalt 2019: gene set analysis toolkit with revamped UIs and APIs. Nucleic Acids Res. 2019 Jul 2;47(W1):W199–w205.
- Matsunaga S, Nishiumi S, Tagawa R, et al. Alterations in metabolic pathways in gastric epithelial cells infected with Helicobacter pylori. Microb Pathog. 2018Nov;124:122–129.
- Chang WC, Huang SF, Lee YM, et al. Cholesterol import and steroidogenesis are biosignatures for gastric cancer patient survival. Oncotarget. 2017 Jan 3;8(1):692–704.
- Xu DH, Li Q, Hu H, et al. Transmembrane protein GRINA modulates aerobic glycolysis and promotes tumor progression in gastric cancer. J Exp Clin Cancer Res. 2018 Dec 12;37(1):308.
- Calcagno DQ, Leal MF, Assumpcao PP, et al. MYC and gastric adenocarcinoma carcinogenesis. World J Gastroenterol. 2008 Oct 21;14(39):5962–5968.
- Park KU, Lee HE, Park DJ, et al. MYC quantitation in cell-free plasma DNA by real-time PCR for gastric cancer diagnosis. Clin Chem Lab Med. 2009;47(5):530–536.
- Calcagno DQ, Freitas VM, Leal MF, et al. MYC, FBXW7 and TP53 copy number variation and expression in gastric cancer. BMC Gastroenterol. 2013 Sep 23;13(1):141.
- Hollstein M, Sidransky D, Vogelstein B, et al. p53 mutations in human cancers. Science (New York, NY). 1991 Jul 5;253(5015):49–53.