
ABSTRACT
The global incidence of ulcerative colitis (UC) continues to increase while it’s clinical cure rate remains low. Intestinal mucosal ulcers have segmental distribution and variable severity. Intestinal bacteria are closely related to intestinal immunity and metabolism; however, the relationship between intestinal microbiome profile and the occurrence of UC, as well as the contribution of glucose metabolism, are not well understood. This was investigated in the present study using mucosal biopsies from patients with UC and healthy control subjects. We performed high throughput 16S rRNA gene sequencing to estimate microbiota composition and abundance as well as their association with clinical indices such as lesion severity. The results showed that the diversity and abundance of intestinal microbiota were significantly lower in patients with UC than in healthy subjects; however, these were unrelated to ulcer severity. Serum glucagon-like peptide 2 (GLP-2) level was associated with reduced microbiota diversity and abundance in UC. These results indicate that colonization by specific microbiota is not the main determinant of pathologic status in UC. Additionally, therapeutic strategies that increase GLP-2 levels in intestinal mucosa may be effective in the treatment of UC.
Graphical abstract
Introduction
Ulcerative colitis (UC) is a disease characterized by inflammation of the intestinal tract. The clinical cure rate of UC is low; however, treatments such as probiotic preparations and fecal microbiota transplantation have had some clinical success, highlighting the central role of gut microbiota in UC pathology [Citation1–3]Abnormal immune responses and destruction of the mucosal-epithelial barrier in UC have been attributed to gut bacteria [Citation4–6]Gut microbiome composition is altered in UC, with significant reductions observed in the abundance of Bifidobacterium and Lactobacillus [Citation7,Citation8]and increased numbers of pathogenic bacteria such as Salmonella spp., Thyrobacterium spp., and Bacillus difficile that result in the disruption of intestinal homeostasis. The contribution of gut microbiota to UC severity is acknowledged in UC treatment guidelines [Citation9]
In clinical practice, we have observed that UC does not spread past the cecum. The distribution and progression of UC vary among individuals for reasons that are unclear. Inflammation in intestinal tissue is related to the host’s age as well as the location and composition of microbiota [Citation10] and is correlated with the clinical features of UC.
Most studies on intestinal microbiota use fecal samples [Citation11] which have certain advantages. Firstly, they reflect the overall status of the intestinal environment. Secondly, sample collection is simple and noninvasive. A disadvantage of fecal samples is that they are influenced by the living environment and dietary habits of an individual and are susceptible to environmental contaminants during collection. Moreover, they do not provide a detailed view of local conditions in the intestine that can affect lesions at specific sites. In contrast, mucosal biopsies can reveal local flora distribution in the intestinal mucosa.
UC is frequently accompanied by abnormal glucose metabolism, which has been attributed to hormonal imbalance or metabolic disorders. Dysregulation of glucose metabolism in UC has been linked to the intestinal microbiome profile [Citation12,Citation13]. Thus, changes in gut microbiota composition or abundance may affect inflammation and glucose metabolism in the intestine. Glucagon-like peptide 2 (GLP-2) is a peptide hormone that has a variety of beneficial effects on the intestine, such as inducing the expansion of mucosal surface area by stimulating crypt cell proliferation and promoting nutrient processing and absorption [Citation14] GLP-2 was shown to exert a protective effect on intestinal mucosa [Citation15,Citation16]
The distribution and severity of lesions in UC is related to colonization of intestinal mucosa by specific microbiota and is influenced by the microenvironment, including processes such as glucose metabolism [Citation17,Citation18]. To test this hypothesis, in this study, we carried out microbiome profiling of mucosal lesions of varying degrees of severity obtained from patients with UC and intestinal mucosal tissue from healthy control subjects in order to determine whether changes in gut microbiota are associated with clinical manifestations and progression of UC.
Materials and methods
Study population
The study enrolled 11 patients with UC and segmental distribution of lesions who had not received probiotic or antibiotic treatment in the previous 4 weeks. All cases met the 2012 diagnostic criteria of the Chinese Medical Association’s Digestive Credit Inflammatory Bowel Disease Collaboration Group (Chinese Medical Association,2012) and were assigned a Mayo score. There were 3 severe and 4 mild cases of UC. According to UC treatment guidelines, the patients underwent endoscopic biopsy of the terminal ileum; severe and junctional lesions, as well as relatively normal areas of tissue, were collected along with a tissue sample from the rectum and a blood sample. Patients with severe heart disease or high blood pressure, pregnant women, and patients with contraindications for colonoscopy were excluded. The healthy control group comprised 9 subjects; in compliance with international ethics standards, the subjects underwent a biopsy for eosinophilic enteritis at the same hospital, and mucosal samples from their biopsies were confirmed to be normal by pathological examination (). Tissue samples were obtained from terminal ileum and rectum, and corresponding blood samples were also collected. In order to maintain consistency, all samples were collected by the same investigator based on the endoscopic diagnosis. There were no significant differences between UC patients and healthy control subjects in terms of age and BMI.
Table 1. Patients demographics and clinical characteristics
Lesion severity in UC patient samples was confirmed by histopathologic examination. Quality control of the samples was performed, and those that were of low quality were excluded from the analysis. 16S rRNA gene sequencing was performed for 12 of the 20 patients (36 different samples of intestinal mucosa). The study was approved by the Research Ethics Committee of the First Affiliated Hospital of Harbin Medical University and was carried out in accordance with the ethical principles outlined in the Declaration of Helsinki. Written and informed consent was obtained from each participant.
Experimental procedures
Serum ELISA, and immunohistochemistry
Serum GLP-2 level was determined by ELISA using a commercial kit (Jianglai Biological Technology Co, Shanghai, China, cat. no. JL19998) according to the manufacturer’s instructions. The hematoxylin and eosin (H&E) staining. and Immunohistochemical detection of GLP-2 in intestinal mucosa was performed according to standard procedures using an anti-GLP-2 antibody (Jianglai Biological Technology Co; cat. no. AF0166). The presence of yellow or brownish-yellow particles indicated immunopositivity. Positive cells in 5 high-power random fields in each tissue section were counted. Positive expression was graded based on the percentage of positive cells and staining intensity as follows: negative (−), <10% positive cells and light yellow color; weak positive (+), 10%–25% positive cells and yellow to brown color; strong positive (+++), >50% positive cells and brownish yellow to tan color; and positive (++), intermediate between (+) and (+++).
16S rRNA gene sequencing
Intestinal mucosa tissue samples that were not used for routine pathologic examination were immediately frozen in liquid nitrogen and stored at −80°C until analysis. The whole blood sample remaining after clinical testing was centrifuged, and the serum was stored at −80°C. Genomic DNA extraction and PCR amplification were performed by Jiangsu Huada (BGI) Chemical Group Co, Changzhou, China, and Meiji Biotechnology, Shanghai, China). The purity of the extracted DNA was confirmed by 1% agarose gel electrophoresis. PCR amplification was performed using TransStart FastPfu DNA polymerase (TransGen Biotech, Beijing, China; cat. no. AP221-022) on a GeneAmp 9700 thermal cycler (Applied Biosystems, Foster City, CA, USA). Quantitative fluorescence electrophoresis was performed for preliminary quantitation of the PCR products using the QuantiFluor-ST system (Promega, Madison, WI, USA). After library construction, the V3–V4 hypervariable region of the bacterial 16S rRNA gene was amplified using the following primer pair: 338-ACTCCTACGGGAGGCAGCAG (forward) and 806-GGACTACHVGGGTWTCTAAT (reverse). Because of a conflict in sample delivery time, 16S rRNA gene sequencing was performed by Majorbio Bio-Pharm Technology Co. (Shanghai, China) and Huada (BGI) Biotechnology Co (Wuhan, China). The purified amplifiers were mixed at an equimolar ratio and sequenced with the MiSeq platform (Illumina, San Diego, CA, USA) in the paired end (PE) 300 mode.
Bioinformatics analysis
PE reads obtained by library sequencing were stitched together based on overlapping regions. Sequence quality was controlled and filtered, and OTU clustering and taxonomic analysis were performed. We extracted nonrepeating sequences as optimized sequences to reduce redundancy calculations in the analysis, removed single sequences without repetitions, and performed OTU clustering on nonrepeating sequences (excluding single sequences) based on 97% similarity. Chimeras were removed in the clustering process, yielding representative OTU sequences. We mapped all optimized sequences to representative OTU sequences and selected those with >97% similarity to representative sequences to generate OTU tables.
We experimentally grouped factors in the original data that were quality controlled and carried out species annotation and composition analysis (including OTU and α diversity analyses). We then constructed a heatmap of the community structure and Circos diagram of the relationship between samples and species and carried out comparative analyses of the sample, including PCoA and multigroup, intergroup, and LEfSe multilevel analyses of species differences. Finally, we performed a correlation analysis of clinical data, constructed a heatmap of the correlation, and carried out linear regression analysis on 5 indices with significant correlations.
Statistical analysis
Statistical analyses were performed using R software package (R Core Team, 2013) and SPSS v19.0 software (SPSS Inc, Chicago, IL, USA). Differences in Sobs, Shannon, and ACE indices between groups were evaluated for statistical significance with the Wilcoxon rank-sum test, and LEFSe was used to identify species responsible for the differences, with a nonparametric factorial Wilcoxon rank-sum test used to assess differences in abundance. Species differences between groups were evaluated with the Kruskal–Wallis test. Differences in serum GLP-2 expression were analyzed with the independent samples t-test. The F statistic for the linear regression model was based on sample variance analysis.
Results
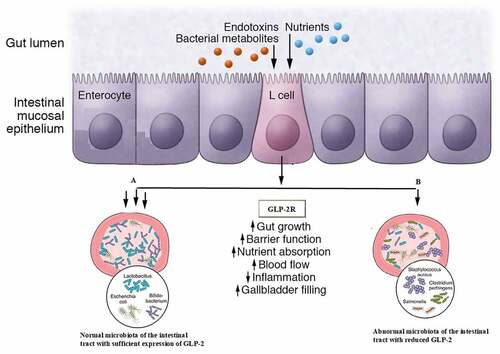
The previous studies shown that GLP-2 is synthesized in the enteroendocrine L cells (along with GLP-1) and in the brainstem and hypothalamus of the central nervous system. GLP-1 mainly regulate insulin secretion in beta cells of pancreatic islets, where GLP-2 widely regulate intestinal physiological functions.
Characteristics of the study population
The characteristics of the study population are shown in . There were no significant differences in age or body mass index (BMI) between UC patients and healthy control subjects.
Intestinal microbiota diversity and abundance are reduced in UC
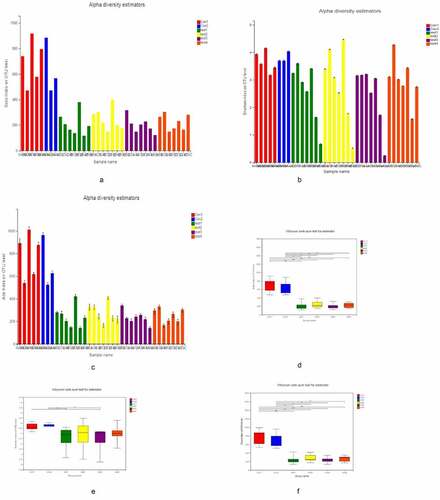
We divided the tissue samples into the following 6 groups for 16S rRNA gene sequencing and bioinformatics analysis (): normal ileum; normal colon; normal tissue from UC patients; lesions from UC patients; UC patient ileum; and UC patient junctional area. We assessed the α diversity of the samples based on observed subsample species richness (Sobs), which was used to estimate the richness of operational taxonomic units (OTUs); the Shannon index and abundance-based coverage estimator (ACE) index were used to measuring species diversity and richness, respectively (–C). The Sobs, Shannon, and ACE indices were significantly lower in UC patients than in healthy subjects, as determined with the Wilcoxon rank-sum test (–F). However, there were no significant differences in these indices among UC patient groups.
Figure 1. α Diversity analysis A, B, C for Sobs, Shannon, and ACE indices of UC patients and healthy control subjects at the OTU level. D, E, F for Significant differences between samples from 2 selected groups. *P < 0.05, **P < 0.01, ***P < 0.001. X and Y axes show group names and exponential averages for each group, respectively
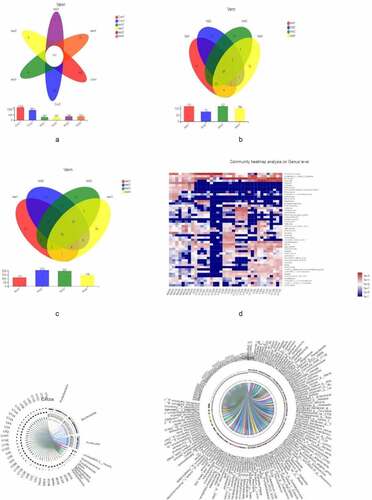
We then examined overall microbiota composition in the 6 groups by quantifying the number of different taxa. In order to eliminate the influence of environmental factors, we also compared samples showing significant differences in composition within each group. Compared to the normal control group, the abundance of mucosal microbiota was reduced in UC patients, although there were no differences in microbiota diversity or abundance among UC patients (–c). The similarities and differences in gut microbiota composition were clearly observed in the heatmap (); Proteobacteria, Bacteroides, Firmicutes, Unclassified_k_norank_d_Bacteria, Actinobacteria, and Fusobacteria showed differences between UC patients and healthy controls (, f).
Figure 2. Microbiota composition,A, B, C represent the Venn diagram with different colors representing different groups (or samples); numbers in overlapping areas represent the number of species common to multiple groups, and numbers in nonoverlapping areas represent the number of unique species in corresponding groups. D, the X and Y axes show sample or group names and species names, respectively. The abundances of different species in the samples are represented by a color gradient; values represented by the color are shown to the right. E, F represent the Circos diagram of the relationship between sample and species
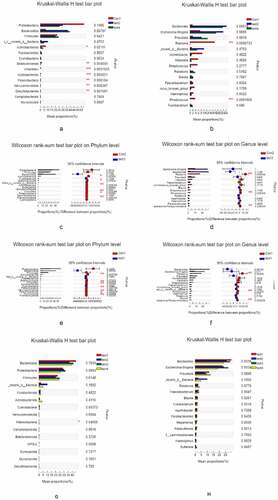
We carried out a β diversity analysis to evaluate differences in gut microbiota composition between samples (). The principal coordinate analysis (PCoA) showed that at the phylum level, there were significant differences in bacterial composition between UC and normal control groups (, b). However, there were no differences among UC patients. In order to evaluate the relationship between species composition and lesion severity, we used linear discriminant analysis effect size (LEFSe) and the nonparametric Kruskal–Wallis test to identify species responsible for intergroup differences (). Compared to normal control samples, UC patients showed reduced microbiota diversity and abundance in the colon irrespective of lesion severity, with significant differences observed at the phylum level (Actinobacteriota, Chloroflex, and Patescibacteria) and genus level (Ralstonia and Rhodococcus, which were less abundant in UC patients) (, b). Lower diversity and abundance of microbiota was also observed in the small intestine of UC patients, with significant differences for Acidobacteria, Planctomycetota, and other phyla (, d). Among UC samples, there were differences between relatively normal tissue and lesions at the phylum (e.g., Actinobacteriota and Chloroflexi) and genus (eg, Ralstonia, Rhodococcus, Burkholderia-Caballeronia-Paraburkholderia) levels (, f). Thus, differences in intestinal mucosa microbiome profiles at the phylum and genus levels in UC patients were independent of lesion severity (, h).
Figure 3. β diversity analysis, A, different colors represent sample groupings, and the box chart in the figure represents the dispersion of different groups of samples on the PC1 axis. B, X and Y axes show 2 selected spindles, and the percentages are the interpreted value of the axes for differences in sample composition. The scales of the X and Y axes are relative distances that have no practical significance. Different colors or shapes represent different groupings of samples; a shorter distance between 2 sample points indicates greater similarity in their species composition. C, different color nodes represent microbiota that is significantly enriched in the corresponding group and have a significant effect on intergroup differences; pale yellow nodes represent microbiota that are not significantly different across groups or that have no significant effect on intergroup differences
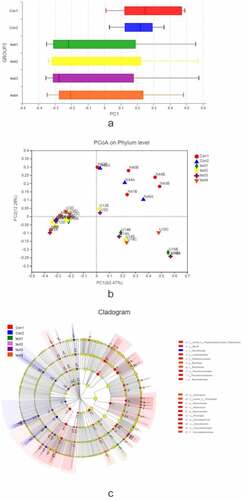
Figure 3. Continued
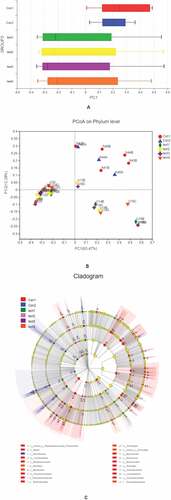
Figure 4. Relationship between species composition and lesion severity. Compared to normal control samples, UC patients showed reduced microbiota diversity and abundance in the colon irrespective of lesion severity, with significant differences observed at the phylum level (Actinobacteriota, Chloroflex, and Patescibacteria) and genus level (Ralstonia and Rhodococcus, which were less abundant in UC patients) (a, b). Lowerdiversity and abundance of microbiota was also observed in the small intestine of UC patients, with significant differences for Acidobacteria, Planctomycetota, and other phyla (c, d). Among UC samples, there were differences between relatively normal tissue and lesions at the phylum (e.g., Actinobacteriota, and Chloroflexi) and genus (eg, Ralstonia, Rhodococcus, Burkholderia-Caballeronia-Paraburkholderia) levels (e, f). Thus, differences in intestinal mucosa microbiome profiles at the phylum and genus levels in UC patients were independent of lesion severity (g, h)
Glucose metabolism and biochemical indices are perturbed in UC
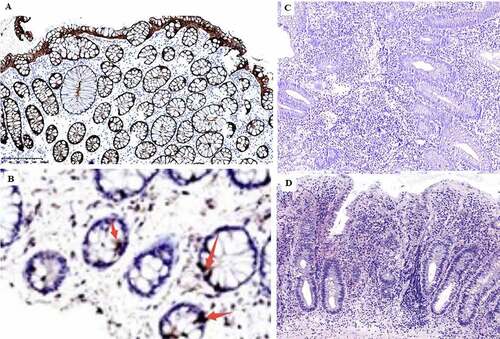
In order to determine whether glucose metabolism in the gut is altered in UC, we measured serum levels of GLP-2 by enzyme-linked immunosorbent assay (ELISA). GLP-2 level was significantly lower in UC patients than in healthy control subjects (P < 0.01; ). The lower level of serum GLP-2 in UC was correlated with the observed reductions in microbiota diversity and abundance. To confirm these results, we performed an immunohistochemical analysis of GLP-2 expression in mucosal tissue samples and found that GLP-2 was expressed in the glands of the intestinal epithelium and was localized in the cell membrane and cytoplasm; however, the expression was reduced in UC patients compared to healthy control subjects (P < 0.05; , ).
Table 2. Optical density values for serum GLP-2 detected by ELISA in ulcerative colitis patients and healthy control subjects
Table 3. Results of the independent samples test for optical density value of serum GLP-2 in ulcerative colitis patients and healthy control subjects
Table 4. The expression of Glp-2 in colonic mucosa group number (-) (+) (++) (+++) UC 11 4 3 3 1 Normal 9 0 2 4 3
Figure 5. Immunohistochemical detection of GLP-2 expression in the intestinal mucosa. A, strong positive expression of GLP-2 (+++) (most healthy control samples). B, weak positive expression of GLP-2 (+). C, negative expression of LP-2 (−) (most UC samples), D, diagnosed UC sample histology H&E staining
Alterations in glucose metabolism and inflammation are associated with microbiome profile in UC
To assess the severity of inflammation in the intestinal mucosa of UC patients and its impact on gut microbiome profile, we examined indices of intestinal epithelium inflammation in UC, including erythrocyte sedimentation rate, C-reactive protein, hemoglobin (Hb), thrombocyte count, neutrophil granulocyte percentage, and the optical density (OD) value of GLP-2 in ELISA. Glucose tolerance was evaluated with the oral glucose tolerance test (OGTT), and a correlation heatmap was generated to visualize the relationship between microbiota species and the aforementioned markers (). Hb and neutrophil granulocyte percentage, as well as other physiologic parameters, were related to changes in the abundance of Actinobacteria, Dependentiae, Planctomycetota, Gemmatimonadota, etc. To further validate this result, we carried out a linear regression analysis of 5 clinically relevant parameters (erythrocyte sedimentation rate, C-reactive protein, thrombocyte count, and the optical density (OD) value of GLP-2 in ELISA. Glucose tolerance was evaluated with the oral glucose tolerance test (OGTT). We first performed PCoA (全名), in which the score (β-diversity or the α-diversity index) of each sample and the parameters (e.g, OD of GLP-2, platelet count, etc.) were plotted on the Y and X axes of the scatter plot, respectively; we then performed linear regression to evaluate the relationship between the parameters. We found that alterations in gut microbiome profile were positively correlated with GLP-2 level and negatively correlated with the other clinical indices, and the correlations were strengthened with greater disease severity (–F).
Figure 6. [α diversity]. a X and Y axes show clinical parameters and bacterial species present in the intestinal mucosa, respectively. *P < 0.05, **P < 0.01, ***P < 0.001. b–f X and Y axes show clinical parameters and β – or α-diversity index, respectively. The X-coordinates represent environmental factors (e.g., pH, temperature, etc.), the Y-coordinates represent the rank of β-diversity or the α-diversity index, R2 is a determining factor, representing the proportion of variation interpreted by the linear regression line, and the greater R2 index, the higher the degree of interpretation of this environmental factor is on the differences in the composition of the group or in the α-diversity index. b C-reactive protein. c Erythrocyte sedimentation rate. d Thrombocyte count. e GLP-2. f OGTT
![Figure 6. [α diversity]. a X and Y axes show clinical parameters and bacterial species present in the intestinal mucosa, respectively. *P < 0.05, **P < 0.01, ***P < 0.001. b–f X and Y axes show clinical parameters and β – or α-diversity index, respectively. The X-coordinates represent environmental factors (e.g., pH, temperature, etc.), the Y-coordinates represent the rank of β-diversity or the α-diversity index, R2 is a determining factor, representing the proportion of variation interpreted by the linear regression line, and the greater R2 index, the higher the degree of interpretation of this environmental factor is on the differences in the composition of the group or in the α-diversity index. b C-reactive protein. c Erythrocyte sedimentation rate. d Thrombocyte count. e GLP-2. f OGTT](/cms/asset/502c9910-148a-4149-8fec-98f8931d02a2/kbie_a_1958600_f0006_oc.jpg)
Discussion
In this study, we analyzed gut microbiome profiles in different parts of the intestinal mucosa with lesions of varying severity and examined whether these are related to clinical features of UC. To our knowledge, this is the first study in which biopsies obtained from different parts of the intestine were compared. Based on high throughput 16S RNA sequencing and glucose metabolism analyses, we first examined microbiota from intestinal areas with severe lesions, borderline lesions, and relatively normalfrom patients with segmental distribution of UC; these were also compared to the corresponding area in biopsy samples from healthy controls. The results showed that both the diversity and overall abundance of microbiota in the ileum and colon were significantly reduced in UC patients compared to healthy subjects. Similar trend was observed in earlier work [Citation19], but our results contradict findings from a previous study that showed by quantitative PCR analysis that severe UC was associated with enrichment of bacteria on the mucosal surface [Citation20] Increased mucosal secretion and necrosis can lead to enrichment of gut microbiota, which can colonize host tissues and induce an immune response [Citation21].
Contrary to our expectation, there were no differences in microbiota diversity and abundance between samples from different parts of the gut or according to lesion severity in individual patients or among patients with UC, which is in accordance with a previous report [Citation22]. These results suggest that the gut microbiome profile is not the main factor influencing the degree of local inflammation, although this requires confirmation in future studies.
We compared microbiota at the terminal ileum of UC patients and healthy control subjects. The ileum in UC patients was normal (no ulcerative lesions) and lesions were ‘inverted’ and far away from the cecum; nonetheless, the diversity and abundance of microbiota at the terminal ileum were significantly reduced regardless of whether a lesion was present, as reported by others [Citation23,Citation24]. Colonization by microbiota is influenced by the tissue microenvironment, mainly by factors such as oxygen gradient, protein content, etc. Disruption of the mucosal barrier and loss of bacterial diversity at the terminal ileum are potential indicators of lesions along the entire colon [Citation25].
We performed intergroup and intragroup comparisons of intestinal mucosa samples by (全名) analysis from the phylum to species level. Although our results markedly diverged from those obtained using fecal samples, they were consistent with other reports [Citation26,Citation27]. There were no differences in microbiota diversity or abundance according to lesion severity in UC, and the species found in UC samples were the same as those present in healthy control subjects as previously demonstrated [Citation28]. Even the invasive and adhesive enteropathogenic bacterium Escherichia coli was not detected in lesions from UC patients, although it is present in both the small and large intestines of patients with Crohn’s disease [Citation29,Citation30]. This implies that gut bacteria do not promote the occurrence of UC through local colonization and induction of the host immune response but instead cause inflammation by altering metabolite levels and weakening the mucosal barrier [Citation25].
We examined serum GLP-2 levels and found that it was correlated to reduced microbiota diversity and abundance in UC. Abnormal glucose metabolism has been linked to UC pathogenesis, and GLP-2 is downregulated in patients with UC. GLP-2 is a secreted protein whose level was found to be positively correlated with the abundance of gut microbiota, with a stronger correlation observed in more severe disease. The blood glucose level in the OGTT was the main factor affecting lesion severity in UCand was related to the reduced diversity of microbiota. Thus, decreases in the diversity and abundance of gut microbiota may result in decreased levels of protective factors and negative effects on host metabolism. ErbB (全名) signaling was shown to regulate the intestinal secretion of GLP-2 [Citation14,Citation31]; and the Janus kinase (JAK)/signal transducer and activator of transcription (STAT) signaling pathway – the main pathway dysregulated in UC – influences the activation of epidermal growth factor (EGF)/ErbB receptor [Citation32]. Microbiota can directly modulate JAK/STAT signal transduction [Citation33] thus, the relationship between the gut microbiome, glucose metabolism, and UC can be summarized as follows: alterations in microbiota diversity and abundance induce the activation of redox, JAK/STAT, and EGF/ErbB signaling, upregulation of GLP-2, and pathogenic changes in the intestinal mucosa.
Although this study was limited by small sample size, it nonetheless demonstrates that colonization by specific microbiota is not the main determinant of lesion severity in UC. Moreover, a reduced abundance of certain bacterial taxa at the terminal ileum can be an early indicator of the disease. GLP-2 is closely related to the metabolic activity of bacteria and has a protective effect against inflammation. Thus, therapeutic strategies that increase GLP-2 levels may be effective in the treatment of UC.
Conclusions
GLP-2, a peptide hormone secreted by L-cells in intestinal mucosa may be effective in the treatment of UC due to its increasing roles in intestinal microbiota, and hormone functions which can be easily expanded.
Data accessibility
Raw sequences generated by 16S rRNA sequencing have been deposited in the NCBI Sequence Read Archive (SRA: SUB8157907; Study PRJNA664267), and the relevant metadata can be found at https://www.ncbi.nlm.nih.gov/Traces/study/ under the SRA accession number.
Ethics approval and consent to participate
This study was approved by the Research Ethics Committee of the First Affiliated Hospital of Harbin Medical University (approval no. IRB-AF/SC-04/01.0). Experiments were performed in strict accordance with international guidelines regarding the conduct of clinical trials, and each patient provided written, informed consent.
Author contributions
Dongyue Li and Hongyu Kuang made substantial contributions to study conception and design and data acquisition. Youlin Yang performed quality control of clinical samples. Dongyue Li, Xunhai Yin, Ping Huang, Wenbo Ding, and Huichao Zhang collected samples. Hongyu Xu and Yu Ni performed clinical diagnosis and treatment. Dongyue Li and Sijia Niu performed bioinformatics and statistical analyses and interpreted the data. Dongyue Li wrote the manuscript. All authors read and approved the final manuscript.
Disclosure statement
No potential conflict of interest was reported by the author(s).
References
- Uygun A, Ozturk K, Demirci H, et al. Fecal microbiota transplantation is a rescue treatment modality for refractory ulcerative colitis. Medicine (Baltimore). 2017;96(16):e6479.
- Cammarota G, Ianiro G, Tilg H, et al. European FMT working group. European consensus conference on faecal microbiota transplantation in clinical practice. Gut. 2017;66(4):569–580.
- Fang H, Fu L, Wang J. Protocol for fecal microbiota transplantation in inflammatory bowel disease: a systematic review and meta-analysis. Biomed Res Int. 2018;2018:8941340.
- Barbara G, Stanghellini V, Brandi G, et al. Interactions between commensal bacteria and gut sensorimotor function in health and disease. Am J Gastroenterol. 2005;100(11):2560–2568.
- Podolsky DK. Inflammatory bowel disease. N Engl J Med. 2002;347(6):417–429.
- King TS, Elia M, Hunter JO. Abnormal colonic fermentation in irritable bowel syndrome. Lancet. 1998;352(9135):1187–1189.
- Liang J, Sha SM, Wu KC. Role of the intestinal microbiota and fecal transplantation in inflammatory bowel diseases. J Dig Dis. 2014;15(12):641–646.
- Shigemori S, Shimosato T. Applications of genetically modified immunobiotics with high immunoregulatory capacity for treatment of inflammatory bowel diseases. Front Immunol. 2017;8:22.
- Bressler B, Marshall JK, Bernstein CN, et al. Toronto ulcerative colitis consensus group. clinical practice guidelines for the medical management of nonhospitalized ulcerative colitis: the toronto consensus. Gastroenterology. 2015;148(5):1035–1058.e3.
- Molodecky NA, Soon IS, Rabi DM, et al. Increasing incidence and prevalence of the inflammatory bowel diseases with time, based on systematic review. Gastroenterology. 2012 Jan;142(1):46–54.e42. quiz e30.
- Ma HQ, Yu TT, Zhao XJ, et al. Fecal microbial dysbiosis in Chinese patients with inflammatory bowel disease. World J Gastroenterol. 2018;24(13):1464–1477.
- Harris K, Kassis A, Major G, et al. Is the gut microbiota a new factor contributing to obesity and its metabolic disorders? J Obes. 2012;2012:879151.
- Duncan SH, Lobley GE, Holtrop G, et al. Human colonic microbiota associated with diet, obesity and weight loss. Int J Obes (Lond). 2008;32(11):1720–1724.
- Rowland KJ, Brubaker PL. The “cryptic” mechanism of action of glucagon-like peptide-2. Am J Physiol Gastrointest Liver Physiol. 2011;301(1):G1–8.
- Sigalet DL, Wallace LE, Holst JJ, et al. Enteric neural pathways mediate the anti-inflammatory actions of glucagon-like peptide 2. Am J Physiol Gastrointest Liver Physiol. 2007;293(1):G211–21.
- Yazbeck R, Abbott CA, Howarth GS. The use of GLP-2 and related growth factors in intestinal diseases. Curr Opin Invest Drugs. 2010;11(4):440–446.
- Koyande AK, Chew KW, Rambabu K, et al. Microalgae: a potential alternative to health supplementation for humans. Food Sci Human Wellness. 2019;8(1):16–24.
- How CW, Ong YS, Low SS, et al. How far have we explored fungi to fight cancer? Semin Cancer Biol. 2021; in press. DOI:10.1016/j.semcancer.2021.03.009
- Ott SJ, Musfeldt M, Wenderoth DF, et al. Reduction in diversity of the colonic mucosa associated bacterial microflora in patients with active inflammatory bowel disease. Gut. 2004;53(5):685–693.
- Swidsinski A, Ladhoff A, Pernthaler A, et al. Mucosal flora in inflammatory bowel disease. Gastroenterology. 2002;122(1):44–54.
- Yuan C, Graham M, Staley C, et al. Metabolome along the intestinal tract reveal a location-specific relationship. mSystems. 2020;5(3):e00055–20.
- Lloyd-Price J, Arze C, Ananthakrishnan AN, et al.. Multi-omics of the gut microbial ecosystem in inflammatory bowel diseases. Nature. 2019;569(7758):655–662.
- Arumugam M, Raes J, Pelletier E, et al. Enterotypes of the human gut microbiome. Nature. 2011;473(7346):174–180.
- Wu GD, Chen J, Hoffmann C, et al. Linking long-term dietary patterns with gut microbial enterotypes. Science. 2011;334(6052):105–108.
- Alipour M, Zaidi D, Valcheva R, et al. Mucosal barrier depletion and loss of bacterial diversity are primary abnormalities in paediatric ulcerative colitis. J Crohns Colitis. 2016;10(4):462–471.
- Sokol H, Seksik P, Rigottier-Gois L, et al. Specificities of the fecal microbiota in inflammatory bowel disease. Inflamm Bowel Dis. 2006;12:106–111.
- Swidsinski A, Ladhoff A, Pernthaler A, et al. Mucosal flora in inflammatory bowel disease. Gastroenterology. 2002;122:44–54.
- Abickova J, Gardlik R. Pathological and therapeutic interactions between bacteriophages, microbes and the host in inflammatory bowel disease. World J Gastroenterol. 2015;21(40):11321–11330.
- Martinez-Medina M, Garcia-Gil LJ. Escherichia coli in chronic inflammatory bowel diseases: An update on adherent invasive Escherichia coli pathogenicity. World J Gastrointest Pathophysiol. 2014;5(3):213–227.
- Mirsepasi-Lauridsen HC, Vallance BA, Krogfelt KA, et al. Escherichia coli pathobionts associated with inflammatory bowel disease. Clin Microbiol Rev. 2019;32(2):e00060–18.
- Yusta B, Holland D, Koehler JA, et al. ErbB signaling is required for the proliferative actions of GLP-2 in the murine gut. Gastroenterology. 2009;137(3):986–996.
- Muraro D, Simmons A. An integrative analysis of gene expression and molecular interaction data to identify dys-regulated sub-networks in inflammatory bowel disease. BMC Bioinformatics. 2016;17:42.
- Reedy AR, Luo L, Neish AS, et al. Commensal microbiota-induced redox signaling activates proliferative signals in the intestinal stem cell microenvironment. Development. 2019;146(3):dev171520.