
 ?Mathematical formulae have been encoded as MathML and are displayed in this HTML version using MathJax in order to improve their display. Uncheck the box to turn MathJax off. This feature requires Javascript. Click on a formula to zoom.
ABSTRACT
Non-small cell lung cancer (NSCLC) is one of the fatal tumors and is associated with a poor prognosis. Cell-type identification by estimating relative subsets of RNA transcripts (CIBERSORT) was used to quantify the proportions of 22 types of immune cells. Weighted gene co-expression network analysis (WGCNA) was established from the GSE37745 data, and key modules correlating most with CD8+ T cell infiltration were determined. Genes that manifested a high module connectivity in the key module were identified as hub genes. Three bioinformatics online databases were used to evaluate hub gene expression levels in tumor and normal tissues. Finally, survival analysis was conducted for these hub genes. In this study, we chose four hub genes (AURKB, CDC20, TPX2 and KIF2C) based on the comprehensive bioinformatics analyses. All hub genes were overexpressed in tumor tissue, and high expression of AURKB, CDC20, TPX2, and KIF2C correlated with the poor prognosis of these patients. In vitro experiments confirmed that CDC20 knockdown inhibited cell proliferation and growth. The above results indicated that AURKB, CDC20, TPX2, and KIF2C are potential CD8+ T cell infiltration-related biomarkers and therapeutic targets.
1. Introduction
Non-small cell lung cancer (NSCLC) accounts for 85% of all lung cancers, is difficult to treat and has a low survival rate. There are mainly two pathological types: lung adenocarcinoma (LUAD) and lung squamous cell carcinoma (LUSC) [Citation1]. Currently, several treatment strategies are used to treat lung cancer, including surgery, chemotherapy, radiotherapy and molecular targeted therapy [Citation2]. Surgery is the first treatment for early stage patients of NSCLC [Citation3]. Molecule-targeted therapies are rapidly being explored and developed in recent years [Citation4,Citation5]. However, subsequent studies have corroborated that target therapy is successful in LUAD, but LUSC lacks effective molecular targets [Citation6].Therefore, exploring novel therapeutic targets for targeted therapy is required. Most patients are diagnosed with NSCLC at an advanced stage, and their 5-year survival rate is significantly lower than that of early-stage patients. Thus, it is essential to identify reliable prognostic markers for cancer treatment. Although multiple studies have suggested that there are many prognostic markers of NSCLC, the specific mechanisms have not yet been completely elucidated and need to be studied systematically [Citation7,Citation8].
The progression of cancer not only depends on the pathologic stage and molecular features of the tumor, but also on the immune responses of the host. Studies have indicated that CD8+ lymphocytes infiltrating the tumor are associated with anti-tumor immune responses. The prognostic indicator value of CD8+ T lymphocytes has been identified in various forms of solid tumor types such as prostate, ovarian, pancreatic, breast and colorectal cancers [Citation9–13].Furthermore, CD8+ T lymphocytes levels have been associated with the effect of anti-PD-1 treatment in melanoma and mismatch repair deficient cancers, including NSCLC [Citation14]. Several studies have suggested that increased CD8+ T lymphocytes can serve as a good prognostic indicator for NSCLC [Citation15–17].
Bioinformatics technology has evolved rapidly, and many methodologies have emerged to discover disease-associated genes. Weighted gene co-expression network analysis (WGCNA) is a bioinformatics method based on transcriptome data analysis. It has been widely used to identify highly synergistically altered modules and discover important biomarker genes and potential therapeutic targets according to the correlation between modules and phenotypes, as well as the weight of the module genes [Citation18]. An increased number of studies have used tumor RNA sequence data to construct a co-expression module through WGCNA, and the relationship between modules and clinical characteristics (such as age, gender, stage, and pathological type) has previously been studied . In addition, the genes from the module of interest were functionally annotated, and the hub genes were identified based on the top connectivity in the module. Then, the clinical prognostic significance of the hub gene was explored, and the rationality of the hub gene as a cancer biomarker was identified [Citation19,Citation20]. Cell-type identification by estimating relative subsets of RNA transcripts (CIBERSORT) is another method that can estimate different cell type proportions [Citation21]. This method has been used to measure the immune cell levels in previous studies, including prostate, kidney and colon cancers [Citation22–24].
To identify tumor-infiltrating lymphocytes (TIL)-related biomarkers of NSCLC, in the current study, WGCNA was constructed and the correlation between the modules and T cell infiltration was analyzed based on microarray data in our research. We selected four genes with strong correlations between the key module and CD8+ T cell infiltration. We investigated the expression of hub genes using different databases and performed the survival analyses to evaluate their potential as prognostic biomarkers for NSCLC.
2. Material and methods
2.1 Data preprocessing
This study utilized data from a public database. The GSE37745 expression profiles of microarray data, including a total of 196 NSCLC samples, were retrieved from the Gene Expression Omnibus (GEO) database. The microarray data were quantile normalized using the package ‘limma’ in R language 4.0.0. Next, the normalized genes of the 196 samples were calculated for the coefficient of variation (CV). The gene with CV greater than 0.1 was regarded as the gene with the largest change and was selected for WGCNA analysis. The remaining genes were considered to express noise and were eliminated. CIBERSORT is a tool based on a deconvolution algorithm that can estimate the abundance of different cell types from bulk RNA sequencing data based on reference gene expression profiles that were downloaded from the official website (https://cibersort.stanford.edu/download.php).Here, the normalized data of GSE37745 were analyzed using the CIBERSORT package and 22 immune cell signatures were calculated as described in a previous study.
2.2 Weighted gene co-expression network analysis (WGCNA)
We used the R package ‘WGCNA’ to implement the weighted gene co-expression network [Citation18]. Pearson’s correlation between genes was calculated and the weighted adjacency matrix was obtained using the following equation:
Here, rij represents the correlation coefficient between the expression values of the ith and jth genes, and negative values are also included. After the power function processing, the value with a large correlation is not affected or the influence is small, and the value with a small correlation is significantly reduced. Finally, the appropriate β value was selected to make the Scale Free Topology Model Fit signed R2 greater than 0.8, and the slope of the regression line approximately −1, and the average connectivity is as large as possible. In this analysis, a strong correlation between genes was emphasized and a weak correlation was decreased based on the β value (β = 5). Next, the weighted adjacency matrix was converted to a topological overlap matrix (TOM), and the genes were clustered according to the degree of TOM-based dissimilarity. Each branch of the cluster representing genes with a high overlap was clustered together. The dynamic tree cut method divided the hierarchical clustering tree into modules and then the modules with high similarity were merged. Module eigengenes (MEs) represent gene expression in different modules. T cell infiltration levels were selected as the modular traits. Therefore, we evaluated the Pearson correlation between the MEs and the T cell infiltration and selected the module of interest.
2.3 Functional and pathways enrichment analysis
The gene in the key module was exported, and the ‘org.Hs.eg.db’ package was used to switch the gene name to entrezID. The ‘clusterProfiler’ package and the ‘ggplot2’ package were used to perform Gene Ontology (GO) and Kyoto Encyclopedia of Genes and Genomes (KEGG) enrichment analyses and visualization.
2.4 Hub genes investigation
Module-membership (MM) was evaluated as the connectivity between gene expression values and MEs, while the Gene-Significance (GS) represented the correlation between each gene and the T cell infiltration levels. Genes with larger GS values had a greater influence on traits, and genes with larger MM values were more correlated with modules. Genes in the key module with MM>0.8 and GS>0.3 were selected as candidate hub genes that were significantly related to T cell infiltration and were important genes in the module. The protein–protein interaction (PPI) network of key module genes was built using the STRING database and immediately visualized in Cytoscape. A plugin named cytoHubba was introduced to screen the important nodes from the network. Venn diagrams were used to display the overlap between important nodes in the PPI network and candidate hub genes, which were delineated using the online tool Draw Venn Diagram.
2.5 Validation of hub genes expression and kaplan-meier analysis
The following online database was used to explore the expression of hub genes at the mRNA and protein levels and analyze their clinical significance in NSCLC. The transcriptome profiles and clinical information of LUAD and LUSC were provided by the Cancer Genome Atlas (TCGA) project database. Differences in mRNA levels of hub genes between the tumor and normal samples were analyzed using R package ‘limma’ and ‘beeswarm’. The immunohistochemistry analysis results of the hub genes were retrieved from the HPA database, which contains the protein expression profiles of NSCLC. ONCOMINE is an online database of gene expression data for a variety of tumors. Microarray datasets publicly available from the Oncomine database were used to determine the expression patterns of the hub genes. The influence of different hub gene expression on the prognostic effect of NSCLC was evaluated using the Kaplan-Meier Plotter online tool (http://kmplot.com/analysis/).
2.6 Cell culture and transfection
A549 cells were purchased from the Cell Bank of the Chinese Academy of Sciences (Shanghai, China) and cultured in RPMI 1640 medium with 10% fetal bovine serum at 37°C and 5% CO2. To establish CDC20-knockdown cultures, oligo DNAs targeting CDC20 were synthesized and constructed into the pLenti-GFP vector. The shRNA sequences used were: sh-CDC20: CTTTGCACAGAACCAGCTAGT; nonsense shRNA, TTCTCCGAACGTGTCACGT(GeneChem, Shanghai, China).
2.7 RNA isolation and quantitative PCR
Total RNA was extracted and reverse‐transcribed into cDNA using the Takara MiniBEST Universal RNA Extraction Kit and Reverse Transcription Kit, respectively (Takara, Katsushika, Tokyo). PCR reactions were performed with SYBR® Premix Ex Taq™ in an ABI StepOne Plus cycler (Applied Biosystems, California, USA). The data were normalized to GAPDH as an endogenous control. Primer sequences were as follows: Forward, 5′-AGCAGCAGATGAGACCCTGAGG −3′ and reverse, 5′-CAGCGGATGCCTTGGTGGATG-3′ for CDC20; forward, 5′-CCAGCACCAGCAGACCAGAAG-3′ and reverse, 5′-CCGTCCTGAGCCGTGTCTCC −3′ for GAPDH.
2.8 Colony formation and CCK-8 assays
Colony-forming ability was assessed using a colony formation assay. Cells were seeded into six-well plates at 1000 cells/well and cultured for 14 days. The plates were then stained with 0.1% crystal violet and colonies were quantified. A CCK8 Kit (Biosharp, China) was used for the CCK8 assays. Briefly, cells were added to 96-well plates at 2,000 cells per well for 0, 24, 48, or 72 h. The absorbance values were obtained at 450 nm using a BioTek microplate reader and imager software (BioTek Instruments Inc.; USA).
2.9 Statistical analysis
Each experiment was repeated three times. Experimental data were statistically analyzed using GraphPad Prism 8.3 (GraphPad Prism Software, La Jolla, CA, USA) and SPSS (IBM SPSS 23.0, SPSS Inc) by Student’s t test, and P < 0.05 was considered statistically significant.
3. Results
3.1 Overview of the working flow and expression data processing
The workflow of this study is shown (). The general protocol of this study was as follows: the microarray data in GSE37745 were converted into a gene expression matrix, and 4337 genes were identified with CV>0.1. At the same time, the CIBERSORT algorithm was used to evaluate the infiltration level of 22 types of immune cells and the data of seven types of T cells were selected for further research. A co-expression network was constructed using 4337 gene expression data and 7 T cell infiltration level data from 196 samples. The module of interest was selected as the key module for the internal calculation of the module and the construction of the protein interaction network using genes in the key module. Candidate hub genes were obtained by setting appropriate cutoff reference values for the calculation results of the module. The intersection of the two was considered to obtain the hub gene. Finally, we verified the hub genes using several online databases and conducted in vitro experiments. Among the dataset GSE37745, there were 106 cases of LUAD, 66 cases of LUSC, and 24 cases of large cell carcinoma. Genes with CV of expression levels > 0.1 were screened and a total of 4337 genes were identified; these are displayed in Supplementary Table1.
Figure 1. Workflow of the study design
3.2 Tumor-infiltrating immune cells analysis
CIBERSORT is an algorithm that transforms the gene expression matrix into an abundance of immune infiltrates. Therefore, the abundance of 22 immune cells was obtained using the R package CIBERSORT with 4337 gene expression data of 196 samples, and p < 0.05 was set as the filter criterion. The levels of seven subtypes of T cell infiltration were chosen for subsequent study and are shown in Supplementary Table 2.
3.3 Construction of co-expression modules
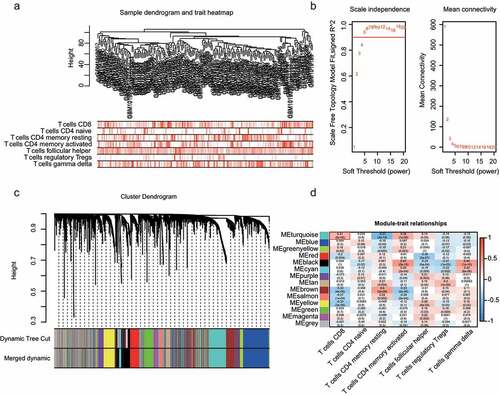
The R package WGCNA was used to implement the co-expression network. The 196 samples of GSE37745 were clustered using the Pearson correlation and average linkage methods (). For scale-free network construction, unary linear regression was used to obtain the best soft-thresholding power β = 5 (scale-free R2 = 0.95) (). Fourteen modules were identified after preprocessing hierarchical clustering (). The turquoise module exhibited the highest correlation with CD8 + T cells (); hence, it was selected as the key module and was used for further exploration.
Figure 2. WGCNA analysis and module identification. a) Sample dendrogram and trait indicator. b) The scale-free index and mean connectivity of different soft-threshold powers (β). c) Construction of gene co-expression modules. d) Correlation analysis of different modules and T-cell infiltration
3.4 Functional and pathway enrichment analysis
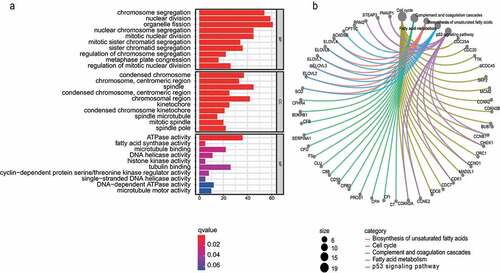
To further reveal the biological function distribution of the key module, we performed functional annotation of genes in the key module. GO functional analysis of the genes in the turquoise module was performed according to three different functional groups (BP, CC, and MF). In the BP group, genes were mainly clustered in organelle fission, chromosome segregation and nuclear division. In the CC term, genes were primarily enriched in the condensed chromosomes, spindles and chromosomal regions. In the MF category, genes were significantly enriched in ATPase activity, tubulin binding, and microtubule binding (). Pathway analysis was performed using KEGG database. The results indicated that these genes were mapped to the cell cycle, complement and coagulation cascades. ().
Figure 3. GO and KEGG analysis. a) GO enrichment analysis of the turquoise module genes. b) KEGG pathway analysis of turquoise module genes
3.5 Identification of hub genes
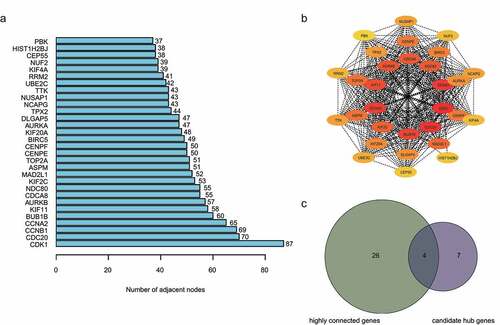
By setting up the cut-off point (MM>0.8 and GS>0.3), 11 candidate hub genes were identified from the turquoise module, as shown in Supplementary Table 3. Subsequently, PPI networks were retrieved using the STRING database and Cytoscape software. CytoHubba was used to predict highly connected genes in the PPI network. The top 30 highly connected genes were selected and visualized (, b). Using integrated bioinformatics analysis, we identified four genes (AURKB, CDC20, TPX2 and KIF2C) between the top 30 highly connected genes and 11 candidate hub genes ().
Figure 4. Identification of hub genes. a) Top 30 targets in the protein–protein interaction (PPI) network. b) Top sub‐network from PPI network. c) Hub genes were selected based on overlap between highly connected genes and candidate hub genes
3.6 Validation of the hub genes
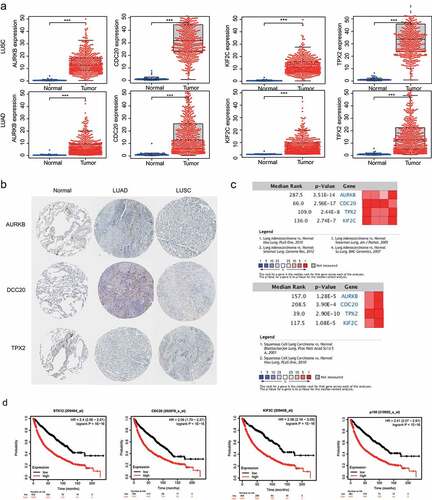
To investigate the mRNA levels of the four identified genes, we downloaded the expression profiling data from TCGA database and found that the genes exhibited higher expression levels in tumor tissue than in non-tumor tissue (). To verify the protein expression of the four genes, we downloaded the immunohistochemical images from the HPA database and found that the expression of the hub gene was higher in tumor cells than in stromal cells (). A meta‐analysis of the expression from the Oncomine database was undertaken to validate the differential expression of the four genes. The median rank values and p values in the meta-analysis of the LUAD and LUSC datasets of the four genes are displayed in . The results showed that the four hub genes were upregulated in LUAD and LUSC, which is similar to the results of the TCGA database. The prognostic significance of the four hub genes in NSCLC was evaluated using an online website. The results of the Kaplan–Meier plotter analysis demonstrated that elevated mRNA expression was significantly associated with poor overall survival in NSCLC (). The results from the above database analysis proved that AURKB, CDC20, KIF2C and TPX2 were significantly upregulated in NSCLC, and the upregulated expression indicated a poor prognosis. Therefore, we suggest that AURKB, CDC20, KIF2C and TPX2 are meaningful prognostic markers in NSCLC.
Figure 5. Validation of the hub genes. a) Validation of hub gene mRNA expression in TCGA database. b) Differential expressed genes identified in the HPA database. c) Summary of meta-analysis of datasets from Oncomine database, red denotes significant overexpression. d) Overall survival (OS) analysis of the four hub genes
3.7 Knockdown of CDC20 inhibited cell proliferation
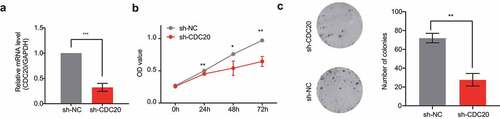
To further explore the function of CDC20 in NSCLC, CDC20 was knock down in A549 cells using lentivirus-mediated gene knockdown. The qRT-PCR results revealed that knockdown of CDC20 was efficient at the mRNA level in shCDC20 infected A549 cells compared to the negative control group (). Notably, CCK8 assay results of CCK8 showed that knockdown of CDC20 inhibited A549 cell proliferation and growth (). Finally, colony-formation assays showed that the clonogenic ability of the shCDC20 group was damaged compared to that of the negative control group. ().
Figure 6. Effects of knocking down of CDC20. a) Analysis of CDC20 mRNA levels in cells that transfected with sh‐NC or sh‐CDC20. b-c) CCK-8 and colony formation assay results showing the inhibition of cell proliferation by CDC20 knockdown
4. Discussion
As a classic bulk RNA deconvolution tool, CIBERSORT can predict the unknown cell components of each cell type in bulk RNA based on the signature gene expression matrix and has been widely employed [Citation21].Zheng et al. have used the CIBERSORT algorithm to analyze the extent of immune infiltration in LUAD, and utilizing a consensus clustering approach, screened prognostic-related immune genes. Finally, they built a risk prediction model based on these genes [Citation25]. Zhou et al. used CIBERSORT to construct a diagnostic model called the diagnostic immune risk score, and combined it with clinical features to predict the prognosis of colon cancer [Citation22].
NSCLC is one of the most aggressive cancers and is characterized by rapid cancer progression and poor prognosis. Evidence suggests that poor outcomes in NSCLC patients are associated with CD8+ T cell infiltration, and the number of CD8+ T cell may serve as a marker for patient prognosis [Citation26]. In this study, we used tumor microarray data and the T cell infiltration level to build a co-expression network. The turquoise module, which was mostly associated with CD8+ T cell, was identified as a key module. Functional and pathway enrichment analyses indicated that genes in the key module were mainly enriched in the cell cycle. We precisely identified the hub genes (AURKB, CDC20, KIF2C, and TPX2) by measuring the module membership significance and protein-protein interactions. Another dataset from TCGA was used to validate these four candidate genes. Using the Oncomine microarray database, we demonstrated that the expression of these genes is increased in cancer tissues. Finally, the four hub genes were evaluated using Kaplan‐Meier analysis. A statistically significant correlation was identified between the hub gene expression and the clinical outcomes. Based on the combined analyses, we identified four hub genes associated with CD8+ T cell infiltration level, and propose a possible mechanism contributing significantly to the malignant progression of NSCLC.
Aurora kinase B (AURKB) belongs to the serine/threonine kinase family, which is a ubiquitously expressed mitotic kinase [Citation27]. AURKB participates in cell division by regulating chromatin condensation, chromosome biorientation, and cytokinesis [Citation28].In addition to cell division functions, attention has been paid to AURKB in different pathophysiological contexts. Upregulation of AURKB is associated with infinite cell multiplication and avoidance of the apoptotic mechanism in multiple tumors [Citation29,Citation30]. Yu et al. confirmed that abnormal expression levels of AURKB are closely related to poor disease-free survival and overall survival in NSCLC [Citation31].Similarly, accumulating evidence has shown that upregulation of AURKB is associated with adverse grade of tumor differentiation, lymph node metastasis, and genetic instability [Citation32].
Cell division cycle 20 (CDC20) can interact with other proteins during key cell cycle processes [Citation33]. It was recently reported that upregulation of CDC20 is significant correlated with poor prognosis in lung, gastric, colorectal carcinoma, and prostate cancer [Citation34,Citation35]. It has been demonstrated that overexpression of CDC20 is more likely to bypass the spindle assembly checkpoint (SAC) and prematurely exit mitosis, which consequently leads to genomic instability [Citation36]. More importantly, CDC20 expression in tumor initiating cells (TICs) enhances their tumorigenic capacity in vivo and plays an important role in tumor growth [Citation37]. Abnormally high expression of CDC20 has also been implicated in the Wnt/β-catenin pathway, an important signaling pathway in tumor progression [Citation38]. Collectively, CDC20 can participate in tumorigenesis or progression through several pathways via numerous and diverse mechanisms.
Kinesin family member 2 C (KIF2C) belongs to the kinesin superfamily and participates in chromosome segregation, suggesting its oncogenic role in a multitude of cancers [Citation39]. Besides, KIF2C participates in spindle assembly and microtubule disaggregation, regulating cell cycle progression during mitosis [Citation40,Citation41].As reported by Sacha et al, KIF2C is highly expressed in colorectal cancer and its expression levels are associated with the proliferation capacity of cancer cells. They also noted that KIF2C can induce spontaneous CD41 T cell responses of the Th1-type, which are tightly regulated by peripheral T regulatory cells [Citation42]. Similarly, the progression of the cell cycle can be regulated by KIF2C, which might result in poor prognosis of lung adenocarcinoma and gliomas [Citation43].
Targeting protein for Xenopus kinesin-like protein 2 (TPX2) is a microtubule-related protein that participates in regulating cell proliferation, spindle morphogenesis, apoptosis and cell division [Citation44].Moreover, cumulative data indicate that TPX2 acts as a key oncogene in various types of cancers. For instance, TPX2 mediated MMP2 and MMP9 upregulation promoted the malignant progression of breast cancer [Citation45].Furthermore, TPX2 can reduce cell proliferation and increase cell apoptosis in breast cancer by regulating the PI3k/AKT/p21 and p53 pathways [Citation46].There is evidence that TPX2 is correlated with the infiltration of immune cells and immune checkpoint expression in hepatic cell cancer, suggesting an underlying immune regulatory function in the tumor immune response [Citation47].
Previous studies have shown that CD8 +T lymphocytes have a positive prognostic effect in non-small cell lung cancer [Citation15]. Interestingly, the hub genes selected in the CD8+T cell module suggested a poor clinical prognosis. This is probably due to the complexity of the tumor immune microenvironment and the diverse roles played by these genes. First, genes that were positively related to the level of T cell infiltration may be involved in the inhibition of T cell function and induction of T cell incompetence. For example, Li et al. demonstrated that the abundance of CD8+ T cells in LUAD and LUSC was positively correlated with the expression levels of the common inhibitory molecule receptors CTLA4, PD-1, LAG3, and TIM3, which can inhibit the antitumor activity of CD8+ T cells [Citation48]. In addition, the four hub genes have been reported to be associated with the occurrence and development of tumors. The in vitro experiments conducted in this study also illustrate this point. In general, even if the hub genes are positively correlated with CD8+ T cells, they may be unfavorable prognostic factors for NSCLC.
5. Conclusions
In our study, hub genes related to CD8+ T cell infiltration were identified using the WGCNA and CIBERSORT algorithms. All four hub genes were highly expressed in tumor tissues and were involved in promoting tumor progression. Furthermore, in vitro experiments verified that CDC20 suppressed the proliferation of NSCLC cells. However, there are some limitations to our research. More importance must be given to hub genes and further in-depth investigations into the molecular mechanisms underlying the role of the four hub genes are warranted.
Abbreviations
NSCLC, Non-small cell lung cancer; WGCNA, weighted gene co-expression network analysis; TCGA, The Cancer Genome Atlas; HPA, The Human Protein Atlas; SCLC, small cell lung cancer; LUAD, lung adenocarcinoma; LUSC, lung squamous cell carcinoma; EGFR, epidermal growth factor receptor; ALK, anaplastic lymphoma kinase; CIBERSORT,Cell type Identification by Estimating Relative Subsets of RNA Transcripts; TIL, tumor infiltrating lymphocytes; GEO, the Gene Expression Omnibus; MEs, module eigengenes; GO, gene ontology; KEGG, kyoto encyclopedia of genes; MM, Module-Membership; GS, Gene-Significance; PPI, protein–protein interaction; CV, coefficient of variation.
Contribution
BLC and WQL designed the study. BLC, XWX, FFL and WQL acquired and analyzed the data. BLC and FFL contributed to data analysis and manuscript preparation. All authors contributed toward data analysis, drafting, and revising the paper, and agree to be accountable for all aspects of the work.
Highlights
(1) AURKB, CDC20, TPX2 and KIF2C are potential underlying prognostic factors in NSCLC.
(2) Comprehensive bioinformatics methods can explore factors related to prognosis.
(3) Genes related to CD8+ T cells play an important role in prognosis of NSCLC.
Supplemental Material
Download ()Acknowledgements
The authors extend their appreciation to the Scientific Research and Technology Development Program of Guangxi (NO. AB18221080) for the financial support.
Disclosure statement
The authors declare that they have no known competing financial interests or personal relationships that could have appeared to influence the work reported in this paper.
Supplementary material
Supplemental data for this article can be accessed here.
Additional information
Funding
References
- Siegel RL, Miller KD, Fuchs HE, et al. Cancer statistics, 2021. CA Cancer J Clin. 2021;71(1):7–33.
- Wood SL, Pernemalm M, Crosbie PA, et al. Molecular histology of lung cancer: from targets to treatments. Cancer Treat Rev. 2015;41(4):361–375.
- Cheung CHY, Juan HF. Quantitative proteomics in lung cancer. J Biomed Sci. 2017;24(1):37.
- Oberndorfer F, Müllauer L. Molecular pathology of lung cancer: current status and perspectives. Curr Opin Oncol. 2018;30(2):69–76.
- Yu KH, Zhang C, Berry GJ, et al. Predicting non-small cell lung cancer prognosis by fully automated microscopic pathology image features. Nat Commun. 2016;7(1):12474.
- Piperdi B, Merla A, Perez-Soler R, et al. Targeting angiogenesis in squamous non-small cell lung cancer. Drugs. 2014;74(4):403–413.
- Camidge DR, Doebele RC, Kerr KM, et al. Comparing and contrasting predictive biomarkers for immunotherapy and targeted therapy of NSCLC. Nat Rev Clin Oncol. 2019;16(6):341–355.
- Osmani L, Askin F, Gabrielson E, et al. Current WHO guidelines and the critical role of immunohistochemical markers in the subclassification of non-small cell lung carcinoma (NSCLC): moving from targeted therapy to immunotherapy. Semin Cancer Biol. 2018;52(1):103–109.
- Fukunaga A, Miyamoto M, Cho Y, et al. CD8+ tumor-infiltrating lymphocytes together with CD4+ tumor-infiltrating lymphocytes and dendritic cells improve the prognosis of patients with pancreatic adenocarcinoma. Pancreas. 2004;28(1):e26–31.
- Mlecnik B, Tosolini M, Kirilovsky A, et al. Histopathologic-based prognostic factors of colorectal cancers are associated with the state of the local immune reaction. J Clin Oncol. 2011;29(6):610–618.
- Richardsen E, Uglehus RD, Due J, et al. The prognostic impact of M-CSF, CSF-1 receptor, CD68 and CD3 in prostatic carcinoma. Histopathology. 2008;53(1):30–38.
- Hamanishi J, Mandai M, Iwasaki M, et al. Programmed cell death 1 ligand 1 and tumor-infiltrating CD8+ T lymphocytes are prognostic factors of human ovarian cancer. Proc Natl Acad Sci U S A. 2007;104(9):3360–3365.
- Nakano O, Sato M, Naito Y, et al. Proliferative activity of intratumoral CD8(+) T-lymphocytes as a prognostic factor in human renal cell carcinoma: clinicopathologic demonstration of antitumor immunity. Cancer Res. 2001;61(13):5132–5136.
- Tumeh PC, Harview CL, Yearley JH, et al. PD-1 blockade induces responses by inhibiting adaptive immune resistance. Nature. 2014;515(7528):568–571.
- Kawai O, Ishii G, Kubota K, et al. Predominant infiltration of macrophages and CD8(+) T cells in cancer nests is a significant predictor of survival in stage IV nonsmall cell lung cancer. Cancer. 2008;113(6):1387–1395.
- Al-Shibli KI, Donnem T, Al-Saad S, et al. Prognostic effect of epithelial and stromal lymphocyte infiltration in non-small cell lung cancer. Clin Cancer Res. 2008;14(16):5220–5227.
- Ito N, Suzuki Y, Taniguchi Y, et al. Prognostic significance of T helper 1 and 2 and T cytotoxic 1 and 2 cells in patients with non-small cell lung cancer. Anticancer Res. 2005;25(3b):2027–2031.
- Langfelder P, Horvath S. WGCNA: an R package for weighted correlation network analysis. BMC Bioinformatics. 2008;9(1):559.
- Wan Q, Tang J, Han Y, et al. Co-expression modules construction by WGCNA and identify potential prognostic markers of uveal melanoma. Exp Eye Res. 2018;166:13–20.
- Tian Z, He W, Tang J, et al. Identification of important modules and biomarkers in breast cancer based on WGCNA. Onco Targets Ther. 2020;13:6805–6817.
- Newman AM, Liu CL, Green MR, et al. Robust enumeration of cell subsets from tissue expression profiles. Nat Methods. 2015;12(5):453–457.
- Zhou R, Zhang J, Zeng D, et al. Immune cell infiltration as a biomarker for the diagnosis and prognosis of stage I-III colon cancer. Cancer Immunol Immunother. 2019;68(3):433–442.
- Zhang S, Zhang E, Long J, et al. Immune infiltration in renal cell carcinoma. Cancer Sci. 2019;110(5):1564–1572.
- Zhao SG, Lehrer J, Chang SL, et al. The immune landscape of prostate cancer and nomination of PD-L2 as a potential therapeutic target. J Natl Cancer Inst. 2019;111(3):301–310.
- Zheng Y, Tian H, Zhou Z, et al. A novel immune-related prognostic model for response to immunotherapy and survival in patients with lung adenocarcinoma. Front Cell Dev Biol. 2021;9:651406.
- Fumet JD, Richard C, Ledys F, et al. Prognostic and predictive role of CD8 and PD-L1 determination in lung tumor tissue of patients under anti-PD-1 therapy. Br J Cancer. 2018;119(8):950–960.
- Fu J, Bian M, Jiang Q, et al. Roles of aurora kinases in mitosis and tumorigenesis. Mol Cancer Res. 2007;5(1):1–10.
- Lampson MA, Cheeseman IM. Sensing centromere tension: aurora B and the regulation of kinetochore function. Trends Cell Biol. 2011;21(3):133–140.
- Sorrentino R, Libertini S, Pallante PL, et al. Aurora B overexpression associates with the thyroid carcinoma undifferentiated phenotype and is required for thyroid carcinoma cell proliferation. J Clin Endocrinol Metab. 2005;90(2):928–935.
- Jha HC, Lu J, Saha A, et al. EBNA3C-mediated regulation of aurora kinase B contributes to epstein-barr virus-induced B-cell proliferation through modulation of the activities of the retinoblastoma protein and apoptotic caspases. J Virol. 2013;87(22):12121–12138.
- Yu J, Zhou J, Xu F, et al. High expression of aurora-B is correlated with poor prognosis and drug resistance in non-small cell lung cancer. Int J Biol Markers. 2018;33(2):215–221.
- Hayama S, Daigo Y, Yamabuki T, et al. Phosphorylation and activation of cell division cycle associated 8 by aurora kinase B plays a significant role in human lung carcinogenesis. Cancer Res. 2007;67(9):4113–4122.
- Zhang MY, Liu XX, Li H, et al. Elevated mRNA levels of AURKA, CDC20 and TPX2 are associated with poor prognosis of smoking related lung adenocarcinoma using bioinformatics analysis. Int J Med Sci. 2018;15(14):1676–1685.
- Gujar AD, Yano H, Kim AH, et al. The CDC20-APC/SOX2 signaling axis: an achilles’ heel for glioblastoma. Mol Cell Oncol. 2016;3(3):e1075644.
- Garg M, Maurya N. WNT/β-catenin signaling in urothelial carcinoma of bladder. World J Nephrol. 2019;8(5):83–94.
- Zhang Q, Huang H, Liu A, et al. Cell division cycle 20 (CDC20) drives prostate cancer progression via stabilization of β-catenin in cancer stem-like cells. EBioMedicine. 2019;42:397–407.
- Chu Z, Zhang X, Li Q, et al. CDC20 contributes to the development of human cutaneous squamous cell carcinoma through the Wnt/β‑catenin signaling pathway. Int J Oncol. 2019;54(5):1534–1544.
- Zhan T, Rindtorff N, Boutros M, et al. Wnt signaling in cancer. Oncogene. 2017;36(11):1461–1473.
- Zhang L, Shao H, Huang Y, et al. PLK1 phosphorylates mitotic centromere-associated kinesin and promotes its depolymerase activity. J Biol Chem. 2011;286(4):3033–3046.
- Kline-Smith SL, Khodjakov A, Hergert P, et al. Depletion of centromeric MCAK leads to chromosome congression and segregation defects due to improper kinetochore attachments. Mol Biol Cell. 2004;15(3):1146–1159.
- Howard J, Hyman AA. Microtubule polymerases and depolymerases. Curr Opin Cell Biol. 2007;19(1):31–35.
- Gnjatic S, Cao Y, Reichelt U, et al. NY-CO-58/KIF2C is overexpressed in a variety of solid tumors and induces frequent T cell responses in patients with colorectal cancer. Int J Cancer. 2010;127(2):381–393.
- Bai Y, Xiong L, Zhu M, et al. Co-expression network analysis identified KIF2C in association with progression and prognosis in lung adenocarcinoma. Cancer Biomark. 2019;24(3):371–382.
- Wieczorek M, Bechstedt S, Chaaban S, et al. Microtubule-associated proteins control the kinetics of microtubule nucleation. Nat Cell Biol. 2015;17(7):907–916.
- Yang Y, Li DP, Shen N, et al. TPX2 promotes migration and invasion of human breast cancer cells. Asian Pac J Trop Med. 2015;8(12):1064–1070.
- Chen M, Zhang H, Zhang G, et al. Targeting TPX2 suppresses proliferation and promotes apoptosis via repression of the PI3k/AKT/P21 signaling pathway and activation of p53 pathway in breast cancer. Biochem Biophys Res Commun. 2018;507(1–4):74–82.
- Zhu H, Liu J, Feng J, et al. Overexpression of TPX2 predicts poor clinical outcome and is associated with immune infiltration in hepatic cell cancer. Medicine (Baltimore). 2020;99(49):e23554.
- Li B, Severson E, Pignon JC, et al. Comprehensive analyses of tumor immunity: implications for cancer immunotherapy. Genome Biol. 2016;17(1):174.