
ABSTRACT
Pancreatic duct adenocarcinoma (PDAC) is an aggressive and lethal malignancy. Pancreatic cancer stem cells (PCSCs) are assumed to contribute to the initiation and invasion of PDAC. In this study, we performed single-cell RNA sequencing (scRNA-seq) analysis of PDAC tumor samples from patients and control pancreas tissues to reveal the transformation process of cancer stem cell (CSC)-like ductal cells into ductal cells with invasive potential and we screened out CSC-related genes (CRGs). Subsequently, we applied LASSO and Cox regression models to identify five CRGs with potential prognostic values and constructed a risk prognostic model using the Cancer Genome Atlas datasets. The risk models were verified using Gene Expression Omnibus datasets. Patients in the high-risk group had a significantly poor overall survival (Pvalue<0.0001), as illustrated by the Kaplan-Meier survival curve, and the area under the curve confirmed the accuracy of predictions by our risk model. Tumor mutation burden variations were used to further explore the differences between the two risk cohorts. In addition, the Human Protein Atlas was used to investigate the protein expression of five hub CRGs. In brief, we utilized scRNA-seq to reveal the invasive trajectory of ductal cells and identified crucial CRGs in PDAC, which may help predict patient survival and provide potential clinical therapeutic targets against CSCs.
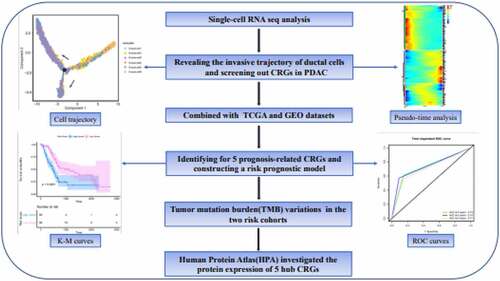
Graphical abstract
1. Introduction
Pancreatic cancer (PC) is highly malignant and has a poor prognosis. Approximately 90% of PC cases are pancreatic ductal adenocarcinoma (PDAC) [Citation1]. As one of the seven most lethal tumors in the world, the five-year survival rate of PDAC is less than 5%. With the development of modern medical technology, the treatment of many tumors has made considerable advances. Unfortunately, the efficacy of PC therapeutic intervention, from prevention, diagnosis, treatment, and prognosis, remains poor, and as society’s diet has changed, the incidence of this disease is increasing [Citation2].
Cancer stem cells (CSCs) are primitive, undifferentiated cells with characteristics similar to normal stem cells [Citation3]. Although the proportion of CSCs in solid tumors is extremely low (only 1–3% in PDAC), their ability for self-renewal, immune escape, and the production of heterogeneous tumor cells contributes to the occurrence, metastasis, and drug resistance of PDAC [Citation4,Citation5]. CD44 is a CSC biomarker that indicates a poor prognosis in PC patients. Its high expression in PDAC enhances the ability of tumor cells to self-renew and differentiate into different progeny cancer cell types [Citation6,Citation7]. Furthermore, the pancreatic CSC population with CD133 expression has been found to exhibit higher tumorigenicity, metastatic phenotype, and chemotherapeutic drug resistance than CD133− cells [Citation8]. Although a portion of potential CSC-targeting drugs have entered pre-clinical trials, pancreatic cancer stem cells (PCSCs) are not sensitive to chemotherapy drugs, which remains a challenge [Citation9]. Hence, there is an urgent need to investigate the underlying molecular targets and prognostic biomarkers to improve patient survival.
Single-cell RNA sequencing (ScRNA-seq) was used to explore cell heterogeneity and identify rare cells in heterogeneous cell populations. In contrast to traditional bulk RNA-seq, scRNA-seq will help people understand the changes in cellular genes, transcription, or epigenetic modifications during disease progression [Citation10]. Currently, scRNA-seq has been widely used in various types of disease research, including in breast cancer and pancreatic cancer [Citation11,Citation12]. Here, we utilized scRNA-seq to delineate the heterogeneity and invasive trajectory of ductal cells. Through the integration of multiple database analysis, we constructed and validated a robust molecular signature of CSC-related genes (CRGs) for determining the survival prognosis of PC patients. In addition, the differential landscape of somatic tumor mutation burden (TMB) between the two risk cohorts may provide a potential target for individualized therapy. In this study, we aimed to reveal the invasion trajectory of ductal cells during PDAC progression and identify a reliable CRG prognostic signature and a potential therapeutic target for PC.
2. Materials and methods
2.1 ScRNA-seq data analysis
2.1.1 ScRNA-seq data preparation
In this study, 24 patients diagnosed with PDAC and 11 patients with malignant tumors other than PDAC were selected for single-cell analysis (https://bigd.big.ac.cn/bioproject/browse/PRJCA001063) [Citation12]. FASTQ data were quantified and compared to the human reference genome (hg38) using the CellRanger (3.1) algorithm to obtain the original sequencing data matrix [Citation13].
2.1.2 ScRNA-seq data processing
For nFeature_RNA < 200, mitochondrial sequencing count > 15% and ribosome sequencing count > 50% of the cells were excluded, and then ‘Doubletfinder’ package [Citation14] was applied to filter out transitional cells or double cells; the parameters were set as the default parameters. Normalization and sequencing batch effects were removed by ‘Seurat’ package and ‘harmony’ package, respectively [Citation15]. Next, we used ‘FindVariableFeatures’ to calculate highly variable genes, and used the resulting output for principal component analysis (PCA). The top 10 principal components (PCs) were selected for subsequent uniform manifold approximation and projection for dimension reduction analysis [Citation16]. We determined cell types based on reported biomarkers, and re-clustering of ductal cells was performed using the same approach.
The organizational contribution rate measured the origin of tissue cells in different ductal cell types. The ratio of cells from normal or tumor tissues to total cells in each subgroup was used to determine the organization expectation matrix of subgroups.
2.1.3 Chromosomal copy number alterations and pseudo-time trajectories analysis
In this study, we used the ‘InferCNV’ package [Citation17] to explore the chromosomal copy number alterations (CNA) of single cell RNA-seq data. Cells from normal tissue were used as a reference. The total number of CNA cells was calculated according to the scRNA-seq of each cell. The threshold for average gene expression was set to 0.1. Single-cell pseudo-time analysis was established by Monocle 2 [Citation18]. Based on PCA loading, we selected a set of ordering genes that were expressed in at least 15% of all cells. ‘DDRTree’ was applied to reduce the dimensionality of high-dimensional data, which helps determine the trajectory of ductal cells. ‘DifferentialGeneTest’ described differentially expressed gene variations over pseudo-time during ductal cell transformation.
2.2 Bulk RNA-seq data and clinical data preparation
We obtained the transcriptional profiles and clinicopathological information of 177 PDAC patients from the Cancer Genome Atlas (TCGA) database (https://portal.gdc.cancer.gov/)(Supplementary Table 1). In addition, we screened GSE62452 and GSE79688 as independent external validation datasets using the Gene Expression Omnibus (GEO) database (https://www.ncbi.nlm.nih.gov/geo/). Samples with vague or absent information on the clinical outcome were excluded.(Supplementary Table 2)
2.3 Identification of the key prognostic genes and establishment and evaluation of models
First, we applied a univariate Cox regression model to screen molecules from 202 CRGs, which were significantly related to the overall survival (OS) of PDAC. Statistical significance was set at Pvalue < 0.05. Thereafter, LASSO regression [Citation19] analysis was performed on these genes, and only the genes with non-zero coefficients in LASSO regression analysis were selected for further multivariate Cox regression analysis. Finally, we determined five CSC-related prognostic signatures and constructed a risk-predictive model. The risk score formula was as follows: risk score = ExpressionmRNA1 × CoefficientmRNA1 + ExpressionmRNA2 × CoefficientmRNA2 + ··· ExpressionmRNAn × CoefficientmRNAn [Citation20].
Based on the median risk score, we classified patients into high- or low-risk groups. The superiority of our risk model was evaluated using Kaplan-Meier analysis and the area under the curve (AUC) value of the ROC curve.
2.4 Analysis of somatic TMB in two cohorts
We obtained mutation information of PC patients from TCGA database, including base deletions, insertions, and substitutions. Next, we divided the patients into either high- or low-risk cohorts based on their risk scores to analyze their somatic mutation characteristics. The ‘Maftools’ package [Citation21] illustrated the respective mutation profiling and Fisher’s exact test detected different mutant genes in the two cohorts; Pvalue <0.05 was defined as the threshold. Moreover, the co-occurrence and mutual exclusion analysis of gene mutations were performed on each cohort through discrete independence statistical controlling for observations with varying event rate (DISCOVER) exact test. Of course, we also analyzed the survival significance of KRAS mutations in the different risk groups.
2.5 Statistical analysis
Statistical analyses were performed using RStudio and IBM SPSS Statistics 26. ‘edgeR’ package [Citation22] was used for differential expression analysis, with |log2FC| > 1 and Pvalue < 0.05 as screening criteria. The ‘glmnet’ package [Citation19] was used to conduct the Lasso COX regression modeling. The ‘survminer’ and ‘timeROC’ packages were applied to survival analysis and model evaluation, respectively.
3. Results
3.1. ScRNA-seq revealed the heterogeneity of ductal cells
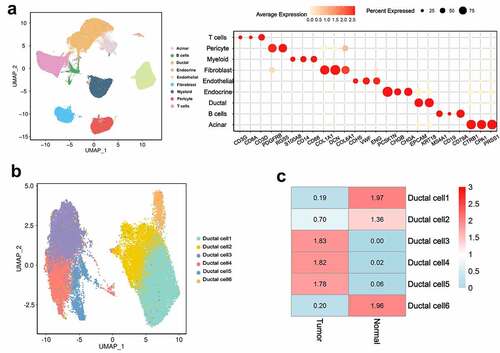
High intratumoral heterogeneity leads to malignant progression and the tolerance of tumor cells in PDAC to treatment [Citation12]. We applied scRNA-seq to analyze the transcription profiles of single cells from 24 PDAC tumor samples from patients and 11 control pancreas tissue samples. After a strict quality control, 458,664,164 transcripts of 121,883 cells were obtained. Next, by removing the sequencing batch effect and applying PCA to the specific high expression genes of each subgroup, we identified nine main clusters: endocrine, acinar, endothelial, ductal, myeloid, fibroblast, pericyte, T, and B cells ()).
To further describe the heterogeneity of ductal cells, 33,553 ductal cells from tumors and control pancreas tissues were selected for re-clustering. The results showed that all ductal cells were divided into six subcellular groups ()). The organizational contribution ratio indicated that clusters 1 and 6 had a very low proportion of cells derived from tumor tissue, whereas clusters 3, 4, and 5 were significantly enriched in tumor tissue. Compared with the other clusters, cluster 2 possessed normal tissue specificity, but a number of cells were derived from tumor tissue ()).
Figure 1. ScRNA-seq analysis reveals a variety of cell types in PDAC and control pancreas
3.2. The status of different ductal cell types
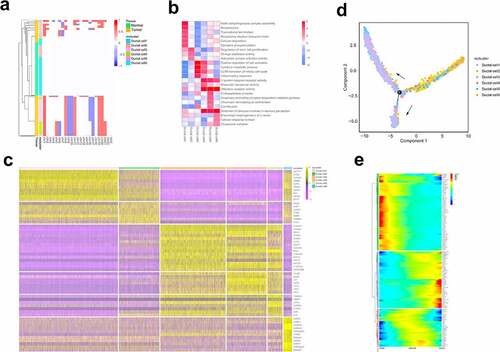
Changes in chromosome structure and number often accompany the development of tumors [Citation23]. To define the malignant status of ductal cells, we calculated large-scale chromosomal copy number variation (CNV) in each cell type based on averaged expression patterns across intervals of the genome [Citation12]. The results demonstrated that the cells in control samples had almost no changes in CNV. In contrast, cells in clusters 3, 4, and 5 were most enriched in tumor tissue, which exhibited remarkably high CNV levels. Surprisingly, cells from tumor tissues in cluster 2 also showed CNV of three chromosomes, in which the loss of 7q chromosome was significantly enriched in cluster 2, and has been previously reported to be associated with the early stage of PDAC tumor formation ()) [Citation24].
Different transcription patterns among cell clusters suggest different cellular behaviors. Based on the expression and functional enrichment of specific genes in each subgroup (), we found that cluster 1 primarily expressed acinar epithelial-related genes, such as PRSS1 and CLPS [Citation25]. Heat shock protein-related genes in cluster 6 are involved in protein transport and folding of ductal cells [Citation26]. Clusters 3, 4, and 5 primarily expressed genes related to the proliferation and invasion potential of cells. For example, NEAT1 is associated with unlimited tumor proliferation and escape growth inhibition [Citation27]. CEACAM6, as a novel tumor marker of PDAC, has been reported to be related to tumor proliferation and metastasis [Citation28], and S100p has also been shown to play an important role in lymph node metastasis and the distant metastasis of pancreatic cancer cells [Citation29]. Compared with others, cluster 2 showed relatively higher expression of CSC-related genes and was involved in regulating stem cell proliferation. The CCl2-CCR2 axis has been reported in pancreatic cancer to direct the chemotactic movement of endothelial cells and to recruit tumor-related macrophages to secrete VEGF and TGFβ, promoting tumor formation and angiogenesis [Citation30].
3.3. Trajectory analysis of ductal cells
Cluster 2 showed CSC-like signatures, whereas clusters 3, 4, and 5 were related to malignant proliferation and distant invasion of cells. We speculated that scRNA-seq may capture the main transformation processes of CSC-like ductal cells during tumor progression. We then applied Monocle 2 to conduct a pseudo-time analysis of ductal cells to further verify our hypothesis. The single-cell trajectory analysis results showed that pancreatic duct cells originated from clusters 1 and 6, transitioned to cluster 2, and finally evolved into clusters 3, 4, and 5 ()). The gene expression profile during the process of evolution also demonstrated that during the transition, stem cell-related genes, including OLFM4 and leukocyte antigen (HLA-A, HLA-B, HLA-DRA), were increased, and MMP-7 could promote mitosis and apoptosis by degrading IGFBP-3 in tumors [Citation31]. Notably, genes involved in cell proliferation and metastasis increased at the late stage of cell trajectory, such as CEACAM6 and NEAT1 ()). Based on the above results, our findings can partially reflect the transformation of CSC-like ductal cells to invasive ductal cells during PDAC progression.
Figure 2. ScRNA-seq analysis reveals the status and invasive trajectory of ductal cells
3.4. Identification of cancer stem cell-related genes
We compared the differentially expressed genes (DEGs) between cells of cluster 2 derived from tumor and normal tissues to explore the changes in the transcriptome levels. The volcano plot displayed upregulated and downregulated DEGs (Pvalue < 0.05, |log2FC| > 1). The enrichment analysis of the upregulated DEGs in tumors was found to be significantly involved in the Kras signaling pathway and epithelial mesenchymal transition (Supplementary Figure 1), which further suggests that these genes partially exhibit CSC-like characteristics [Citation8,Citation32–34].
Next, based on the GeneCards database (https://www.genecards.org/), we identified 202 CRGs, including 140 upregulated CRGs and 62 downregulated CRGs ().
Table 1. Screening of CRGs
3.5. Establishment and evaluation of the CSC-related prognostic signature in PDAC
We integrated the expression profiles of the 202 CRGs with their corresponding survival information in TCGA PDAC datasets to explore the potential clinical prognostic value of these genes. Correspondingly, COX regression and the least absolute shrinkage and selection operator (LASSO) regression models were performed to identify five CSC-related prognostic signatures (Supplementary Table 3 and Supplementary Figure 2(a)). Next, a risk predictive model in the training cohort was constructed. The forest plot displayed the relationship between these key genes and patient survival (Supplementary Figure 2(b)). The risk score from the training cohort was calculated as follows: risk score = 0.109 * expression of CXCL10 + 0.496 * expression of GMNN + 0.115 * expression of LY6D + 0.359 * expression of MET+ −0.117 * expression of RIC3. According to the expression level of the target gene of each patient, we calculated the corresponding signature score and the median value of the risk score, and divided the patients into high- and low-risk groups.
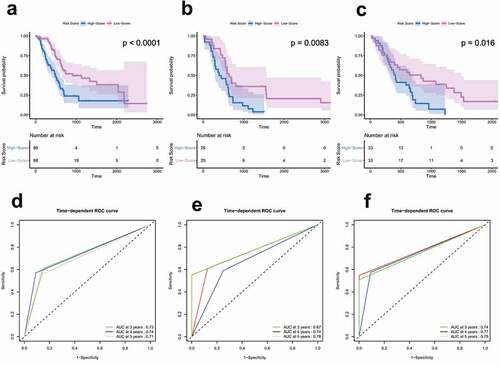
In the training cohort, the Kaplan-Meier curve showed that the patients in the high-risk group had significantly worse survival rates compared to those in the low-risk group (hazard ratio [HR] = 2.37, 95% confidence interval [CI] = 1.55–3.62, P < 0.0001) ()). This was consistently confirmed in two independent external validation sets ().
Time-dependent ROC analyses were performed at different time points to evaluate the prognostic accuracy of our risk model. The results showed that the AUC for 3, 4, and 5 years was 0.73, 0.74, and 0.71 in the training set, and the values for the two independent external validation sets were 0.67, 0.74, 0.78, 0.74, 0.77, and 0.75, respectively (). In general, these results demonstrate that our signature performed well in predicting survival in PC patients.
Figure 3. Survival and ROC analysis in training and validation datasets
3.6. Clinical stratification survival analysis
As shown in , after univariate and multivariate Cox regression analysis, our signature served as an independent prognostic indicator in PDAC patients, and univariate analysis results suggested that T stage, N stage, AJCC stage, and tumor sites had a relatively significant impact on the survival and prognosis of patients. Hence, we further utilized stratified survival analysis to assess whether our risk score model retained its prognostic value in different subgroups.
Table 2. Univariate and multivariate survival analysis in the training cohort
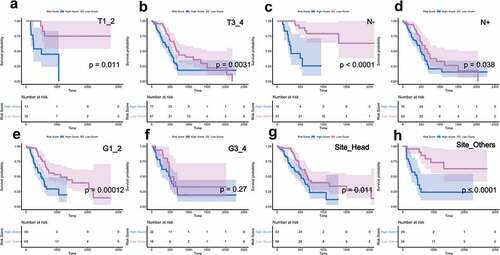
Clinicopathological parameters, including T stage, N stage, histological grade, and tumor sites, were used for further analysis. For patients with tumor invasion degree (T), metastatic lymph nodes (N), and primary tumor site, the risk score had a greater prognostic value (Pvalue < 0.05), and indicated that patients in the low-risk group had a longer survival period ( (a-h)). These results further confirmed that our risk model was applicable and reliable.
(*P value < 0.05; **P value < 0.01;***P value < 0.001;**** P value < 0.0001.)
Figure 4. Clinical stratification survival analysis
3.7. Somatic mutation burden landscape between different risk cohorts
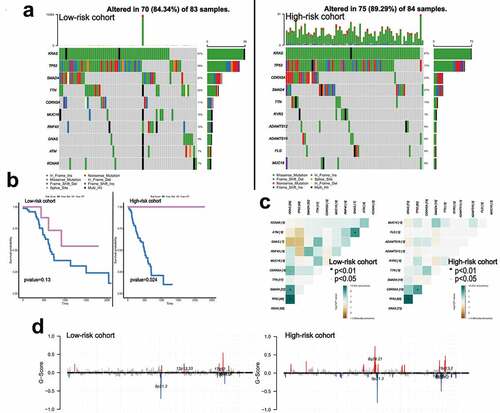
We calculated the TMB variations of each cohort and found that the frequency of mutation events in the high-risk cohort was significantly higher than that in the low-risk cohort in TCGA PDAC datasets. ) shows the 10 most frequently mutated genes in each cohort. Among them, Kras mutation occupied the first position in both cohorts, and the mutation spots of Kras between the two cohorts are displayed in Supplementary Figure 3(a-b). Kras mutation indicated poor survival in patients ()). Next, we analyzed the potential interactions of these gene mutations through gene mutation co-occurrence and mutual exclusion, and found two cases of GNAS-TP53, GNAS-KRAS mutually exclusive mutation were in the low-risk cohort ()). ) shows the changes in chromosome copy number variation (CNV) across the cohorts. As a result, the low-risk cohort was found to have a lower regional change compared to the high-risk cohort.
Figure 5. The landscape of somatic mutation burden between different risk groups
3.8. Expression levels of key genes in PDAC
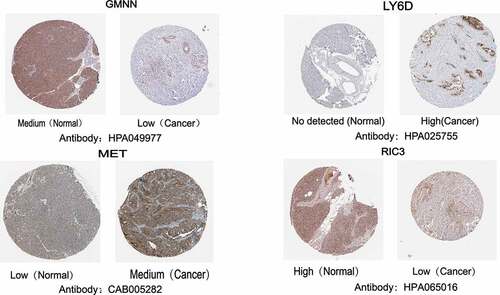
The Human Protein Atlas database (HPA) (https://www.proteinatlas.org/) was used to further explore the protein expression of these genes. Except for CXCL10, which was not retrieved, we found that LY6D and MET were significantly more highly expressed in tumor tissues than in normal pancreatic tissues. In contrast, RIC3 and GMNN expression was detected at low levels in the tumor tissues ().
Figure 6. The translational differences of the key genes between pancreatic cancer tissues and normal pancreatic tissues in the HPA database
4. Discussion
PC is considered one of the deadliest malignancies in humans, with a 5-year survival rate of only 1–5%, the most common pathologic type of which is PDAC [Citation2]. Recent research has shown that PCSCs are an important factor for the tumorigenesis, progression, drug resistance, and poor clinical outcome of PDAC [Citation5]. To evaluate biomarkers related to PCSCs to explore the potential for targeted therapies, we utilized scRNA-seq to capture a number of ductal cells with cancer stemness during PDAC progression. Meanwhile, based on TCGA datasets, we identified five CSC-related prognostic signatures, constructed a robust prognosis prediction system, and verified it in two independent external cohorts from GEO datasets. The KM survival curve suggested that the poor prognosis of patients in the high-risk group and AUCs of the risk score support the predictive accuracy of our model. Furthermore, the TMB analysis results of the two cohorts indicated the worst outcome of patients in the high-risk cohort. In brief, five CRGs are proposed as potential targets against PCSCs.
In this study, we calculated the CNV score between ductal cell clusters to evaluate their malignancy status. We found that clusters 3, 4, and 5 were significantly enriched in tumor tissue and displayed remarkably higher CNV levels than cluster 2, which had a medium percentage of cells derived from tumor tissue. Subsequently, through the analysis of gene expression and the enrichment analysis of each ductal cell subgroup, we found that the genes enriched in clusters 1 and 6 were mostly involved in the normal function of the pancreas, whereas the genes enriched in clusters 3, 4, and 5 were associated with malignant proliferation and distant invasion of cells. In contrast, cluster 2 expressed genes that were mostly related to cancer stemness. These results demonstrate that different transcription patterns among different cell populations represent different statuses of diverse ductal cells.
ScRNA-seq can accurately reflect the differentiation and evolution of different subtypes. We applied the Monocle2 method, which uses the asynchrony of individual cells to arrange them in pseudo-chronological order and illustrates their transformation process, to construct a pseudo-time analysis to explain and characterize the evolutionary trajectory between cells during PDAC progression. Cell trajectory analysis revealed that cluster 2 cells with cancer stemness gradually transformed into cluster 3, 4, and 5 cells, with the ability of proliferation and metastasis. The gene expression pattern variations further confirmed the transformation and succession of stemness-to-invasive ductal cells. In conclusion, our findings indicate that the ‘stem -to-invasion route’ represents the evolution of CSC-like ductal cells to invasive ductal cells in PDAC.
Next, we evaluated the gene expression profiles, clinicopathological parameters, and genomic mutation data of PC patients from TCGA database. LASSO and Cox regression analyses were used to identify five CSC-related prognostic molecules. Among them, the mutation or overexpression of MET exposed pancreatic cells to proliferative signals, leading to tumorigenesis [Citation35]. CXCL10 via CXCL10/CXCR3 signaling axis promoted the growth, motility, and metastatic ability of tumor cells [Citation36].
In addition, we also observed mutation characteristics in both cohorts and found that the mutation frequency of KRAS was significantly higher in the high-risk cohort, suggesting poor patient survival. Kras encodes a protein that is a member of the small GTPase superfamily and plays an important role in the development of pancreatic cancer [Citation37]. Although the potential connection between CRGs and Kras remains unclear, these findings provide a valuable direction for future research.
In this study, we used scRNA-seq technology to propose a trajectory of differentiation of CSC-like ductal cells into invasive ductal cells for the first time, and identified five CRGs that are significantly related to the prognosis of PDAC, providing potential targets for future research on PCSC drug targets. In addition, the connection between the signature and the tumor mutation population provides a direction for researchers to achieve precise individual tumor treatment in the future.
Conclusion
This study utilized scRNA-seq to depict ductal cellular heterogeneity, revealed the invasive trajectory, and defined CSC-related prognostic genes in PDAC. The general applicability of the signature in clinical stratification survival analysis and the correlation of somatic mutation characteristics provides an individualized prognostic and clinical treatment classifier for clinical decision makers.
Highlights
(1) ScRNA-seq reveals heterogeneity and invasion trajectory of ductal cells in PDAC
(2) The expression levels of CRGs correlate with the prognosis of PDAC
(3) CRGs have been demonstrated to possess independent prognosis-predictive values for PDAC
(4) CRGs are closely related to variations in tumor mutation burden
Authors’ contributions
Study conception and design: XR and CZ; Data acquisition and analysis: XR and FM; Data visualization: YL and YF; manuscript writing and manuscript editing: XR; manuscript reviewing: CW; All authors approved the final version of the paper.
Citation
[1] Li X, Liao Z, Deng Z, Chen N, Zhao L. Combining bulk and single-cell RNA-sequencing data to reveal gene expression pattern of chondrocytes in the osteoarthritic knee. Bioengineered 2021; 12:997-1007.
Compared with them, we used single-cell sequencing analysis to reveal the invasion trajectory of pancreatic cancer ductal cells for the first time, and proposed prognostic genes related to cancer stem cells.
Acknowledgements
In this study, we thank the Cancer Genome Atlas (TCGA) Database, Gene Expression Omnibus (GEO), Biological Project Libraryfor providing data support.
Disclosure statement
All authors declared no conflict of interest..
Data availability statement
The datasets analyzed was acquired from The Cancer Genome Atlas (TCGA) database(https://portal.gdc.cancer.gov/), Gene Expression Omnibus (GEO) database(https://www.ncbi.nlm.nih.gov/geo/) and Biological Project Library(https://bigd.big.ac.cn/bioproject/browse/PRJCA001063).
Additional information
Funding
References
- Vincent A, Herman J, Schulick R, et al. Pancreatic cancer. Lancet. 2011;378:607–620.
- Chen W, Zheng R, Baade PD, et al. Cancer statistics in China, 2015. CA Cancer J Clin. 2016;66:115–132.
- Boesch M, Sopper S, Zeimet AG, et al. Heterogeneity of cancer stem cells: rationale for targeting the stem cell niche. Biochim Biophys Acta. 2016;1866:276–289.
- Bao B, Ahmad A, Azmi AS, et al. Overview of cancer stem cells (CSCs) and mechanisms of their regulation: implications for cancer therapy. Curr Protoc Pharmacol. 2013;14:14–25.
- Qiu H, Fang X, Luo Q, et al. Cancer stem cells: a potential target for cancer therapy. Cell Mol Life Sci. 2015;72:3411–3424.
- Tan BT, Park CY, Ailles LE, et al. The cancer stem cell hypothesis: a work in progress. Lab Invest. 2006;86:1203–1207.
- Bao Q, Zhao Y, Renner A, et al. Cancer stem cells in pancreatic cancer. Cancers (Basel). 2010;2:1629–1641.
- Hermann PC, Huber SL, Herrler T, et al. Distinct populations of cancer stem cells determine tumor growth and metastatic activity in human pancreatic cancer. Cell Stem Cell. 2007;1:313–323.
- Ercan G, Karlitepe A, Ozpolat B. Pancreatic cancer stem cells and therapeutic approaches. Anticancer Res. 2017;37:2761–2775.
- Gonzalez-Silva L, Quevedo L, Varela I. Tumor Functional Heterogeneity Unraveled by scRNA-seq Technologies. Trends Cancer. 2020;6:13–19.
- Chung W, Eum HH, Lee HO, et al. Single-cell RNA-seq enables comprehensive tumour and immune cell profiling in primary breast cancer. Nat Commun. 2017;8:15081.
- Peng J, Sun BF, Chen CY, et al. Single-cell RNA-seq highlights intra-tumoral heterogeneity and malignant progression in pancreatic ductal adenocarcinoma. Cell Res. 2019;29:725–738.
- Wang Z, Hu J, Johnson WE, et al. scruff: an R/Bioconductor package for preprocessing single-cell RNA-sequencing data. BMC Bioinformatics. 2019;20:222.
- McGinnis CS, Murrow LM, Gartner ZJ. DoubletFinder: doublet detection in single-cell RNA sequencing data using artificial nearest neighbors. Cell Syst. 2019;8:329–37 e4.
- Butler A, Hoffman P, Smibert P, et al. Integrating single-cell transcriptomic data across different conditions, technologies, and species. Nat Biotechnol. 2018;36:411–420.
- Becht E, McInnes L, Healy J, et al. Dimensionality reduction for visualizing single-cell data using UMAP. Nat Biotechnol. 2018.
- Patel AP, Tirosh I, Trombetta JJ, et al. Single-cell RNA-seq highlights intratumoral heterogeneity in primary glioblastoma. Science. 2014;344:1396–1401.
- Qiu X, Hill A, Packer J, et al. Single-cell mRNA quantification and differential analysis with Census. Nat Methods. 2017;14:309–315.
- Duan J, Soussen C, Brie D, et al. Generalized LASSO with under-determined regularization matrices. Signal Process. 2016;127:239–246.
- Choi SW, Mak TS, O’Reilly PF. Tutorial: a guide to performing polygenic risk score analyses. Nat Protoc. 2020;15:2759–2772.
- Mayakonda A, Lin DC, Assenov Y, et al. Maftools: efficient and comprehensive analysis of somatic variants in cancer. Genome Res. 2018;28:1747–1756.
- Robinson MD, McCarthy DJ, Smyth GK. edgeR: a bioconductor package for differential expression analysis of digital gene expression data. Bioinformatics. 2010;26:139–140.
- Childs EJ, Mocci E, Campa D, et al. Common variation at 2p13.3, 3q29, 7p13 and 17q25.1 associated with susceptibility to pancreatic cancer. Nat Genet. 2015;47:911–916.
- Achille A, Biasi MO, Zamboni G, et al. Chromosome 7q allelic losses in pancreatic carcinoma. Cancer Res. 1996;56:3808–3813.
- Segerstolpe A, Palasantza A, Eliasson P, et al. Single-cell transcriptome profiling of human pancreatic islets in health and type 2 diabetes. Cell Metab. 2016;24:593–607.
- Rosas PC, Nagaraja GM, Kaur P, et al. Hsp72 (HSPA1A) prevents human islet amyloid polypeptide aggregation and toxicity: a new approach for type 2 diabetes treatment. PLoS One. 2016;11:e0149409.
- Cao J, Zhang Y, Yang J, et al. NEAT1 regulates pancreatic cancer cell growth, invasion and migration though mircroRNA-335-5p/c-met axis. Am J Cancer Res. 2016;6:2361–2374.
- Duxbury MS, Matros E, Clancy T, et al. CEACAM6 is a novel biomarker in pancreatic adenocarcinoma and PanIN lesions. Ann Surg. 2005;241:491–496.
- Arumugam T, Simeone DM, Van Golen K, et al. S100P promotes pancreatic cancer growth, survival, and invasion. Clin Cancer Res. 2005;11:5356–5364.
- Sanford DE, Belt BA, Panni RZ, et al. Inflammatory monocyte mobilization decreases patient survival in pancreatic cancer: a role for targeting the CCL2/CCR2 axis. Clin Cancer Res. 2013;19:3404–3415.
- Fukuda A, Wang SC, Morris J, et al. Stat3 and MMP7 contribute to pancreatic ductal adenocarcinoma initiation and progression. Cancer Cell. 2011;19:441–455.
- Wang H-C, Hou Y-C, Shan Y. Advances in pancreatic cancer stem cells, tumor- associated macrophages, and their interplay. Cancer Cell Microenviron. 2014;1:e304.
- Mani SA, Guo W, Liao MJ, et al. The epithelial-mesenchymal transition generates cells with properties of stem cells. Cell. 2008;133:704–715.
- Zhou P, Li B, Liu F, et al. The epithelial to mesenchymal transition (EMT) and cancer stem cells: implication for treatment resistance in pancreatic cancer. Mol Cancer. 2017;16:52.
- Li C, Wu JJ, Hynes M, et al. c-Met is a marker of pancreatic cancer stem cells and therapeutic target. Gastroenterology. 2011;141:2218–27 e5.
- Wightman SC, Uppal A, Pitroda SP, et al. Oncogenic CXCL10 signalling drives metastasis development and poor clinical outcome. Br J Cancer. 2015;113:327–335.
- Mann KM, Ying H, Juan J, et al. KRAS-related proteins in pancreatic cancer. Pharmacol Ther. 2016;168:29–42.