
ABSTRACT
Osteoporosis is a progressive bone disease in the elderly and lacks an effective classification method of patients. This study constructed a gene signature for an accurate prediction and classification of osteoporosis patients. Three gene expression datasets of osteoporosis samples were acquired from the Gene Expression Omnibus database with pre-set criteria. Differentially expressed genes (DEGs) between normal and diseased osteoporosis samples were screened using Limma package in R language. Protein–protein interaction (PPI) network was established based on interaction data of the DEGs from the Human Protein Reference Database. Classification accuracy of the classifier was assessed with sensitivity, specificity and area under curve (AUC) using the pROC package in the R. Pathway enrichment analysis was performed on feature genes with clusterProfiler. A total of 310 differentially expressed genes between two samples were associated with positive regulation of protein secretion and cytokine secretion, neutrophil-mediated immunity, and neutrophil activation. PPI network of DEGs consisted of 12 genes. A SVM classifier based on five feature genes was developed to classify osteoporosis samples, showing a higher prediction accuracy and AUC for GSE35959, GSE62402, GSE13850, GSE56814, GSE56815 and GSE7429 datasets. A SVM classifier with a high accuracy was developed for predicting osteoporosis. The genes included may be the potential feature genes in osteoporosis development.AbbreviationsDEGs: Differentially expressed genes; PPI: protein–protein interaction; WHO: World Health Organization; SVM: Support vector machine; GEO: Gene Expression Omnibus; KEGG: Kyoto Encyclopedia of Genes and Genomes; GO: Gene Ontology; BP: Biological Process; CC: Cellular Component; MF: Molecular Function; SVM: Support vector machines
Introduction
Human skeletal system is in a process of constant renewal and dynamic balance, in which bone formation and bone resorption play important roles in maintaining the stability of the system [Citation1]. Osteoporosis is a metabolic bone disease characterized by decreased bone content, destruction of bone microstructure and increased bone fragility. As a common clinical bone disease implicating about 200 million patients in the world, osteoporosis occurs when bone resorption exceeds bone formation [Citation2]. According to the World Health Organization (WHO), the total number of osteoporosis patients in the world will reach 221 million by 2050. In China, osteoporosis is also one of the most frequently occurred diseases with an increasing incidence each year.
In recent years, machine learning methods have been increasingly applied to predict complex biological events. As a supervised machine-learning technique, support vector machine (SVM) is widely used in classification and pattern recognition. The SVM algorithm performs classification by establishing a multidimensional hyperplane that optimally distinguishes two classes through maximizing the margin between the two data clusters. The algorithm uses a special nonlinear function-kernel function to convert the input space into a multi-dimensional space, thereby obtaining a high discriminant ability [Citation3]. SVM have also been used in medical applications [Citation4–6]. SVM training algorithm builds a model to predict whether a new case falls into one of the categories by giving a set of training cases, and each training case is marked as belonging to one of two categories.
In this study, SVM was employed to classify osteoporosis and normal samples. Three data sets were used to construct and verify the prediction accuracy of the SVM classifier. The function and pathway information of the identified SVM classification feature genes was analyzed with a variety of bioinformatics methods to identify novel biomarkers.
Materials and methods
Data collection and processing
The newest clinical follow-up data and RNA-seq data of osteoporosis cases were downloaded from Gene Expression Omnibus (GEO) to obtain gene expression profiles in the GSE56116, GSE62402, GSE35959, GSE13850, GSE56814, GSE56815 and GSE7429. GSE35959 dataset served as the training set, and GSE62402, GSE13850, GSE56814, GSE56815 and GSE7429 datasets served as validation datasets. For the chip data, probes were matched to genes, and those matched to multiple genes were removed, whereas multiple probes matching to the median of a gene was kept to acquire the gene expression profile. The sample data are all presented in . The workflow is presented in .
Table 1. Sample information of datasets
Figure 1. Work flow chart
Analysis of differentially expressed genes (DEGs)
Limma package was used to perform DEG analysis. Genes conforming to an adjusted p value of less than 0.05 and an absolute of fold change greater than 2 were defined as DEGs.
Functional enrichment analysis
Genes with expression changes were annotated into Cellular Component (CC), Molecular Function (MF), and Biological Process (BP) of Gene Ontology (GO) and into Kyoto Encyclopedia of Genes and Genomes (KEGG) using the R software packages clusterProfiler (v 3.14.0) [Citation7].
Construction of PPI network for DEGs
We examined molecular interactions of the DEGs. A PPI network with mutant genes was generate using STRING database online (https://string-db.org/). The confidence score was set to 0.7 as the cutoff criteria, excluding disconnected nodes were hidden. Next, the interaction data in tsv format was downloaded to modify the PPI network in Degree, MNC, Closeness and MCC algorithms of Plug-in cytoHubba for Cytoscape (Version: 3.7.2) software in JAVA platform.
Support vector machines (SVM) model
SVM, which is a supervised machine learning classification algorithm, determines sample type through estimating the degree of a sample belonging to a certain class [Citation8]. For the GSE35959 training set, a SVM classifier was constructed based on the hub gene set using SVM method with the R package e1071 [Citation9]. The performance of the SVM classifier was separately evaluated in the training set and 2 validation sets (GSE62402 and GSE7158).
Results
A total of 310 differentially expressed genes between two samples were found to be associated with positive regulation of protein secretion and cytokine secretion, neutrophil-mediated immunity, and neutrophil activation. PPI network of DEGs consisted of 12 genes. A SVM classifier based on 5 feature genes was developed to classify different osteoporosis samples, showing a higher prediction accuracy and AUC for GSE35959, GSE62402, GSE13850, GSE56814, GSE56815 and GSE7429 datasets.
Screening and functional analysis of DGEs
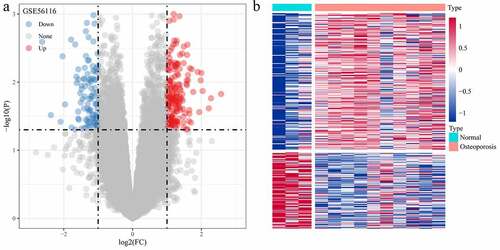
The DEGs between Normal and GSE56116 genotypes were calculated using the Limma package. The analytical results showed that there were 310 DEGs (111 down-regulated genes and 199 up-regulated genes) ()).
Figure 2. Screening of differentially expressed genes. (a) Volcano plot of differentially expressed genes in dataset GSE56116; (b) Heat map of differentially expressed genes
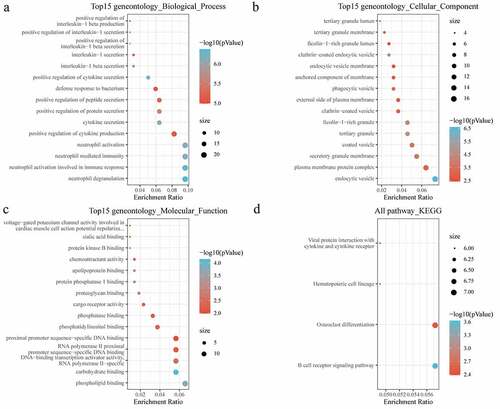
Next, the biological function of DEGs was further analyzed with conducting GO and KEGG analysis. For biological process (BP) of GO analysis, the targeted genes were noticeably enriched to positive regulation of cytokine and protein secretion, neutrophil activation and neutrophil mediated immunity ()). For the cellular component (CC), there were 47 pathways obviously enriched to these genes ()). For molecular function (MF), genes were found to be closely related to phospholipid binding and DNA binding pathways ()). Moreover, KEGG analysis showed that the DEGs were enriched to essential pathways associated with osteoporosis progression, including B-cell receptor signaling pathway, hematopoietic cell lineage, osteoclast differentiation, and viral protein interaction with cytokine and cytokine receptor ()).
Figure 3. Functional enrichment of differentially expressed genes. (a) BP annotation of differentially expressed genes; (b) CC annotation of differentially expressed genes; (c) MF annotation of differentially expressed genes; (d) KEGG annotation of differentially expressed genes
Protein–protein interaction analysis
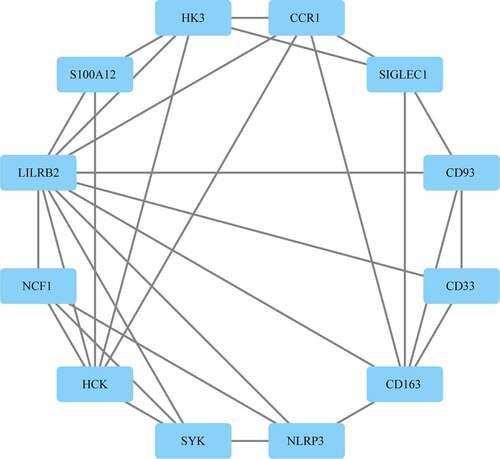
Protein–protein interaction (PPI) network analysis on a total of 310 DEGs was performed using STRING. According to Cytoscape 3.7.2 and its plug-in, 12 out of the 310 target genes were filtered by the target genes PPI network complex (MCODE1(MCODE.csv)) ().
Figure 4. PPI analysis of the gene of the functional module
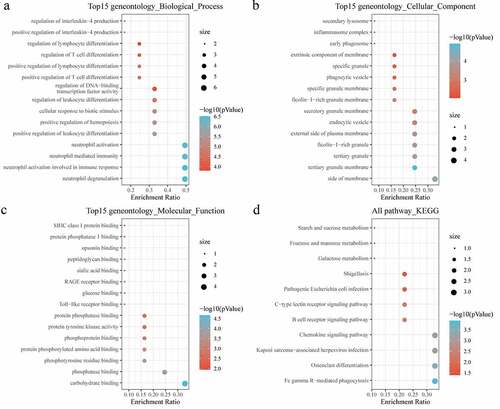
Furthermore, KEGG pathway analysis and GO functional enrichment analysis were conducted on 12 genes of MCODE1 module using R software package clusterProfiler (V 3.14.0). For BP of GO analysis, the targeted genes were found to be highly enriched to neutrophil-mediated immunity, neutrophil activation involved in immune response, positive regulation of leukocyte differentiation, regulation of lymphocyte differentiation ()). For the CC, there were 24 pathways obviously enriched to these genes ()). For the MF, there were 33 pathways noticeably enriched to these genes ()). For KEGG analysis, the DEGs were enriched to essential pathways, such as chemokine signaling pathway, B-cell receptor signaling pathway, osteoclast differentiation ()).
Figure 5. Functional enrichment of functional module genes. (a) BP annotation of functional module genes; (b) CC annotation of functional module genes; (c) MF annotation of functional module genes; (d) KEGG annotation of functional module genes
Identification of hub genes
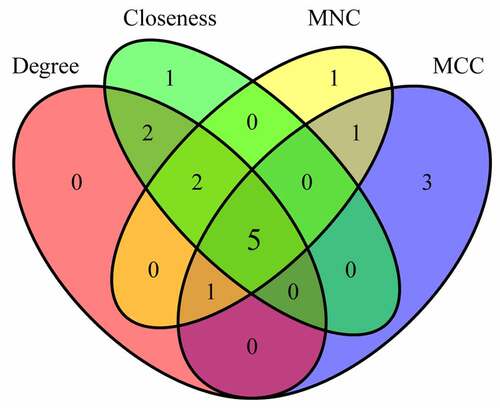
The degree, MNC, Closeness, and MCC algorithms of cytoHubba plug-ins for Cytoscape 3.7.2 software were applied to calculate and construct PPI networks based on 310 DEGs (). Then, the genes obtained by these four algorithms were intersected, and we obtained five genes, which were CCR1, CD33, HCK, LILRB2 and CYBB (). These five genes were regarded as final hub genes.
Figure 6. Identification of Hub genes. (a) PPI network diagram of hub genes obtained by Closeness algorithm. (b) PPI network diagram of hub genes obtained by MCC algorithm. (c) PPI network diagram of hub genes obtained by MNC algorithm. (d) PPI network of hub genes obtained by Degree algorithm
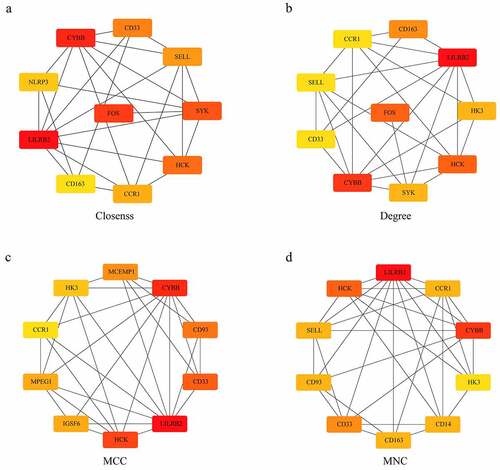
Figure 7. Venn diagram of hub genes identification
Development and verification of the diagnostic model
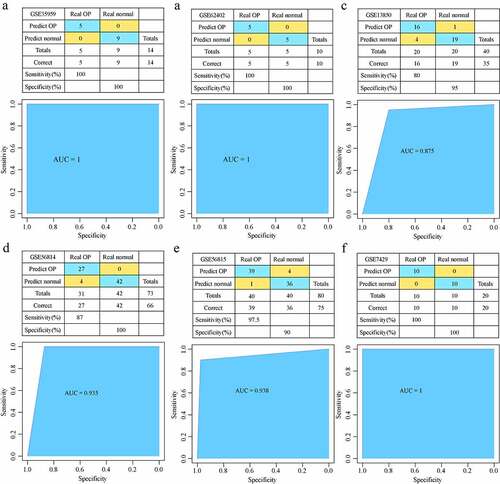
Five hub genes from GSE35959 training data set were used to develop an expression spectrum and a SVM classification model. We found that the sample classification accuracy of the training data set was 100%, and that the sensitivity and specificity of the model were 100%, with an area under ROC curve (AUC) of 1 ()). In the GSE62402 data set, similarly, all the 10 samples were correctly classified, showing a 100% classification sensitivity, specificity, accuracy of the model, with an area under ROC curve of 1 ()). GSE13850 data set was used for verification, 35 of the 40 samples were correctly classified, the classification accuracy was as high as 87.5%, the model sensitivity was 80%, the specificity was 95%, and the area under the ROC curve was 0.875 ()). In GSE56814 dataset, 66 out of 73 samples were correctly classified, the classification accuracy was as high as 94.5%, the model sensitivity was 87%, the specificity was 100%, and the area under the ROC curve was 0.935 ()). In GSE56815 dataset, 75 of the 80 samples were correctly classified, the classification accuracy was as high as 93.8%, the sensitivity of the model was 97.5%, the specificity was 90%, and the area under the ROC curve was 0.938 ()). In GSE7429 verification dataset, and 20 out of 20 samples were correctly classified, the classification accuracy was as high as 100%, the sensitivity and specificity of the model were 100%, and the area under the ROC curve was 1 ()). These results indicated that the SVM classification model could accurately distinguish osteoporosis samples from normal samples; moreover, these five genes were reliable biomarkers for the diagnosis of osteoporosis.
Figure 8. Development and verification of the model. (a) The classification result and ROC curve of the GSE35959 dataset sample by the diagnostic model; (b) The classification result and ROC curve of the GSE62402 dataset sample by the diagnostic model. (c) The classification result and ROC curve of the GSE13850 dataset sample by the diagnostic model; (d) The classification result and ROC curve of the GSE56814 dataset sample by the diagnostic model; € The classification result and ROC curve of the GSE56815 dataset sample by the diagnostic model; (f) The classification result and ROC curve of the GSE7429 dataset sample by the diagnostic model
Discussion
Compared with traditional machine learning algorithms, SVM algorithm could greatly simplify computational complexity, as it applies a nonlinear mapping of the inner product kernel function to a high-dimensional space, and this is more suitable for classification using high-dimensional data but with few training queues in the selection of all available functions [Citation8]. Studies demonstrated that using only one biomarker will undoubtedly reduce the accuracy of predicting disease prognosis [Citation10–12]. Also, the generalization ability of SVM and advanced algorithm of artificial intelligence (AI) is better than neural networks in classifying small samples and is less prone to overfitting when combined with penalty terms. Considering the limited research samples, we applied SVM rather than deep learning for model development [Citation13].
Most of the previous studies focused on the study of a single gene in Osteoporosis, such as Circular RNA Circ_0005564, or Circular RNA circ_0000020 promotes osteogenic differentiation via ceRNA mechanism [Citation14,Citation15]. At present, multi-gene combined diagnosis is also one of the research hotspots. After performing integrated microarray analysis, we screened 310 DEGs between osteoporosis patients and normal controls. Furthermore, gene biomarkers for osteoporosis were determined by Cytohubba, a plug-in for Cytoscape (Version: 3.7.2) software. A 5-gene combination (CCR1, CD33, HCK, LILRB2 and CYBB) was established as an optimal and effective biomarker for osteoporosis using SVM with feature selection and classification procedures. Moreover, the 5-gene classification model was 100% accurate in distinguishing normal patients from osteoporosis, showing 100% specificity and 90% sensitivity in three datasets.
Among the five genes, CCR1 is a major receptor for CCL3 (MIP-1α), which is a pro-inflammatory cytokine that stimulate osteoclasts activity and induces osteoclastogenesis [Citation16–18]. To the best of our knowledge, the association between osteoporosis and the other four genes (CD33, HCK, LILRB2 and CYBB) was the first described in this study. CD33 is associated with a number of diseases, including acute leukemia and acute promyelocytic leukemia. Upon binding of ligands such as C1q or sulfonylated glycoproteins, two immunoreceptor tyrosine-based inhibitory motifs (ITIM) located in cytoplasmic tail of CD33 are phosphorylated by Src-like kinases such as LCK [Citation19,Citation20]. HCK is a member of the Src family of tyrosine kinases, and it mediates the degranulation and activation of NADPH oxidase during phagocytosis, mobilization of secretory lysosomes, resulting in a respiratory burst [Citation21–24]. As a member of the leukocyte immunoglobulin-like receptor (LIR) family, LILRB2 could recognize HLA-G in complex with B2M/β-2 microglobulin and ninhydrin self-peptide (peptide-bound HLA-G-B2M), subsequently triggering the differentiation of myeloid suppressor cells and type 1 regulatory T cells. Both of the two could help actively sustain maternal-fetal tolerance [Citation25–27]. Under the mutations in CYBB, NADPH oxidase could not assemble or function normally, and phagocytes will not be able to produce reactive oxygen species to kill foreign invaders, thereby leading to the dysregulation of neutrophil activity [Citation28–31]. However, further research should be conducted to further explore the roles of those genes in osteoporosis.
Conclusions
In summary, five genes significantly associated with osteoporosis were identified in this study, providing new understanding of the molecular mechanism of osteoporosis. These five genes were potential biomarkers for osteoporosis. But a lack of biological validation with a larger sample size was considered to be a limitation of this research. Future studies should also verify the diagnostic performance of the current gene model before clinical use.
Research highlights
A protein interaction network was developed with bioinformatics for osteoporosis.
CCR1, CD33, HCK, LILRB2, and CYBB were key genes in osteoporosis.
A 5-gene diagnostic model was validated by support vector mechanism.
Author contributions
MWH designed the study. CHS and LZ contributed to the literature research. JL and ZYY analyzed and interpreted the data. YNC wrote the initial draft of the manuscript. YZX reviewed and edited the manuscript. All authors read and approved the manuscript.
Availability of data and materials
The data that support the findings of this study are openly available in GSE35959 [https://www.ncbi.nlm.nih.gov/geo/query/acc.cgi?acc=GSE35959], GSE62402 [https://www.ncbi.nlm.nih.gov/geo/query/acc.cgi], GSE13850 [https://www.ncbi.nlm.nih.gov/geo/query/acc.cgi], GSE56814 [https://www.ncbi.nlm.nih.gov/geo/query/acc.cgi], GSE56815 [https://www.ncbi.nlm.nih.gov/geo/query/acc.cgi], and GSE7429 [https://www.ncbi.nlm.nih.gov/geo/query/acc.cgi] datasets.
Disclosure statement
The authors declare that they have no competing interests.
Correction Statement
This article has been republished with minor changes. These changes do not impact the academic content of the article.
References
- Carey JJ, Buehring B. Current imaging techniques in osteoporosis. Clin Exp Rheumatol. 2018;36(Suppl 114):115–126.
- Lee WC, Guntur AR, Long F, et al. Energy metabolism of the osteoblast: implications for osteoporosis. Endocr Rev. 2017;38:255–266.
- Yu W, Liu T, Valdez R, et al. Application of support vector machine modeling for prediction of common diseases: the case of diabetes and pre-diabetes. BMC Med Inform Decis Mak. 2010;10:16.
- Klöppel S, Stonnington CM, Barnes J, et al. Accuracy of dementia diagnosis: a direct comparison between radiologists and a computerized method. Brain. 2008;131:2969–2974.
- Das K, Giesbrecht B, Eckstein MP. Predicting variations of perceptual performance across individuals from neural activity using pattern classifiers. NeuroImage. 2010;51:1425–1437.
- Mourão-Miranda J, Bokde AL, Born C, et al. Classifying brain states and determining the discriminating activation patterns: support vector machine on functional MRI data. NeuroImage. 2005;28:980–995.
- Yu G, Wang LG, Han Y, et al. clusterProfiler: an R package for comparing biological themes among gene clusters. OMICS. 2012;16:284–287.
- Daliri MR. Feature selection using binary particle swarm optimization and support vector machines for medical diagnosis. Biomed Tech. 2012;57:395–402.
- Dong J, Xu M. A 19‑miRNA support vector machine classifier and a 6‑miRNA risk score system designed for ovarian cancer patients. Oncol Rep. 2019;41:3233–3243.
- Liu K, Yang K, Wu B, et al. Tumor-infiltrating immune cells are associated with prognosis of gastric cancer. Medicine (Baltimore). 2015;94:e1631.
- Jiang Y, Zhang Q, Hu Y, et al. ImmunoScore signature: a prognostic and predictive tool in gastric cancer. Ann Surg. 2018;267:504–513.
- Jiang Y, Liu W, Li T, et al. Prognostic and predictive value of p21-activated kinase 6 associated support vector machine classifier in gastric cancer treated by 5-fluorouracil/oxaliplatin chemotherapy. EBioMedicine. 2017;22:78–88.
- Beam AL, Kohane IS. Translating artificial intelligence into clinical care. Jama. 2016;316:2368–2369.
- Liu Z, Liu Q, Chen S, et al. Circular RNA Circ_0005564 promotes osteogenic differentiation of bone marrow mesenchymal cells in osteoporosis. Bioengineered. 2021;12:4911–4923.
- Zhou R, Miao S, Xu J, et al. Circular RNA circ_0000020 promotes osteogenic differentiation to reduce osteoporosis via sponging microRNA miR-142-5p to up-regulate bone morphogenetic protein BMP2. Bioengineered. 2021;12:3824–3836.
- Han JH, Choi SJ, Kurihara N, et al. Macrophage inflammatory protein-1alpha is an osteoclastogenic factor in myeloma that is independent of receptor activator of nuclear factor kappaB ligand. Blood. 2001;97:3349–3353.
- Roodman GD, Dougall WC. RANK ligand as a therapeutic target for bone metastases and multiple myeloma. Cancer Treat Rev. 2008;34:92–101.
- Lentzsch S, Gries M, Janz M, et al. Macrophage inflammatory protein 1-alpha (MIP-1 alpha) triggers migration and signaling cascades mediating survival and proliferation in multiple myeloma (MM) cells. Blood. 2003;101:3568–3573.
- Son M, Diamond B, Volpe BT, et al. Evidence for C1q-mediated crosslinking of CD33/LAIR-1 inhibitory immunoreceptors and biological control of CD33/LAIR-1 expression. Sci Rep. 2017;7:270.
- Paul SP, Taylor LS, Stansbury EK, et al. Myeloid specific human CD33 is an inhibitory receptor with differential ITIM function in recruiting the phosphatases SHP-1 and SHP-2. Blood. 2000;96:483–490.
- Quintrell N, Lebo R, Varmus H, et al. Identification of a human gene (HCK) that encodes a protein-tyrosine kinase and is expressed in hemopoietic cells. Mol Cell Biol. 1987;7:2267–2275.
- Bavi R, Kumar R, Rampogu S, et al. Novel virtual lead identification in the discovery of hematopoietic cell kinase (HCK) inhibitors: application of 3D QSAR and molecular dynamics simulation. J Recept Signal Transduct Res. 2017;37:224–238.
- Bhattacharjee A, Pal S, Feldman GM, et al. Hck is a key regulator of gene expression in alternatively activated human monocytes. J Biol Chem. 2011;286:36709–36723.
- Yang S, Blachowicz L, Makowski L, et al. Multidomain assembled states of Hck tyrosine kinase in solution. Proc Natl Acad Sci U S A. 2010;107:15757–15762.
- Gregori S, Tomasoni D, Pacciani V, et al. Differentiation of type 1 T regulatory cells (Tr1) by tolerogenic DC-10 requires the IL-10-dependent ILT4/HLA-G pathway. Blood. 2010;116:935–944.
- Köstlin N, Ostermeir AL, Spring B, et al. HLA-G promotes myeloid-derived suppressor cell accumulation and suppressive activity during human pregnancy through engagement of the receptor ILT4. Eur J Immunol. 2017;47:374–384.
- Shiroishi M, Kuroki K, Ose T, et al. Efficient leukocyte Ig-like receptor signaling and crystal structure of disulfide-linked HLA-G dimer. J Biol Chem. 2006;281:10439–10447.
- Kannengiesser C, Gérard B, El Benna J, et al. Molecular epidemiology of chronic granulomatous disease in a series of 80 kindreds: identification of 31 novel mutations. Hum Mutat. 2008;29:E132–49.
- Roos D, Kuhns DB, Maddalena A, et al. Hematologically important mutations: x-linked chronic granulomatous disease (third update). Blood Cells Mol Dis. 2010;45:246–265.
- Stasia MJ, Li XJ. Genetics and immunopathology of chronic granulomatous disease. Semin Immunopathol. 2008;30:209–235.
- Sumimoto H. Structure, regulation and evolution of Nox-family NADPH oxidases that produce reactive oxygen species. Febs J. 2008;275:3249–3277.