
ABSTRACT
The microbial diversity and communities in the excrement of healthy and patients suffered from cancer were identified by 16SrDNA sequencing performed on the Illumina Hi Seq sequencing platform. The microbial difference was also analyzed. The sequencing results showed high quality of the data, and the microbial communities were more various in the excrement of cancer patients. And the abundance of Firmicutes phylum was significantly reduced in cancer group. The phylum of Fermicutes, Bacteroidetes in cancer group are significantly down-regulated and up-regulated compared with normal group. The species of Faecalibacterium prausnitzii, Bateroides vulgatus and Fusicatenibacter saccharivorans are significantly lower in cancer group than that in normal group (P< 0.05). The species of Prevetella copri, M. uniformis, and Escherichia coli are significantly higher in the cancer group than that in normal group. The comparative results indicated that beneficial bacterium significantly decreased in colorectal cancer (CRC) group, and harmful bacterium significantly increased in the colon cancer group, meanwhile the acidity, sugar increased whereas the oxygen content decreased to facilitate the growth of harmful bacterium. The results would provide microbial approaches for the treatment of colon cancer by the intake of beneficial microbial communities.
1. Introduction
As the development of microbiome, more and more microbes were excavated from the gut of health crowd and patients suffered from cancer and other metabolic diseases such as Diabetes, gout, osteoporosis, vitamin D deficiency, hyperlipidemia [Citation1–3]. And the great difference of microbial diversity and communities in healthy crowd and patients were demonstrated. And gut microbes played an important role in the development and progress of diseases [Citation4,Citation5]. The physiological function of gut microbial communities is closely associated with the human health. It was reported that the alteration of the microbial communities have a close relationship with the infection of human papillomavirus [Citation6]. Fusobacterium hwasooki and Porphyromonas gingivalis were reported as harmful gut microbial that play a role in the occurrence and the development of colorectal cancer (CRC). Researchers at Harvard Medical School and the Jocelyn Diabetes Center have analyzed the genetic makeup of bacteria in the human gut, we also looked at the bacterial genome (genetic characteristics) in relation to arteriosclerosis cardiovascular disease, cirrhosis, inflammatory bowel disease, colorectal cancer, and Type 2 diabetes. Data from microbiome-disease Association studies at the genetic level suggest that coronary artery disease, IBD, and cirrhosis share many of the same bacterial genes. In other words, people whose Gut Microbiota contains the same collection of bacteria seem to be more likely to have one or more of these three conditions. Recent research suggests that microbes in the human gut may play a role in everything from obesity to cancer [Citation7–9]. It was reported that anti-inflammatory factors, compounds with analgestic activity such as γ-aminobutyric (GABA), antioxidants and vitamins can be produced by gut microbes to protect human body. Meanwhile, some prebiotics can also yield antibiotics to inhibit the growth of harmful bacteria that can produce toxins causing chronic disease [Citation7–9].
There are differences in the number, structure, abundance, and physiological state of microbes among individuals [Citation10]. Bacteroides and Firmicutes sp. are the most common among the normal gut microbes, which accounted for 90% [Citation11], and other fewer microbes were actinomycetes [Citation12] and proteobacteria [Citation13], etc. Gut microbes can live in different parts of human beings. And the metabolism of specific microbes and thereof produced metabolites can affect the balance of intestinal environment. Meanwhile, there is a close and mutually beneficial symbiosis between the intestinal microbes and the host. In turn, the host can also affect the communities and function of gut microbes [Citation14,Citation15]. The gut microbial communites of C57BL/6 J mice with high-fat diet were also significantly altered by calcium supplement [Citation16]. Colorectal is an important digestive organ in human body, which has the function of digestion and nutrition intake. It also play the role of metabolism and the storage of food residues. However, the residue and some acids, phenols, and other carcinogens produced by metabolism can be the pathogen for intestinal [Citation17–19]. Thus, the integrity of the barrier for the intestinal, as well as the immune system, etc., would be invaded and destroyed, and the risk of exposure would increase [Citation20–22]. Colorectal cancer is a common type of loss of body mass. Chronic and recurrent elimination of mild and severe diarrhea and abdominal pain [Citation23–25], which usually occurs in the ileum, colon, and rectum. The successful inoculation of gut microbiota to C57BL/6 mice administrated with antibiotics ahead was performed, thus resulting in the transmission of obese mice to lean mice. The results suggested the important physilogical role of gut microbes for hosts [Citation26–28].
In this study, the microbial diversity and composition of the excrement from 73 healthy crowd and 60 patients suffered from colon cancer were analyzed by 16SrDNA sequencing on Illumina sequencing platform. The sequencing quality and composition, diversity of gut microbial were also analyzed. The microbial diversity and abundance of the fecal sample from healthy people and CRC patients were firstly analyzed, thus providing clues for the prevention and treatment of colon cancer by the inoculation of beneficial microbes and reducing the abundance of harmful bacteria.
2. Materials and methods
2.1. The patients and groups
61 patients and 72 normal crowds were divided into two groups. The excrement of the two individual groups were collected.
2.2. The DNA extraction
The DNAs of gut microbes from the excrement of different groups were extracted using the genome DNA extraction kit (Umagen, Guangzhou), and then stored in −80°C until using.
2.3. The 16SrDNA sequencing
DNA extracted from the fecal samples was used to amplify the V3-V4 region of 16A rRNA gene to determine the gut bacterial community structure. Primer set 341 F (5ʹ-ACTCCTCCGGGAGGCAGCAG-3ʹ) /806 R (5ʹ-GGACTACGCGGGTATCTAAT-3ʹ) using prime STAR HS mix (Takara, Japan) was employed to target the V3-V4 region. And the amplification condition was as following: Pre-denaturation at 95° C 3 min; 95° C denaturation 30 s 55° C annealing 30 s 72° C extension 30 s. A total of 29 cycles, 72° C extension for 5 min, 4° C storage. The amplified products were further subjected to library preparation and sequencing on the Illumina MiSeq platform as per the manufaturer’ s instructions (Illumina Technologies, USA).
2.4. The data analysis
The raw fastq files obtained by Illumina sequencing machine (Illumina Hiseq2500, USA) were quality-filtered using the Trimmomatic, vsearch, etc. The high quality sequence were used for community structure analysis using QIIME pipeline. Operational taxonomic unit (OTU) picking method was carried out using UCLUST closed reference method, and the representative OTUs were assigned taxonomy using UCLUST classifier with SILVA database (version 132) as reference dataset. Alpha and beta diversity analysis were performed, and further statistical analysis was carried out using R.
2.5. Dilution curve and relative abundance analysis of species.
Random sampling of OTU sequences and analysis of sequence numbers and OTU numbers were performed to prepare the dilution curve and to analyze the relative abundance of species.
2.6. Analysis of the composition of intestinal microbial colonies
Using Qiime software, and according to the results of OTU classification, the intestines of mice in each group were compared. The composition of trace microorganisms was analyzed, which were classified from phylum, family, genus and so on to understand the changes of the composition and structure of intestinal microorganisms in each group.
2.7. Similarity analysis between groups
Principal coordinate analysis (principal co-ordinates analysis,PCoA). It is a method to study the similarity between data by analyzing the distance and matrix of data. The visualization method of difference. All samples were obtained by UniFrac analysis. distance, matrix data, and then PCoA, to understand the intestinal microcosm of each group of mice to investigate the similarity between biological communities.
3. Results and discussion
3.1. Analysis of relative abundance of species
The relative abundance of species were analyzed based on the dilution curve and OTU data.
3.1.1. Dilution and abundance curve analysis
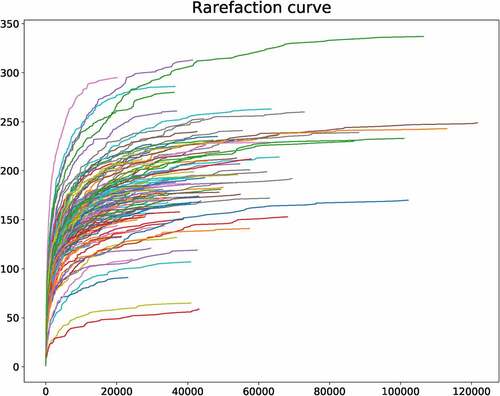
The sequencing data indicated that the lengths of most reads are 450–500 bp (Fig. S1). The dilution curve can directly reflect the rationality of the collected sample. And the collected samples are enough to reflect the microbial diversity (). The relative abundance curve was also depicted, which can reflect the abundance and uniformity of sequencing. Abscissa indicates that the relative abundance of OTU is arranged in descending order. The ordinate represents the relative abundance of the sequence number in the OTU. The species sequence number of sequence samples is mainly distributed in the range of 2000 to 8000, and the composition and distribution are evenly distributed.
Figure 1. The dilution curve of 16SrRNA sequencing
3.1.2. Microbial diversity analysis
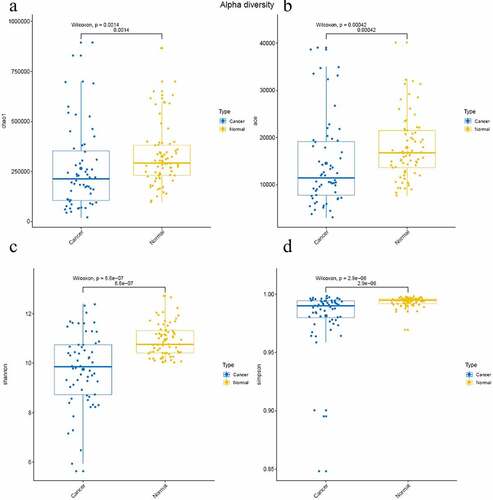
In this study, the indexes of Chao1, ACE value, Shannon index, and Good’s coverage to reflect the relative abundance and microbial diversity of different groups, which is positivly related to the abundance of species. The sequencing depth can be reflected by Good’s coverage. The data analysis results are listed in . The results show that the Chao1 index, ACE value, and Shannon index are significantly lower in cancer group (PRS011180031-PRS011190156) than that in normal group (P< 0.05) ()), suggesting that the microbial diversity and abundance decreased in colon cancer group than that in normal group. Meanwhile, the simpson index was nearly 1.0, indicating the credibility of the sequencing in this study ()).
Table 1. The difference in the microbial diversity for various samples
Figure 2. Microbial diverisity of normal group and colon cancer group
3.2. The composition analysis of gut microbes
The composition of the gut microbes in excrement of normal group and colon cancer group is analyzed based on the levels of phylum, class, genus and species, which was according to the sequencing data.
3.2.1. Phylumbased microbial communities analysis
The phylum-based comparative microbial communities analysis was analyzed (Fig. S2A). The results indicated that the most dominant phylum in cancer and normal groups are Bacteroidetes, Fermicutes, respectively, and the abundances of phylums of Fermicutes, Bacteroidetes in cancer group are significantly down-regulated and up-regulated compared with normal group, respectively. And the abundances of the phylums of Proteobbacteria and Fusobacteria were also significantly up-regulated in cancer group compared with normal group (P< 0.05). The abundances of Classes including Clostridia, Bacteroidia, and Negativicutes are the highest in normal group, whereas classes including Clostridia, Bacteroidia, and Baccilli are the highest in colon cancer group.
3.2.2. Class and order based microbial communities analysis
According to the class-based comparative microbial communities analysis (Fig. S2B), the class of Clostridia was significantly less in cancer group than that in normal group (P< 0.05). Meanwhile, the abundances of the classes including Negativicutes, Gammaproteobacteria, Bacilli, Actinobacteria are significantly higher in cancer group than that in normal group (P< 0.05). As shown in Fig. S2C, the abundances of orders including Clostridiales, Bacteroidales and Selenomonadales are the highest in normal group, whereas classes of Clostridiales, Bacteroidales and Lactobacillales are of the most abundance in cancer group. The Clostridiales class is significantly lower in colon cancer group, and the classes of Selenomonadale, Enterobacteriales, and Lactobacillales are significantly up-regulated in colon cancer group than that in normal group.
3.2.3. Genus and species-based microbial communities analysis
The comparative map for the different microbial communities in normal and cancer groups was depicted. The family-based differential map indicated that the abundance of the families of Lachnospiraceae, Bacteroidaceae, and Ruminococcaceae are significantly down-regulated in colon cancer group. And families including Prevotellaceae, Veillonellaceae, and Enterobacteriaaceae are significantly higher in cancer group than that in normal group ()). As shown in ), the most dominant genus in cancer group and normal group are Bacteroides, Prevotelia, Faecalibacterium, and Blautia. And the genus of Bacteroides, Faecalibacterium, and Roseburia in colon cancer group are significantly higher in normal group than that in normal group. And genus of Prevotella and Blautia in colon cancer group are significantly higher than that in normal group. The comparative species map of the two groups were depicted. The dominant species in the two groups are Faecalibacterium prausnitzii, Prevotella copri, and Bateroides vulgatus. The species of Faecalibacterium prausnitzii, Bateroides vulgatus, and Fusicatenibacter saccharivorans are significantly lower in cancer group than that in normal group (P< 0.05). The species of Prevetella copri and Escherichia coli are significantly higher in cancer group than that in normal group.
Figure 3. The microbial difference in normal group and colon cancer groups based on family (a); genus (b) and species (c)
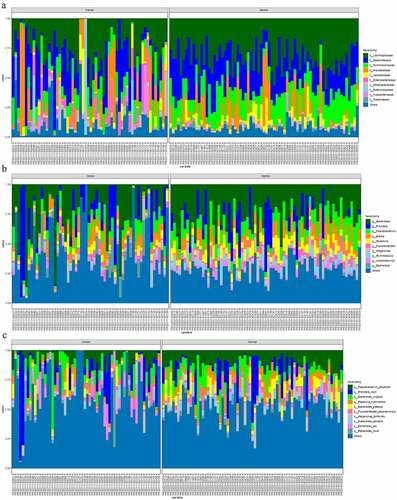
Beneficial bacteria including Bifidobacterium adolescent, Bifidobacterium Longum, Faecalibacterium prausnitzii, Roseburia faeci, and Fusicatenibacter Scharivorans were involved in the synthesis and consumption of neurotransmitters, and the contents of some microbial neuroactive metabolites also increased significantly. The intake of these beneficial bacteria can relieve the stress of the subjects. The contents of these beneficial species were significantly decreased in the colon cancer group compared with the normal group.
3.3. The heatmap analysis
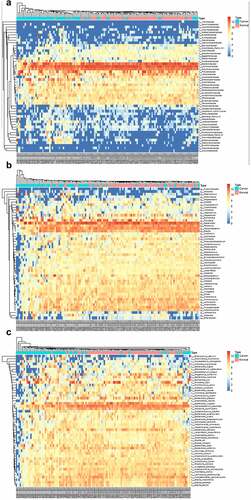
The heatmap based on different levels between cancer group and normal group is depicted. The heatmap based on phylum showed that the phylum of Firmicutes, Bacteroidetes, Proteobacteria, and Actinobacteria showed significant difference (P< 0.05). And partly samples of the two groups also showed significant difference (Fig. S3A). As shown in Fig. S3B, classes including Negativicutes, Clostridia, Bacteroidia, Gammaproteobacteria, Bacilli, Actinobacteria, Betaproteobacteria, and Erysipelotrichia showed significant difference between the cancer group and normal group. And the order of Selenomonadales, Clostridales, and Bacteroidales showed the most significant difference between the two groups (Fig. S3C). And partly samples from the two groups also showed significant difference in the order of Enterobacteriales, Bifidobacteriales, Lactobacillales, Coriobacteriales, B urkholderiales, and Erysipelotrichales.
The abundance of the family of Bacteroidaceae, Lachnospiraceae, and Ruminococcaceae in the normal group and cancer group showed very significant difference (P< 0.01), and the abundances of Prevotellaceae, Veillonellaceae, Coriobacteriaceae, Enterobacteriaceae, Clostridiaceae, Bifdobacteriaceae, Streptococcaceae, Peptostreptococcaceae, Eryipelotrichaceae, Acidaminococcaceae, Rikenellaceae, Burkholderiaceae, Tannerellaceae are relatively high ()). The genus differential map indicated that the genus of Prevotella, Bacteroides, Roseburia, Faecalibacerium, Blautia showed very significant difference in normal group and cancer group (P< 0.01), meanwhile, the abundance of genus of Clostridium, Sporobacter, Colinsella, Phasolarctobacterium, Acidaminococcus, Parasutterella, Romboutsia, Streptococcus, Parabacteroides, Erysipelatoclostridium, Pseudobutyrivibrio, Oscillibacter, Butricicoccus, Lachnoclostridium, Lactonifactor, Hespellia, Bifidobacterium, Subdoligranulum, Alistipes, Intestinimonas, Herbinix, Mobilitalea, Hungatella, Dorea, Coprococcus, Ruminococcus, Lachnospira, Anaeostipes, Fusicatenibacter, and Anaerocolumna showed a significant difference (P< 0.05) ()). And the abundance of the species of Megamonas funiformis, Bateroides coprocola, Escherichia coli, Prevotella copri, Ruminococcus albus, Alistipes putredinis, Bacteroides caccae, Collinsela aerofaciens, Ruminococcus bromii, Bacteroides plebeius, Anaerostipes caccae, Bacteroides vulgatus, Faecalibaterium prausnitzii, Roseburia inulinivorans, Bacteroides stercoris, Bacteroies dorei, Bacteroides uniformis, Gemmiger formicilis, Herbinix luporum, Anaerocolumna xylanovorans, Dorea longicatena, Coprococcus comes, Roseburia cecicola, Anaerocolumna cellulosiltica, Lachnospira pectinoschiza, Fusicatenibacter saccharivorans, Blautia massiliensis, Blautia wexlerae, and Blautia obeum showed very significant difference between the two groups (P< 0.01), the abundances of the species of Enterococcus faecium, Akkermansia muciniphila, Fusobacterim necrogenes, Klebsiella pneumoniae, Bacteroides fragilis, Bifidobacterium catenulatum, and Bifidobacterium longum did not show significant difference in the groups ()) .
Figure 4. The heatmap between the normal and colon cancer group based on different levels
Prevotella copri is strictly an anaerobic, which is extremely sensitive to oxygen and can only grow well completely in an anaerobic environment. It can metabolize polysaccharide such as Xylan, also can metabolize small molecular sugar such as hemicellulose, xylose. The development of cancer in colon results in the condition of low-oxygen and high-concentration of sugar, which facilitate the growth of P. copri. Higher levels of P. copri were also detected in patients with rheumatoid arthritis and psoriatic arthritis [Citation28–30].
M. uniformis has the potential to prevent and/or treat inflammation-related diseases such as digestive tract inflammation-related diseases such as ulcerative colitis, gastritis and gastroenteritis, as well as cardiovascular diseases such as inflammatory bowel disease rheumatoid arthritis. Thus, the colon cancer in the patients leads to the significant decrease of in the intestinal of M. uniformis patients suffered from colon cancer. It is true that there are significant differences in the gut microflora between gouty patients and healthy people. The gut bacteria of gouty patients are rich in bacteria such as Bacteroides caccae and Bacteroides xylanisolvens, while the other two species (Faecalibacterium prausnitzii and Bi dobacterium pseudocatenulatum) are absent in patients suffered from gouty [Citation31–34]. The results indicated that the genus of Bacteroides are beneficial bacterial for patients, and genus of Faecalibacterium and Bidobacterim are harmful for colon cancer patients.
3.4. Intergroup similarity analysis
PCOA (PCOA) is a kind of visualization method to study the similarity or difference of multi-dimensional data, which was used to investigate the similarity of microbial communities between normal group and colon cancer group.
PC1 and PC2 represent the first principal component and the second principal component, respectively, and the percentage after the principal component represents the contribution rate of this component to the sample difference. The distance of the sample points represents the similarity of the functional classification distribution in the samples. The results suggested that high similarity of the samples in the normal group, whereas great difference was observed in the samples from colon cancer group and the samples from the different groups. PC1 and PC2 contributed 15.51% and 8.65% to the difference between the two groups ()).
Figure 5. The significance differential analysis of the normal and colon cancer groups
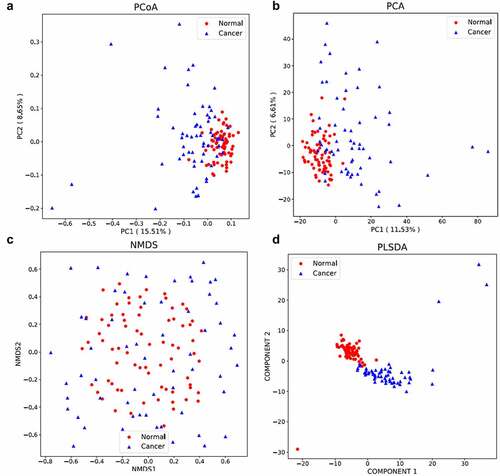
Principal component analysis is a technique to simplify the analysis of data, which can effectively identify the dominant elements and structures in the data. The similarity and difference among samples can be reflected by analyzing the distribution of bacterial community in different samples ()). PC1 and PC2 contributed 11.53% and 6.61% to the difference between the two groups.
NMDS (non-metric multidimensional scaling) reflected in the multi-dimensional space in the form of points, and the degree of difference between different samples according to the species information contained in the sample. The NMDS analysis is shown in ). And the distribution of colon cancer group is more disperse than that in normal group.
Partial least squares discrimination analysis (PLS-DA) is a multivariate statistical analysis method for discriminant analysis. Discriminant analysis (DA) is a common statistical analysis method to determine the classification of research objects according to the observed or measured values of several variables. The principle of this method is to train the characteristics of different treatment samples (such as observation samples and control samples), to generate training sets, and to test the credibility of training sets. The PLS-DA is analyzed in ), and the distribution of the samples was not so disperse, indicating the reliability of the sequencing results.
3.5. The biological correlation analysis
The UPGMA analysis of the normal and cancer group indicated the significant difference in the microbial communities (Fig. S4). LDA effect size analysis is an analysis tool for discovering and interpreting biomarkers of high latitude data. This method emphasizes statistical significance and biological correlation, and can discover biomarkers with statistical differences between groups. As shown in ), the most dominant bacterial communities include Clostridales, Clostridia, Firmicutes, Lachnospiraceae, Ruminococcaceae, Facalibacterium, and the most dominant species is Facalibacerium prausnitzii in normal group, species including Roseburia inulinivorans, Bacteroides plebeius, and Megamona funiformis took the second to the fourth places in the normal group. The most dominant bacteria communities in cancer group include Proteobacteria, Bacilli, Lactobacillales, Gammaproteobacteria, Enterobacteriales, Enterobacteriaceae, and Enterococcaceae. And the most dominant species in colon cancer group is Escherichia coli, followed by Bacteroides dorei, Enterococcus faecium, Neisseria mucosa, Bacteroides ovatus, and Bifidobacterium catenulatum.
Figure 6. The cladogram analysis of the normal and colon cancer group
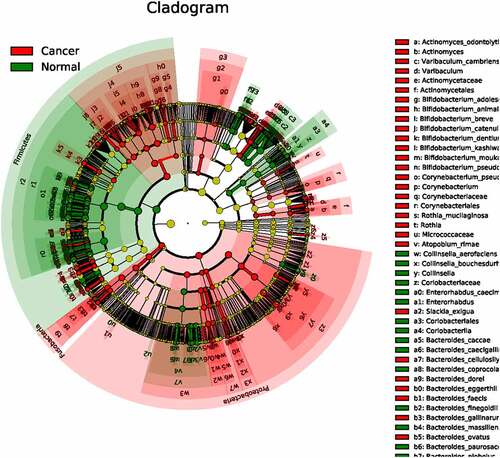
Proteobacteria are the largest group of bacteria, including many known pathogens such as E. coli, Salmonella, Vibrio cholerae, and Helicobacter pylori. There are also free-living species, including many nitrogen-fixing species. Bacteroides are Gram staining negative bacteria with the features of non-spore-forming, obligate anaerobic bacillus. Bacteroides normally inhabiting in the intestine, oral cavity, upper respiratory tract, and reproductive tract of humans and animals. Due to the long-term use of broad-spectrum antibiotics, hormones, immunosuppressants, bacteroides can cause the body immune function disorders or dysbacteriosis, leading to endogenous infection. Bacteroides can decompose peptone or glucose to produce succinic acid, acetic acid, formic acid, lactic acid, and propionic acid, thus facilitating the growth and transfer of colon cancer cells [Citation33,Citation34].
The cladogram between the normal group and colon cancer group was also depicted. As shown in ), the radiations from inner to outer of different circles represented seven taxonomic levels of Phylum, family, genus and species, and each node represented a species classification at that level. The yellow node color indicates that the species has no significant difference in the comparison group, if the node color is red, the species has significant difference in the comparison group (p < 0.05). The results showed that most significant different species between the two groups belong to proteobacteria phylum, and the least most significant different species between the two groups belong to firmicutes phylum.
4. Conclusions
In this study, excrement from the healthy crowd and patients suffered from the colon cancer were sequenced. The significant microbial communities based on levels of phylum, class, order, family, genus, and species were analyzed using comparative composition analysis and heatmap. The phylum of Fermicutes, Bacteroidetes in cancer group are significantly down-regulated and up-regulated compared with normal group. The species including Faecalibacterium prausnitzii, Bateroides vulgatus, and Fusicatenibacter saccharivorans are significantly lower in cancer group than that in normal group (P< 0.05), suggesting that the complement of these species would be beneficial for colon cancer patients. The species of Prevetella copri, M. uniformis, and Escherichia coli are significantly higher in cancer group than that in normal group. The comparative results indicated that some beneficial bacterium significantly decreased in cancer group, and some harmful bacterium significantly increased in colon cancer group, which maybe due to the increased acidity, sugar and decreased oxygen content in colon cancer cells. The results would provide mirobial approaches for the treatment of colon cancer by the intake of beneficial microbial communities.
Highlights
The microbial diversity of the faecal from normal crowds and colorectal cancer patients were analyzed;
Species including Faecalibacterium prausnitzii, Bateroides vulgatus are significantly lower in CRC group;
The results indicated the role of some gut microbial for the development of CRC;
This study would offer microbial clues for the prevention and treatment of CRC.
Supplemental Material
Download ()Disclosure statement
No potential conflict of interest was reported by the author(s).
Supplementary material
Supplemental data for this article can be accessed here
References
- Hooper LV, Gordin JI. Commensal host-bacterial relationships in the gut[J]. Science. 2001;292:1115–1118.
- Zijlmans MA, Korpela K, Riksen-Walraven JM, et al. Maternal prenatal stress is associated with the infant intestinal microbiota[J]. Psychoneuroendocrinology. 2015;53:233–245.
- Palmer C, Bik EM, Digiulio DB, et al. Development of the human infant intestinal microbiota[J]. PLoS Biol. 2007;5(7):e177.
- Reyes A, Haynes M, Hanson N, et al. Viruses in the faecal microbiota of monozygotic twins and their mothers[J]. Nature. 2010;466:334–338.
- Van Daele E, Knol J, Belzer C. Microbial transmission from mother to child: improving infant intestinal microbiota development by identifying the obstacles[J]. Crit Rev Microbiol. 2019;45(5/6):613–648.
- Huttenhower C, Dirk G, Knight R, et al. Structure, function and diversity of the healthy human microbiome[J]. Nature. 2012;486:207–214.
- Browne HP, Forster SC, Anonye BO, et al. Culturing of ‘unculturable’ human microbiota reveals novel taxa and extensive sporulation[J]. Nature. 2016;533:543–546.
- Kintses B, Mehi O, Ari E, et al. Phylogenetic barriers to horizontal transfer of antimicrobial peptide resistance genes in the human gut microbiota[J]. Nat Microbiol. 2019;4(3):447–458.
- Halatchev IG, O’Donnell D, Hibberd MC, et al. Applying indirect open-circuit calorimetry to study energy expenditure in gnotobiotic mice harboring different human gut microbial communities[J]. Microbiome. 2019;7(1):1–8.
- Liu H, Han M, Li SC, et al. Resilience of human gut microbial communities for the long stay with multiple dietary shifts[J]. Gut. 2019;68(12):2254–2255.
- Wang Z, Klipfell E, Bennett BJ, et al. Gut flora metabolism of phosphatidylcholine promotes cardiovascular disease[J]. Nature. 2011;472:57–63.
- Springer NL, Iyengar NM, Bareja R, et al. Obesity-associated extracellular matrix remodeling promotes a macrophage phenotype similar to tumor-associated macrophages[J]. Am J Pathol. 2019;189(10):2019–2035.
- Zhao L. The gut microbiota and obesity: from correlation to causality[J]. Nature Rev Microbiol. 2013;11(9):639–647.
- Sender R, Fuchs S, Milo R. Revised estimates for the number of human and bacteria cells in the body[J]. PLoS Biol. 2016;14(8):e1002533.
- Pylkas AM, Juneja LR, Slavin JL. Comparison of different fibers for in vitro production of short chain fatty acids by intestinal microflora[J]. J Med Food. 2005;8(1):113–116.
- De Muinck EJ, Lundin K, Trosvik P. Linking spatial structure and community-level biotic interactions through cooccurrence and time series modeling of the human intestinal microbiota[J]. mSystems. 2017;2(5):e00086–17.
- Qin J, Li R, Raes J, et al. A human gut microbial gene catalogue established by metagenomic sequencing[J]. Nature. 2010;464:59–65.
- Sebak M, Saafan AE, Abdelghani S, et al. Bioassay- an d metabolomics-guided screening of bioactive soil actinomycetes from the ancient city of Ihnasia, Egypt[J]. PLoS ONE. 2019;14(12):e226959.
- Albuquerque I, Silva AR, Carreira MS, et al. Proteus mirabilis endocarditis[J]. BMJ Case Rep. 2019;12(8):1–3.
- Chaplin A, Parra P, Laraichi S, et al. Calcium supplementation modulates gut microbiota in a prebiotic manner in dietary obesemice[J]. Mol Nutr Food Res. 2016;60(2):468–480.
- Yang F, Zeng X, Ning K, et al. Saliva microbiomes distinguish caries-active from healthy human populations[J]. Isme J. 2012;6(1):1–10.
- Lassiger-Herfurth A, Pontarollo G, Grill A, et al. The gut microbiota in cardiovascular disease and arterial thrombosis[J]. Microorganisms. 2019;7(12):691.
- Spindler KG, Demuth C, Sorensen BS, et al. Total cell-free DNA, carcinoembryonic antigen, and C-reactive protein for assessment of prognosis in patients with metastatic colorectal cancer[J]. Tumor Biol. 2018;40(11):1–8.
- Liang PS, Dominitz JA. Colorectal cancer screening: is colonoscopy the best option?[J]. Med Clin North Am. 2019;103(1):111–123.
- Li Y, Yang Y, Shen F, et al. Partitioning biochar properties to elucidate their contributions to bacterial and fungal community composition of purple soil[J]. Sci Total Environ. 2019;648:1333–1341.
- Zhang M, Ma W, Zhang J, et al. Analysis of gut microbiota profiles and microbe-disease associations in children with autism spectrum disorders in China[J]. Sci Rep. 2018;8(1):13981.
- Xi Y, Yuefen P, Wei W, et al. Analysis of prognosis, genome, microbiome, and microbial metabolome in different sites of colorectal cancer[J]. J Transl Med. 2019;17(1):353. DOI:10.1186/s12967-019-2102-1
- Burns MB, Montassier E, Abrahante J, et al. Colorectal cancer mutational profiles correlate with defined microbial communities in the tumor microenvironment[J]. PLoS Genet. 2018;14(6):e1007376.
- Coatsworth H, Caicedo PA, Van Rossum T, et al. The composition of midgut bacteria in aedes aegypti (Diptera: culicidae) that are naturally susceptible or refractory to dengue viruses[J]. J Insect Sci. 2018;18(6):1–7.
- Vetizou M, Pitt JM, Daillere R, et al. Anticancer immunotherapy by CTLA-4 blockade relies on the gut microbiota[J]. Science. 2015;350:1079–1084.
- Lü J, Jia Y, Li J, et al. Gegen Qinlian decoction enhances the effect of PD-1 blockade in colorectal cancer with microsatellite stability by remodelling the gut microbiota and the tumour microenvironment[J]. Cell Death Dis. 2019;10(6):415.
- Ormerod KL, Wood DL, Lachner N, et al. Genomic characterization of the uncultured bacteroidales family S24-7 inhabiting the guts of homeothermic animals[J]. Microbiome. 2016;4(1):36.
- Wierzbicka-Wos A, Henneberger R, Batista-Garcia RA, et al. Biochemical characterization of a novel monospecific endo-beta-1,4-glucanase belonging to GH family 5 from a rhizosphere metagenomic library[J]. Front Microbiol. 2019;10:1342.
- Ma T, Jin H, Kwok LY, et al. Probiotic consumption relieved human stress and anxiety symptoms via modulating the gut microbiota and neuroactive potential. Biorxiv, 2020.