
ABSTRACT
Despite the multiple diagnostic and therapeutic strategies implemented in clinical practice, the mortality rate of patients with pulmonary arterial hypertension (PAH) remains high. Understanding the mechanisms and key genes involved could provide insight into the drivers of the pathogenesis of PAH. In this research, we aimed to examine the mechanisms underlying PAH and identify key genes with potential usefulness as clinical biomarkers of PAH and thereby establish therapeutic targets for PAH. The datasets GSE117261, GSE113439, and GSE53408 were downloaded from the Gene Expression Omnibus (GEOs) database. We used weighted gene coexpression network analysis (WGCNA) to identify networks and the most relevant modules in PAH. Functional enrichment analysis was performed for the selected clinically relevant modules. The least absolute shrinkage and selection operator (LASSO) was applied to identify key genes in lung samples from patients with PAH. The genes were validated in a monocrotaline-induced PAH rat model. Three clinically relevant modules were identified through average linkage hierarchical clustering. The genes in the clinically relevant modules were related to endothelial cell differentiation, inflammation, and autoimmunity. Seven genes were screened as key genes significantly associated with PAH. Interferon-induced protein 44-like (IFI44L) and signal transducer and activator of transcription 1 (STAT1) were expressed at higher levels in the lung tissues of the PAH rat model than in those of the controls. Our findings reveal the novel pathological mechanisms underlying PAH and indicate that STAT1 and IFI44L may represent potential therapeutic targets in PAH.
Introduction
Pulmonary arterial hypertension (PAH) is an incurable disease characterized by endothelial dysfunction and dysregulated pulmonary vascular smooth muscle cells and fibroblasts proliferation [Citation1]. The recent progress in the research on the pathological mechanisms underlying PAH has led to the development of targeted therapies. Strategies targeting crucial pathways, including nitric oxide, prostacyclin, RhoA/Rho kinase pathway modulators, and endothelin-1, have been used in patients with PAH [Citation2]. Although the current PAH-targeted therapies can improve the quality of life and reduce the hospital readmission rate, the 5-year mortality rate of patients with PAH remains approximately 50% [Citation3]. Therefore, a deeper understanding of the molecular mechanisms underlying PAH may enable the development of novel drugs to improve the survival rate of patients.
Weighted gene co-expression network analysis (WGCNA) is a bioinformatics method that facilitates network-based gene screening to identify novel biomarkers or therapeutic targets [Citation4]. In recent years, studies have aimed to examine the molecular mechanisms and screen hub genes related to PAH on the basis of differentially expressed genes (DEGs) [Citation5,Citation6]. However, the use of WGCNA to identify genes involved in PAH remains limited. Therefore, we used the mRNA expression profiles of patients with PAH to perform a WGCNA for the identification of networks significantly associated with PAH. Understanding the mechanisms and key genes involved could provide insight into the drivers of the pathogenesis of PAH. In this research, we aimed to examine the underlying pathological mechanisms of PAH to identify targets for early diagnosis and treatment of PAH. In addition, we investigated the relationship between hub genes and infiltrating immune cells to better understand the immunological mechanisms that contribute to the development of PAH.
Methods
Data resources
The mRNA expression profiles of patients with PAH were obtained from the Gene Expression Omnibus (GEOs) (https://www.ncbi.nlm.nih.gov/geoprofiles/) [Citation7]. Datasets GSE117261 [Citation8] (58 patients with PAH and 25 controls), GSE113439 [Citation9] (15 patients with PAH and 11 controls), and GSE53408 [Citation10] (12 patients with PAH and 11 controls) were analyzed. Moreover, the GSE48149 [Citation11] dataset was used as the validation set.
Construction of the gene coexpression network
A coexpression network of 4000 genes with the highest median absolute deviation was constructed using WGCNA [Citation12,Citation13]. Sample outliers were identified by clustering and removed. A power of β = 9 (scale-free R2 = 0.96) was selected to ensure a scale-free topology. Hierarchical clustering was performed by constructing a topological overlap matrix, and genes with coexpression relationships were grouped through gene network connectivity. The minimum cutoff size was set to 30. Highly similar gene modules were further analyzed. The relationship between clinical features and gene modules was evaluated with the Pearson correlation analysis to identify biologically meaningful modules.
Gene ontology and pathway enrichment analyses
Metascape (https://metascape.org/gp/index.html) [Citation14] was used to assess the biological functions of genes upregulated or downregulated in patients with PAH. Gene ontology (GO) and Kyoto Encyclopedia of Genes and Genomes (KEGG) pathway enrichment analyses were performed. A P value < 0.01 was considered to indicate statistical significance.
Protein-protein interaction network and hub protein screening
STRING (http://string-db.org) [Citation15,Citation16] was used to construct the protein-protein interaction (PPI) network of modules with a confidence score > 0.40. Hub genes were identified using the Cytoscape software V3.5.1 (http://cytoscape.org) [Citation17]. Plug-in CytoHubba was used to detect the top 30 hub genes in each clinically significant module identified by WGCNA.
Screening of key genes
RNA expression data were processed using the ‘SVA’ package [Citation18] and the ‘ComBat’ algorithm in R.4.0.3. Then, we used the ‘limma’ package [Citation19] to evaluate the DEG between the PAH and control groups. Genes with adjusted P values < 0.05 were considered as DEG. The top 30 hub genes in each clinically significant module were added together and crossed with the DEGs. We then used the least absolute shrinkage and selection operator (LASSO) logistic regression to identify the key genes [Citation20]. In addition, a receiver-operating characteristic (ROC) curve analysis was performed to evaluate the stability and sensitivity of the LASSO model in identifying PAH by using the pROC package in R software version 3.6.0 [Citation21].
Evaluation of immune cell infiltration
We used the gene expression matrix of xCell (https://xcell.ucsf.edu) to obtain the immune cell infiltration matrix [Citation22]. The Wilcoxon method was used to analyze the variance, and the cutoff P value for the cell analyses was <0.05. Only immune cells were included in the analysis. The ‘ggplot2’ package was used to create violin diagrams to illustrate the differences in immune cell infiltration.
Construction of the monocrotaline-induced PAH rat model
We randomly divided male Sprague-Dawley (SD) rats (weight, 180–220 g; age: 4–6 weeks; SPF class) into two groups, the control (n = 6) and PAH groups (n = 6). The rats in the PAH group were intraperitoneally injected with monocrotaline (MCT; 60 mg/kg) on day 0. The control rats were intraperitoneally injected with the same volume of saline on day 0. The mean pulmonary arterial pressure of the rats was measured as the mean right ventricular systolic pressure (mRVSP) by right heart catheterization at 4 weeks after intraperitoneal injection. All the rats were sacrificed 4 weeks after MCT administration. All the animal experiments were performed in accordance with the National Institutes of Health Guide for the Care and Use of Laboratory Animals.
Real-time polymerase chain reaction (PCR)
Total RNA was extracted from frozen lung sections using the TRIzol reagent (Invitrogen) and reverse-transcribed into cDNA with a PrimeScript RT reagent kit (TaKaRa Biotechnology). The relative gene expression was calculated using the 2−ΔΔCt method. GAPDH was used as the reference housekeeping gene. The sequences of the primers were as follows: HIST1H1C (F: 5'-GAAGCCCAAGAAGGCTACGG-3'; R: 5'-GCTTTGGGCTTTACCGCTCT-3'), IFI44L (F: 5'-GCTGTGTGATTCAATGGGGC-3'; R: 5'-GGAGAGGCAGCGTAAGTGAA-3'), STAT1 (F: 5'-GAACGTGCTCTGCTCAAGGA-3'; R: 5'-AACAGCATGGAAGTCGGGTT-3'), TAF4B (F: 5'-CCTGCGGTGACAAGTACAGT-3'; R: 5'-TTGCGGTCCACCATTAGCAG-3'), PRKAR2B (F: 5'-TGGAAATCGCTCGGTGTCTC-3'; R: 5'-TCATGCAGTGGGCTCAACAA-3'), CEP57 (F: 5'-CATCGGGGACTTGGATTCGG-3'; R: 5'-TCAGCTAGGACGCTCGAAAA-3'), MLLT3 (F: 5'-ATGTCCGCCATCTACCCTCA-3'; R: 5'-CCATCCAGTCGTGGGTGAAG-3'), GAPDH (F: 5'-GAAGGTCGGTGTGAACGGAT-3'; R: 5'-CCCATTTGATGTTAGCGGGAT-3'). Real-time PCR was conducted using the SYBR Premix Ex Taq kit (TaKaRa Biotechnology) and an ABI PRISM 7900 Sequence Detector System (Applied Biosystems).
Results
In this research, we aimed to explore the mechanisms underlying PAH and identify key genes that may be employed as potential clinical biomarkers and thereby provide therapeutic targets for PAH. Three clinically relevant modules were identified through the WGCNA. The GO and KEGG enrichment analyses revealed that the genes in the clinically relevant modules were related to endothelial cell differentiation, inflammation, and autoimmunity. The LASSO was applied to identify key genes, and seven genes were screened as key genes significantly associated with PAH. Besides, IFI44L and STAT1 were expressed at higher levels in the lung tissues of the PAH rat model than in those of the controls. Our findings reveal the novel pathological mechanisms underlying PAH and indicate that STAT1 and IFI44L may represent potential therapeutic targets in PAH. The research flow chart is represented in the .
Construction of gene coexpression modules
The gene expression profiles of the human lung tissues from 45 healthy individuals and 85 patients with severe PAH were evaluated. Expression data were normalized, and 4000 genes with the most significant changes (highest median absolute deviations) were used for WGCNA analysis. After removing outliers (Supplementary Figure 2), a soft-threshold filtering approach (soft-threshold β = 9) was used to construct a scale-free network using the WGCNA package (). In accordance with the weighted correlation, we analyzed the hierarchical clustering and segmented the clustering results in accordance with the set criteria. A total of nine gene modules were obtained, which are represented by the branches and different colors of the clustering tree shown in .
Figure 1. Construction of gene co-expression modules. (a) Analysis of network topology for various soft-thresholding powers. (b) Gene clustering tree (dendrogram) obtained by hierarchical clustering of adjacency-based dissimilarity. (c) Module-feature associations. Each row corresponds to a module eigengene, and each column corresponds to a clinical feature. Red represents a positive correlation, and green represents a negative correlation. The darker the corresponding color, the stronger the correlation coefficient. (d) Scatter plot of eigengene modules
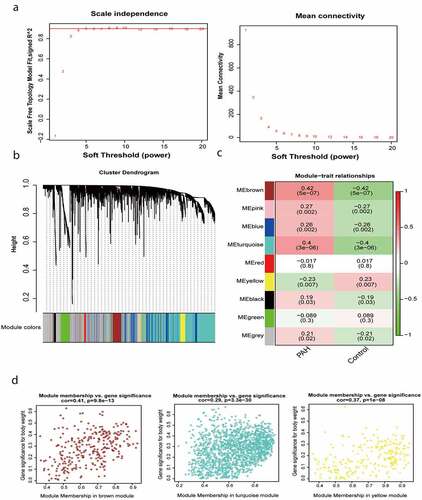
Identification of key modules
We calculated the correlation between the gene modules and the phenotype and identified three module eigengenes (shown in brown, turquoise, and yellow) strongly associated with PAH (). The module membership and gene significance values were as follows: brown module, cor = 0.41 and P = 9.8e-13; turquoise module, cor = 0.29 and P = 3.3e-30; and yellow module, cor = 0.37 and P = 1e-08 (). It should be noted that in WGCNA, the gray module always represents background genes (noise genes) outside the modules, with no distinct module assignment [Citation8]. Therefore, a certain percentage of gray module is normal and acceptable.
GO and pathway enrichment analyses
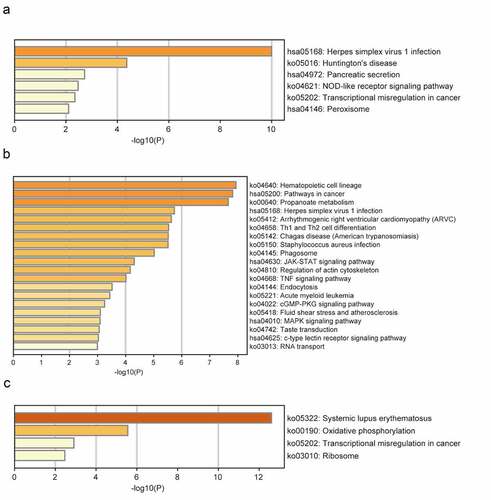
The brown module was significantly enriched in GO biological processes associated with mitochondrial adenosine triphosphate (ATP) synthesis-coupled electron transport, regulation of endothelial cell differentiation, protein-containing complex disassembly, interleukin-1-mediated signaling, and positive regulation of developmental growth (). The enriched KEGG pathways included herpes simplex virus 1 (HSV1) infection and NOD-like receptor signaling (). The turquoise module was significantly enriched in GO biological processes related to small GTPase-mediated signal transduction, positive regulation of cell migration, response to growth factors, regulation of cytokine production, regulation of response to cytokine stimulus, and regulation of innate immune responses (). The enriched KEGG pathways included HSV1 infection, Th1 and Th2 cell differentiation, Janus kinase (JAK)-STAT signaling, and tumor necrosis factor (TNF) signaling (). The significantly enriched GO biological processes in the yellow module included the nucleosome assembly, cellular respiration, TNF production, negative regulation of gene silencing, and myeloid cell activation involved in immune responses (). The enriched pathways included systemic lupus erythematosus, oxidative phosphorylation, and transcriptional dysregulation in cancer ().
Figure 2. GO functional analysis of the profiles. GO biological processes of genes in brown module (a), turquoise module (b), yellow module (c)
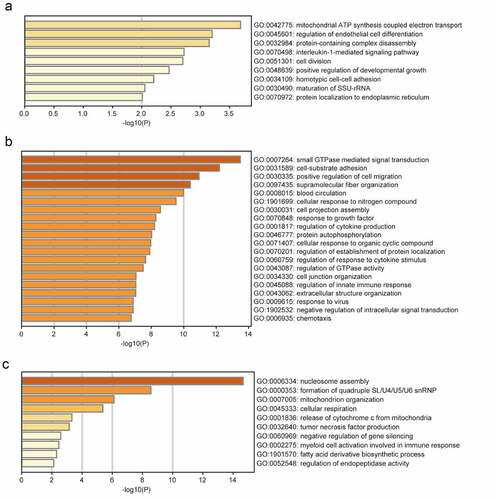
Figure 3. KEGG pathway analysis of the profiles. KEGG enrichment analysis of genes in brown module (a), turquoise module (b), yellow module (c)
Identification of hub genes
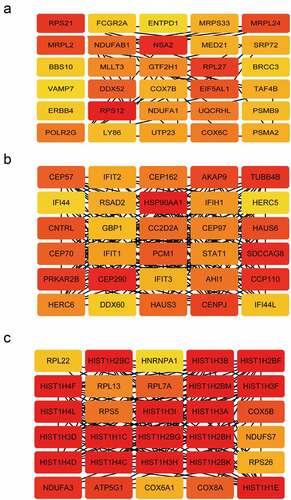
From the three modules, the top 30 genes with the highest module membership values in each module were selected as hub genes. We obtained a total of 90 candidate genes ().
Figure 4. Identification of hub genes. The network of hub genes in the (a) brown module, (b) turquoise module, (c) yellow module. Red represents a positive correlation, The darker the color, the stronger the correlation
Screening and verification of the key genes
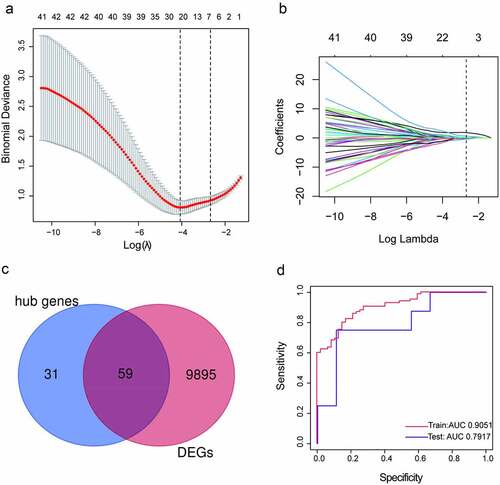
To determine the most relevant genes in the development of PAH, we identified the DEGs between the specimens from the patients with PAH and those from healthy volunteers and yielded 9954 DEGs with adjusted P values < 0.05. Then, we compared the 90 hub genes and 9954 DEGs and obtained 59 common genes (). LASSO logistic regression revealed that seven (HIST1H1C, IFI44L, STAT1, TAF4B, PRKAR2B, MLLT3, and CEP57) of the 59 genes were key genes in the development of PAH (, b), with coefficients of −0.22915, 0.055855, 0.083195, 0.204453, 0.108119, 0.32228, and 0.099729 for HIST1H1C (Histone H1c), IFI44L (interferon-induced protein 44-like), STAT1(Signal transducer and activator of transcription 1), TAF4B (TATA-box binding protein associated factor 4b), PRKAR2B (cAMP-dependent protein kinase type II-beta regulatory subunit), MLLT3 (mixed-lineage leukemia translocated to chromosome 3 protein), and CEP57 (centrosomal protein 57), respectively. A ROC curve analysis of the LASSO regression model was conducted to predict PAH in the training set, and the area under the curve (AUC) was 0.9051. To further test the diagnostic efficacy, we validated it with the GSE48149 dataset as the testing set, and the AUC was 0.7917, which suggests that the genes in the model might have high diagnostic values (). The diagnostic efficacy of the seven key genes are represented in Supplementary Figure 3.
Figure 5. Screening and verification of key genes. (a-b) Least absolute shrinkage and selection operator (LASSO) logistic regression algorithm to screen key genes.(c) Venn diagram. Blue section stands for hub genes, pink section stands for differentially expression genes (DEGs), 59 genes in the middle overlapping section. (d) Receiver operating characteristic (ROC) curves analysis of training set and testing set. AUC, area under the curve
Validation of the key genes in the rat PAH model
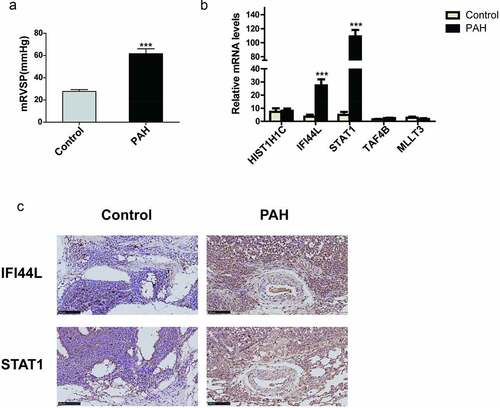
The mean right ventricular systolic pressure (mRVSP) of the rats in the PAH group was significantly higher than that of the rats in the control group (P < 0.001; ). To confirm the clinical significance of the seven genes, we evaluated their mRNA levels in the lung tissues from the MCT-PAH or control rats. IFI44L and STAT1 were expressed at higher levels in the PAH lung tissues than in the control lung tissues (P < 0.001), whereas HIST1H1C, TAF4B, and MLLT3 showed no significant differences in expression level between the two groups (). The mRNAs of PRKAR2B and CEP57 could not be detected. We also performed immunohistochemical staining of rat lung tissues for STAT1 and IFI44L. The STAT1 and IFI44L expression levels were profoundly higher in the lung tissues of the PAH rats than in those of the control rats ().
Figure 6. Validation of the key genes in a rat PAH model (a) Mean right ventricular systolic pressure (mRVSP) in control and MCT-induced PAH rats. (b) The levels of HIST1H1C, IFI44L, STAT1, TAF4B, and MLLT3 mRNA expression in lung tissues from control and MCT-induced PAH rats; (c) The expression of IFI44L and STAT1 in the lung tissue of the control group and PAH group. Representative immunostaining images of lung sections show the expression of IFI44L and STAT1 increased in the lung tissues of MCT-induced PAH rats. Scales bars, 50 μm for high-resolution images (original magnificationⅹ400). N = 6 for the control group and PAH group. Compared with the control group, ***P < 0.001. Data presented in A and B are mean ± SEM of three independent experiments. PAH, pulmonary arterial hypertension
Immune cell infiltration
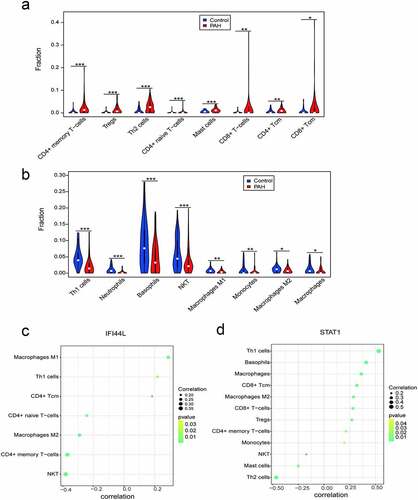
The levels of CD4+ memory T cells, regulator T cells (Tregs), Th2 cells, CD4+-naive T cells, mast cells, CD8+ T cells, CD4+ central memory T (Tcm) cells, and CD8+ Tcm cells were higher in the PAH tissues than in the control samples (). By contrast, the levels of Th1 cells, neutrophils, basophils, NKT cells, M1 macrophages, monocytes, M2 macrophages, and macrophages were lower in the PAH tissues than in the control samples ().
Figure 7. Different immune cell infiltration between PAH and control group. (a) Violin diagram of the proportion of immune cells which infiltrated more in PAH group than in control group; (b) Violin diagram of the proportion of immune cells which infiltrated less in PAH group than in control group. ***P < 0.001, **P < 0.01, *P < 0.05. Correlation between IFI44L, STAT1, and infiltrating immune cells. (c) Correlation between IFI44L and infiltrating immune cells. (d) Correlation between STAT1 and infiltrating immune cells. PAH, pulmonary arterial hypertension
Relationships between IFI44L, STAT1, and immune cell infiltration
The correlation analysis revealed that the IFI44L levels were significantly associated with the levels of M1 macrophages, Th1 cells, and CD4+ Tcm cells. By contrast, the IFI44L levels negatively correlated with the levels of CD4+-naive T cells, M2 macrophages, CD4+ memory T cells, and NK T cells (). STAT1 levels were positively associated with Th1 cells, basophils, and macrophages, but negatively correlated with the levels of NKT, mast cells, and Th2 cells ().
Discussion
In this study, we performed a WGCNA and identified nine gene modules associated with PAH. The enrichment analyses revealed that the most enriched GO terms of the biological processes in the brown module were associated with cell metabolism and endothelial cell differentiation and inflammation. Studies have shown that mitochondrial metabolic dysfunction in pulmonary arterial endothelial cells, pulmonary artery smooth muscle cells (PASMCs), and ventricular cardiomyocytes was linked to PAH progression [Citation23–25]. The identified GO category ‘regulation of endothelial cell differentiation’ fits well with the concept emphasizing that endothelial cell dysfunction is one of the most important factors predisposing to vascular remodeling and pulmonary vascular occlusion in PAH. Moreover, IL-1β stimulation in PASMCs has been shown to promote inflammation, proliferation, and migration [Citation26]. The significantly enriched functions in the turquoise module were associated with small GTPase-mediated signal transduction. The most well-studied small GTPase in PAH is Rho-kinase belonging to the Ras superfamily. Activation of Rho-kinase in PAH induces calcium sensitization, which contributes to the contractile, cell proliferation, and anti-apoptotic phenotype of PASMCs [Citation27,Citation28]. The enriched KEGG pathways in the turquoise module included the signaling pathways involved in inflammation, immunity, cell migration, and proliferation. These pathways included the JAK-STAT signaling pathway, TNF signaling pathway, and mitogen-activated protein kinase (MAPK) signaling pathway. These findings suggest that these signaling pathways play a critical role in the inflammatory responses in PAH. Recent studies have shown that in vitro inhibition of Jak1 and Jak2 with ruxolitinib reduced the proliferation and migration of PASMCs in patients with PAH in a dose-dependent manner [Citation29]. These signaling pathways, which are associated with PAH, could be targeted therapeutically for the prevention and treatment of PAH. HSV1 signaling was significantly enriched among the genes in the brown and turquoise modules. The genes in the yellow module were related to nucleosome assembly, mitochondrial organization, and cellular respiratory, all of which may have a negative correlation with PAH.
Moreover, seven potential hub genes associated with PAH were screened, namely HIST1H1C, IFI44L, STAT1, TAF4B, PRKAR2B, MLLT3, and CEP57. Research on the role of these genes in PAH is limited, and future investigations are required to elucidate their clinical relevance in PAH. We found that among these genes, IFI44L and STAT1 were the most prominent DEGs between the lung tissues of the PAH rats and those of the control rats. IFI44L belonging to the IFI44 family is a type I interferon-stimulated gene (ISG) [Citation30]. IFI44L has been considered to play a role in inflammation, autoimmune disorders, and cancer [Citation31]. Recent evidence suggests IFI44L as a novel tumor suppressor regulating cancer stemness and metastasis in hepatocellular carcinoma by modulating Met/Src signaling [Citation32]. Using IFI44L expression levels, Weeding et al. distinguished individuals with systemic lupus erythematosus (SLE) from healthy controls. They also found that IFI44L hypomethylation was a highly sensitive and specific marker of SLE [Citation33,Citation34]. Recently, Busse et al. and Marta et al. demonstrated that IFI44L negatively regulated innate immune responses induced by viral infections and could be a promising therapeutic target for diseases associated with excessive IFN-driven proinflammatory responses [Citation30,Citation35].
STAT1 is a nuclear transcription factor that plays an important role in the cell cycle, cell apoptosis, and immune responses [Citation36]. In this study, we found that the JAK-STAT signaling pathway was significantly enriched in the turquoise gene module. Previous studies showed that STAT3 is one of the main intracellular transcription factors involved in PAH-associated vascular remodeling [Citation37]. Recent studies have also shown that IL-6 initiated JAK-STAT signaling to induce the transcription of proinflammatory and pro-angiogenic genes, thereby promoting PAH development [Citation38]. The IFN-STAT1 pathway can promote inflammation and endothelial dysfunction via several mechanisms, including the stimulation of proinflammatory cytokine expression and the production of reactive oxygen species and nitric oxide [Citation39]. The IFN-STAT1 pathway also promotes the release of monocyte chemoattractant protein −1 (MCP-1) from monocytes; in turn, MCP-1 promotes PAH progression by recruiting leukocytes and activating immune cells at sites of vascular inflammation [Citation39,Citation40]. These findings indicate that IFI44L and STAT1 may represent promising therapeutic targets for PAH.
Altered inflammation and immune responses are increasingly recognized as key pathological drivers of PAH. In this study, we used xCell to comprehensively evaluate the immune infiltration in lung tissues from patients with PAH to obtain a deeper understanding of the inflammatory components associated with the pathogenesis of PAH. We found that the lung tissues from the patients with PAH had increased levels of infiltrating Th2 cells, Tregs, and mast cells and decreased levels of macrophages. PAH is associated with immune dysregulation characterized by increased perivascular infiltration of T cells and mast cells and dysfunction of Th2 cells and Tregs [Citation3]. Pathogenic Th2 cells have been shown to promote pulmonary artery muscularization by secreting IL-13 [Citation41]. Treg cells have been shown to maintain pulmonary vascular homeostasis by attenuating vascular inflammation, thereby preventing vascular injury [Citation42]. In addition, the accumulation of macrophages in pulmonary arterioles has been characterized as a prominent pathological feature of PAH. We found decreased infiltration of macrophages in the lung tissues from the patients with PAH. Resident macrophages in the alveoli and interstitium maintain an anti-inflammatory microenvironment by secreting IL-10, which prevents the activation of Th1 and Th17 inflammatory responses in the lungs [Citation41,Citation43]. Alveolar macrophages that tend to be anti-inflammatory and regenerative are depleted in the setting of PAH. The decreased infiltration of macrophage cells may be attributed to the loss of interstitial resident macrophages in our samples.
We also analyzed the relationship between IFI44L, STAT1, and immune cells and found that IFI44L expression levels positively correlated with the levels of macrophages M1 and Th1 cells. Similarly, STAT1 expression levels were positively associated with the levels of macrophages and Th1 cells and negatively associated with mast cells. Therefore, IFI44L and STAT1 may be involved in signaling pathways related to the recruitment of inflammatory cells. These hypotheses require further research to better understand the complex interactions between genes and immune cells.
Conclusion
In conclusion, we identified novel signaling pathways, immune profiles, and seven key genes associated with the development of PAH. The experimental validation using lung tissue samples from a PAH rat model revealed that IFI44L and STAT1 are the most relevant genes and may be used as novel biomarkers of PAH. However, some important limitations remain in our study. Information on the diagnostic, inclusion criteria, and the treatments for the PAH patients registered in the database was not available. Another important limitation is the lack of validation of the discovered key genes in lung tissue samples from PAH patients.
Supplemental Material
Download ()Acknowledgements
This work was supported by the National Natural Science Foundation of China (81770378).
Disclosure statement
The authors declare no competing interests.
Supplementary material
Supplemental data for this article can be accessed here.
Additional information
Funding
References
- Thenappan T, Ormiston ML, Ryan JJ, et al. Pulmonary arterial hypertension: pathogenesis and clinical management. BMJ. 2018 Mar;14(360):j5492.
- Satoh K. Drug discovery focused on novel pathogenic proteins for pulmonary arterial hypertension. J Cardiol. 2021 February 6;S0914-5087(21):00022–8.
- Xiao Y, PP C, RL Z, et al. Pathological Mechanisms and Potential Therapeutic Targets of Pulmonary Arterial Hypertension: a Review. Aging Dis. 2020 December 1;11(6):1623–1639.
- Kakati T, Bhattacharyya DK, Barah P, et al. Comparison of Methods for Differential Co-expression Analysis for Disease Biomarker Prediction. Comput Biol Med. 2019 Oct;113:103380.
- Zeng Y, Li N, Zheng Z, et al. Screening of key biomarkers and immune infiltration in Pulmonary Arterial Hypertension via integrated bioinformatics analysis. Bioengineered. 2021;Dec;12(1):2576–2591.
- Huang R, Zheng X, Wang J. Bioinformatic exploration of the immune related molecular mechanism underlying pulmonary arterial hypertension. Bioengineered. 2021;December:12(1):3137–3147.
- Barrett T, Wilhite SE, Ledoux P, et al. NCBI GEO: archive for functional genomics data sets–update. Nucleic Acids Res. 2013 January;41( Database issue):D991–5.
- Stearman RS, Bui QM, Speyer G, et al. Systems Analysis of the Human Pulmonary Arterial Hypertension Lung Transcriptome. Am J Respir Cell Mol Biol. 2019 Jun;60(6):637–649.
- Mura M, Cecchini MJ, Joseph M, et al. Osteopontin lung gene expression is a marker of disease severity in pulmonary arterial hypertension. Respirology. 2019 November;24(11):1104–1110.
- Zhao YD, Yun HZH, Peng J, et al. De novo synthesize of bile acids in pulmonary arterial hypertension lung. Metabolomics. 2014;10(6):1169–1175.
- Renaud L, da Silveira WA, Takamura N, et al. Prominence of IL6, IGF, TLR, and Bioenergetics Pathway Perturbation in Lung Tissues of Scleroderma Patients With Pulmonary Fibrosis. Front Immunol. 2020 March 10;11:383.
- Horvath S, Dong J. Geometric interpretation of gene coexpression network analysis. PLoS Comput Biol. 2008 August 15;4(8):e1000117.
- Cheng S, Li Z, Zhang W, et al. Identification of IL10RA by Weighted Correlation Network Analysis and in vitro Validation of Its Association with Prognosis of Metastatic Melanoma. Front Cell Dev Biol. 2021 January;8(8):630790.
- Zhou Y, Zhou B, Pache L, et al. Metascape provides a biologist-oriented resource for the analysis of systems-level datasets. Nat Commun. 2019 April 3;10(1):1523.
- Szklarczyk D, Gable AL, Lyon D, et al. STRING v11: protein-protein association networks with increased coverage, supporting functional discovery in genome-wide experimental datasets. Nucleic Acids Res. 2019 January 8;47(D1):D607–D613.
- Szklarczyk D, Gable AL, Nastou KC, et al. The STRING database in 2021: customizable protein-protein networks, and functional characterization of user-uploaded gene/measurement sets. Nucleic Acids Res. 2021 January 8;49(D1):D605–D612.
- Shannon P, Markiel A, Ozier O, et al. Cytoscape: a software environment for integrated models of biomolecular interaction networks. Genome Res. 2003 November;13(11):2498–2504.
- Parker HS, Leek JT, Favorov AV, et al. Preserving biological heterogeneity with a permuted surrogate variable analysis for genomics batch correction. Bioinformatics. 2014 October;30(19):2757–2763.
- Ritchie ME, Phipson B, Wu D, et al. limma powers differential expression analyses for RNA-sequencing and microarray studies. Nucleic Acids Res. 2015 April 20;43(7):e47.
- Zhang T, Liu N, Wei W, et al. Integrated Analysis of Weighted Gene Coexpression Network Analysis Identifying Six Genes as Novel Biomarkers for Alzheimer’s Disease. Oxid Med Cell Longev. 2021 July;26(2021):9918498.
- Robin X, Turck N, Hainard A, et al. pROC: an open-source package for R and S+ to analyze and compare ROC curves. BMC Bioinformatics. 2011 March;17(12):77.
- Aran D, Hu Z, Butte AJ. xCell: digitally portraying the tissue cellular heterogeneity landscape. Genome Biol. 2017 November 15;18(1):220.
- Bonnet S, Michelakis ED, Porter CJ, et al. An Abnormal Mitochondrial–Hypoxia Inducible Factor-1α–Kv Channel Pathway Disrupts Oxygen Sensing and Triggers Pulmonary Arterial Hypertension in Fawn Hooded Rats. Circulation. 2006 June 6;113(22):2630–2641.
- Fijalkowska I, Xu W, Comhair SA, et al. Hypoxia inducible-factor1alpha regulates the metabolic shift of pulmonary hypertensive endothelial cells. Am J Pathol. 2010 Mar;176(3):1130–1138.
- Ryan JJ, Archer SL. Emerging concepts in the molecular basis of pulmonary arterial hypertension: part I: metabolic plasticity and mitochondrial dynamics in the pulmonary circulation and right ventricle in pulmonary arterial hypertension. Circulation. 2015 May 12;131(19):1691–1702.
- Kherbeck N, Tamby MC, Bussone G, et al. The role of inflammation and autoimmunity in the pathophysiology of pulmonary arterial hypertension. Clin Rev Allergy Immunol. 2013 February;44(1):31–38.
- Oka M, Homma N, Taraseviciene-Stewart L, et al. Rho kinase-mediated vasoconstriction is important in severe occlusive pulmonary arterial hypertension in rats. Circ Res. 2007 March 30;100(6):923–929.
- Nahar K, Absar S, Gupta N, et al. Peptide-coated liposomal fasudil enhances site specific vasodilation in pulmonary arterial hypertension. Mol Pharm. 2014 December 1;11(12):4374–4384.
- Yerabolu D, Weiss A, Kojonazarov B, et al. Targeting Jak-Stat Signaling in Experimental Pulmonary Hypertension. Am J Respir Cell Mol Biol. 2021 January;64(1):100–114.
- Busse DC, Habgood-Coote D, Clare S, et al. 44 and Interferon-Induced Protein 44-Like Restrict Replication of Respiratory Syncytial Virus. J Virol. 2020 August 31;94(18):e00297–20.
- Shaath H, Vishnubalaji R, Elkord E, et al. Single-Cell Transcriptome Analysis Highlights a Role for Neutrophils and Inflammatory Macrophages in the Pathogenesis of Severe COVID-19. Cells. 2020 October 29;9(11):2374.
- Huang WC, Tung SL, Chen YL, et al. IFI44L is a novel tumor suppressor in human hepatocellular carcinoma affecting cancer stemness, metastasis, and drug resistance via regulating met/Src signaling pathway. BMC Cancer. 2018 May 30;18(1):609.
- Weeding E, AH S. Deoxyribonucleic Acid Methylation in Systemic Lupus Erythematosus: implications for Future Clinical Practice. Front Immunol. 2018 April;24(9):875.
- Teruel M, Sawalha AH. Epigenetic Variability in Systemic Lupus Erythematosus: what We Learned from Genome-Wide DNA Methylation Studies. Curr Rheumatol Rep. 2017 June;19(6):32.
- Li Y, Zhang J, Wang C, et al. IFI44L expression is regulated by IRF-1 and HIV-1. FEBS Open Bio. 2021 January;11(1):105–113.
- Durbin JE, Hackenmiller R, Simon MC, et al. Targeted disruption of the mouse Stat1 gene results in compromised innate immunity to viral disease. Cell. 1996 February 9;84(3):443–450.
- Braga CL, Felix NS, Teixeira DE, et al. Niclosamide attenuates lung vascular remodeling in experimental pulmonary arterial hypertension. Eur J Pharmacol. 2020 November;15(887):173438.
- Durham GA, Palmer TM. Is there a role for prostanoid-mediated inhibition of IL-6 trans-signalling in the management of pulmonary arterial hypertension? Biochem Soc Trans. 2019 August 30;47(4):1143–1156.
- Strassheim D, Riddle SR, Burke DL, et al. Prostacyclin inhibits IFN-gamma-stimulated cytokine expression by reduced recruitment of CBP/p300 to STAT1 in a SOCS-1-independent manner. J Immunol. 2009 December 1;183(11):6981–6988.
- Ivashkiv LB. IFNγ: signalling, epigenetics and roles in immunity, metabolism, disease and cancer immunotherapy. Nat Rev Immunol. 2018 September;18(9):545–558.
- Willis GR, Fernandez-Gonzalez A, Reis M, et al. The Gatekeeper for Mesenchymal Stem Cell Derived-Exosomes in Pulmonary Arterial Hypertension? Int J Mol Sci. 2018 August 27;19(9):2534.
- Tamosiuniene R, Tian W, Dhillon G, et al. Regulatory T cells limit vascular endothelial injury and prevent pulmonary hypertension. Circ Res. 2011 September 30;109(8):867–879.
- Kawano H, Kayama H, Nakama T, et al. Takeda K. IL-10-producing lung interstitial macrophages prevent neutrophilic asthma. Int Immunol. 2016 October;28(10):489–501.