
 ?Mathematical formulae have been encoded as MathML and are displayed in this HTML version using MathJax in order to improve their display. Uncheck the box to turn MathJax off. This feature requires Javascript. Click on a formula to zoom.
ABSTRACT
This study conducted a comprehensive analysis of the clinical significance of N6-methyladenosine (m6A) regulators and their relationship with immune microenvironment characteristics in diffuse large cell lymphoma (DLBCL). Consensus clustering was performed to molecularly discriminate DLBCL subtypesbased on m6A regulators’ expression. Using the Cox and Lasso regression algorithm, survival-associated m6A regulators were identified, and a m6A-based prognostic signature was established. The influence of m6A risk on immune cell infiltration, immune checkpoint genes, cancer immunity cycle, and immunotherapeutic response was evaluated. Potential molecular pathways related to m6A risk were investigated using gene set enrichment analysis. The m6A regulators showed satisfactory performance in distinguishing DLBCL subgroups with distinct clinical traits and outcomes. A six m6A regulator-based prognostic signature was established and validated as an independent predictor, which separated patients into low- and high-risk groups. High-risk m6A indicated worse survival. The B cells naïve, T cells gamma delta, and NK cells resting were the three most affected immune cells by m6A risk. Up-regulated (PDCD1 and KIR3DL1) and down-regulated (TIGIT, IDO1, and BTLA) immune checkpoint genes in the high-risk group were identified. The m6A risk was found to influence several steps in the cancer immunity cycle. Patients with high-risk m6A were more likely to benefit from immunotherapy. Biological function enrichment analysis revealed that high-risk m6A to be tended related to malignant tumor characteristics, while low-risk m6A showed trend to be related to defensive response processes. Collectively, the m6A-based prognostic signature could be a practical prognostic predictor for DLBCL and immune microenvironment characteristics affected by m6A may be part of the mechanism.
Introduction
Latest cancer statistics reported that there were an estimated 81,560 new cases and an estimated 20,720 deaths of non-Hodgkin lymphomas (NHL) in the United State, 2021. NHL ranked 7th and 6th in the morbidity of males and females, respectively, while the mortality ranked 9th for both males and females [Citation1]. Diffuse large cell lymphoma (DLBCL), accounting for 25–30% of all NHL, is a greatly heterogeneous B cell lymphoid neoplasm with substantial variations in genome and genetic alterations, which causes diverse clinical phenotypes and different responses to therapy. Over the past two decades, the combination of rituximab, cyclophosphamide, doxorubicin, vincristine, and prednisone (R-CHOP) has been established as a standard first-line therapy for DLBCL patients based on the results of several phase III clinical trials [Citation2–4]. About 50–70% of DLBCL patients can be clinically cured using the R-CHOP regimen, while the remaining patients end up being either refractory or relapsed. Worse still, only about 10% of the refractory or relapsed DLBCL patients have the fortune to be cured using intensive salvage immunochemotherapy followed by autologous stem cell transplantation, whereas the 90% rest of the patients suffer from dismal outcomes [Citation5,Citation6]. The urgent need for effective therapeutic strategies is unmet and requires unremitting efforts.
With the advent of high-throughput genome sequencing technique, the construction of the genetic landscape of DLBCL has become a reality. It is realizable to decipher which patient is likely or unlikely to benefit from the therapy on genomic level. For example, according to the gene expression profile, DLBCL is mainly divided into two molecularly distinct subtypes: germinal center cell (GCB)-like and activated B cell (ABC)-like DLBCL, which is a milestone for interpreting why DLBCL patients have different responses to the same R-CHOP therapy [Citation7]. Moreover, increasing research has progressively unveiled the pivotal driver genes and pathways in DLBCL, such as TP53, MYC, BCL6, BCL2, MYD88, BCR pathway, NF-κB pathway, PI3K-AKT-mTOR pathway, and JAK-STAT pathway, etc., which help better understand the biological and pathological processes in DLBCL [Citation8]. What’s even more inspiring is growing novel targeted agents such as BTK inhibitor Ibrutinib [Citation9,Citation10], BCL2 inhibitor Venetoclax [Citation11,Citation12], PI3K inhibitor CUDC-907 [Citation13], and AKT inhibitor MK-2206 [Citation14], etc. have shown promising therapeutic potential in relapsed/refractory DLBCL. Therefore, providing a deeper insight into the pathophysiology mechanism in DLBCL is no doubt the essential foundation for the development of novel targeted therapy, which apparently is far from being satisfied yet. As a consequence, research on exploring the DLBCL field from molecular mechanism to clinical application is urgently needed.
Recently, the research on epitranscriptome in cancers has progressed in leaps and bounds owing to the rapid development of high-throughput sequencing such as chromatin immunoprecipitation sequencing, methylated RNA immunoprecipitation sequencing, and assay for transposase-accessible chromatin using sequencing. N6-methyladenosine (m6A) is one of the common and abundant post-transcriptional modifications in mRNAs, which exerts a pivotal regulatory role in tumorigenesis and progression. The process of m6A is mainly achieved by three types of m6A regulators: methyltransferases (‘writers’), demethylases (‘erasers’), and binding proteins (‘readers’). m6A modifications are assembled by ‘writers’, removed by ‘erasers’, and deciphered by ‘readers’. Increasing studies have revealed the important roles of m6A regulators in cancers. For example, methyltransferase METTL3 has been reported as an oncogene involving in the cell proliferation, differentiation, invasion, migration, and apoptosis of various tumors including acute myeloid leukemia, breast cancer, liver cancer, gastric cancer, bladder cancer, prostate cancer, lung cancer, and pancreatic cancer [Citation15]. Demethylase ALKBH5 has been uncovered to exert effects on tumor proliferation, invasion, and metastasis in lung cancer, gastric cancer, pancreatic cancer, colon cancer, glioblastoma, osteosarcoma, and ovarian cancer as an oncogene or tumor suppressor [Citation16]. The ‘readers’ YTH domain-containing proteins, including YTHDF1-3 and YTHDC1-2, have also been proved to be closely in connection with poor prognosis of colorectal cancer, hepatocellular carcinoma, breast cancer, and ovarian cancer [Citation17]. The combination of m6A regulators for constructing prognostic model has recently been a novel signature for predicting the outcome of tumor patients. For instance, high-risk m6A has been clarified as an unfavorable indicator in clear cell renal cell carcinoma [Citation18], pancreatic cancer [Citation19], non-small cell lung cancer [Citation20], head and neck squamous cell carcinoma [Citation21] gastric cancer [Citation22], hepatocellular carcinoma [Citation23], and colorectal carcinoma [Citation24], which indicated worse survival of patients. However, in DLBCL, no study has reported the combined prognostic value of m6A regulators. On the other hand, due to the great heterogeneity of DLBCL, how to accurately discriminate the risk-stratification of a patient is pivotal to decision-making of therapeutic strategies. The current scoring system mainly includes the international prognostic index (IPI), revised-IPI (R-IPI), and National Comprehensive Cancer Network IPI (NCCN-IPI). However, none of the risk score systems could discriminate a patient subgroup with long-term survival clearly <50%. Scholars suggested that we should integrate molecular traits of DLBCL to better characterize high-risk group for which novel therapies are most needed [Citation25]. As a result, it is imperative to investigate the prognostic value of combined m6A regulators in DLBCL, which is promising for the development of novel targeted therapy and clinical management of DLBCL patients.
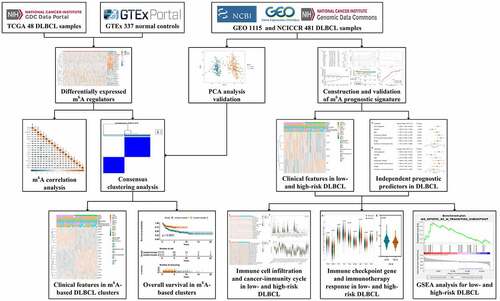
In the current study, we will be the first to comprehensively investigate the prognostic value of m6A regulators and construct an m6A-based prognostic signature for DLBCL. More importantly, we will provide new perspectives on the relationship between m6A risk and tumor immune microenvironment characteristics in DLBCL (). We hope the work achieved here will throw light on the interactions between epitranscriptome and immune microenvironment, as well as their clinical potential in DLBCL.
Figure 1. The flowchart of the whole study design
Methods
Collection of m6A regulators and DLBCL data
Based on currently published literatures [Citation26–29], a total of 22 common m6A regulators, which included 8 ‘Writers’ (METTL3, METTL14, METTL5, WTAP, ZC3H13, RBM15, RBM15B, KIAA1429), 2 ‘Erasers’ (ALKBH5, FTO), and 12 ‘Readers’ (YTHDC1, YTHDC2, YTHDF1, YTHDF2, YTHDF3, IGF2BP1, IGF2BP2, IGF2BP3, HNRNPA2B1, HNRNPC, EIF3A, FMR1) were collected. The 22 m6A regulators were used for the subsequent analysis.
The Cancer Genome Atlas (TCGA), Genotype-Tissue Expression (GTEx), and Gene Expression Omnibus (GEO) databases were used for obtaining the transcriptome expression and clinical information of DLBCL samples and normal controls. The RNA-seq data of 48 DLBCL samples from the TCGA and 337 normal controls from the GTEx were downloaded, removed batch effect, merged, and normalized with log2(FPKM+1). Four mRNA microarrays (GSE10846, GSE31312, GSE87371, and GSE23501) were included in the current study. The expression of mRNAs was normalized with log2 transformation for subsequent analysis. The clinical parameters such as age, gender, stage, extranodal site, ECOG performance status, molecular subtype, LDH ratio, overall survival and survival status were extracted. Patients with an overall survival under 90 days were removed for a better quality of the analysis. Dataset GSE10846 was used as a training set, while the combined data of GSE31312, GSE87371, and GSE23501 was used as an external validation set. A SVA package in R version 4.02 was used for removing batch effects when combining the datasets [Citation30]. Another independent RNA-seq dataset containing 481 samples was downloaded from the National Cancer Institute (NCI) Center for Cancer Research (CCR) of the TCGA program for the use of predicting the potential immunotherapeutic response. The details of the included datasets can be found in .
Table 1. The information of the included datasets in the study
Differential expression and correlation analysis for m6A regulators
To identify differentially expressed m6A regulators in DLBCL, the Wilcoxon signed-rank test was adopted and achieved in R version 4.02. Extremely low-expressed regulators (average expression<0.5) were removed for better data quality. An absolute value of log2FC over 1 and a p-value below 0.05 were utilized for screening statistically differentially expressed m6A regulators in DLBCL. A violin plot and a heatmap plot achieved with the vioplot and pheatmap packages in R version 4.02 were used to visualize the differentially expressed m6A regulators.
In order to understand the correlations among the m6A regulators in DLBCL, a Spearman correlation analysis was conducted for the differentially expressed m6A regulators using the dataset GSE10846. A corrplot R package was utilized for correlation analysis and visualization. A p-value under 0.05 was regarded as statistically significant.
Exploration of m6A-based DLBCL clusters and their clinical significance
We wondered whether the differentially expressed m6A regulators contribute to distinguishing different molecular subtypes of DLBCL. Hence, an unsupervised class discovery approach named Consensus Clustering was applied via a ConsensusClusterPlus R package [Citation31]. The uncovered DLBCL clusters via m6A regulators were validated using Principal Component Analysis (PCA) [Citation32]. The correlation between the m6A-based clusters and the clinical parameters of DLBCL patients were investigated. The Chi-squared test was applied when estimating the relationship between different m6A-based clusters and clinical characteristics, such as age, gender, stage, extranodal site, ECOG performance status, LDH ratio, and molecular subtype. Meanwhile, the Kaplan–Meier survival analysis was utilized to compare the survival of DLBCL patients in different clusters. A statistical p value <0.05 was used to evaluate the difference.
Construction and validation of m6A prognostic signature in DLBCL
The 380 DLBCL samples in GSE10846 were randomly divided into two groups (training set and testing set) equally. In the training set, 190 DLBCL patients were included for the univariate Cox regression analysis to select prognosis-related m6A regulators. A p value<0.05 was used as a cutoff to screen statistically significant prognostic m6A regulators for further analysis. The Least Absolute Shrinkage and Selection Operator (Lasso) regression algorithm, a popular method for regression analysis with high‐dimensional features [Citation33], was further adopted for variable determination and regularization so as to raise the prediction accuracy and interpretability of the prognostic model. The m6A risk stratification was based on the m6A risk score, which was computed as follows: risk score = . In the formula, the Xi represented the expression of each m6A regulator in the model, while Coefi represented the coefficient of each m6A regulator in the Lasso regression analysis. In the testing set, the whole combined samples set of GSE10846, and the external validation set (GSE31312, GSE87371, and GSE23501), the same formula was utilized to calculate the risk score and construct validation models. The DLBCL patients were classified as low-risk and high-risk groups according to a median value of the m6A risk score. A survminer package and a survivalROC package in R were used to depict the K-M survival curve and Receiver Operating Characteristic curve (ROC) curve, respectively. Since most of the DLBCL adverse events occur in the first 2 years after diagnosis [Citation34], the area under the curve (AUC) of the time-dependent ROC, which was calculated for evaluating the predictive capacity of the m6A signature, was assessed at the time point of 1-, 2-, and 5-year. Moreover, the statistical difference of DLBCL clinical traits (age, gender, stage, extranodal site, ECOG performance status, LDH ratio, and molecular subtype) in low- and high-risk DLBCL was evaluated using Chi-squared test.
To determine whether m6A prognostic signature is an independent prognostic factor in DLBCL, univariate and multivariate Cox regression analyses were performed for m6A signature along with age, gender, stage, extranodal site, ECOG performance status, LDH ratio, and molecular subtype in GSE10846. Hazard ratio (HR), 95% confidence interval (CI), and p-value were calculated.
Estimation of tumor immune microenvironment characteristics and immunotherapeutic response using m6A signature
We wondered whether m6A risk stratification is correlated with tumor immune microenvironment characteristics. As a result, we adopted CIBERSORT, a powerful analytical tool to estimate the abundances of immune cells using gene expression data [Citation35], to identify 22 different kinds of immune cells in the DLBCL samples from GSE10846. Then, we compared the difference of immune cell infiltration between low-risk and high-risk groups using Wilcoxon signed-rank test. Moreover, we investigated the influence of m6A risk on the activity of cancer-immunity cycle using the Tracking Tumor Immunophenotype (TIP) web tool [Citation36]. Besides, the expression of nine previously reported immune checkpoint genes (CTLA4, LAG3, TIGIT, HAVCR2, PDCD1, IDO1, VISTA, KIR3DL1, BTLA) [Citation37] in low- and high-risk groups were also investigated. More importantly, we predicted the likelihood of the response to cancer immunotherapy in low- and high-risk groups from an external RNA-seq data using tumor immune dysfunction and exclusion (TIDE) algorithm (http://tide.dfci.harvard.edu/) [Citation38]. A p-value under 0.05 was deemed to be statistically significant.
Gene set enrichment analysis (GSEA)
GSEA is a knowledge-based computational approach for interpreting a prior defined set of genome-wide expression profiles, which helps determine statistically significant concordant differences of biological function between two phenotypes [Citation39]. As a result, for the purpose of illuminating the underlying molecular pathways related to m6A risk, GSEA was performed to select the most significant gene ontology terms (GO) in low- and high-risk groups. GSEA version 4.10 software and Molecular Signatures Database v7.2 were applied for the current analysis.
Results
Differentially expressed m6A regulators in DLBCL
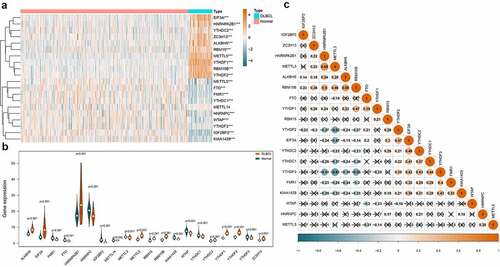
Regulator IGF2BP1 (average expression = 0.101) and IGF2BP3 (average expression = 0.441) were removed due to extremely low expression. Finally, the expression of the 20 m6A regulators in 48 DLBCL samples and 337 normal controls were compared. As shown in ), the heatmap displayed the expression distribution of the 20 m6A regulators. And the violin plot in ) visualized the expression difference of each m6A regulator. In summary, 19 out of 20 regulators were differentially expressed, among which, 10 were up-regulated (EIF3A, HNRNPA2B1, YTHDC2, ZC3H13, ALKBH5, RBM15, METTL5, YTHDF1, RBM15B, YTHDF2) and 9 were down-regulated (METTL3, FTO, FMR1, YTHDC1, HNRNPC, WTAP, YTHDF3, IGF2BP2, KIAA1429) in DLBCL. In ), the Spearman correlation analysis was achieved for the 19 differentially expressed m6A regulators. We can observe that the correlations among the m6A regulators were complicated. For example, the ‘Writers’ can be positively correlated such as METTL3 and RMB15B (coef = 0.46), or negatively correlated such as METTL3 and KIAA1429 (coef = −0.32). An ‘Erases’ (ALKBH5) can be positively associated with a ‘Writers’ (RBM15B) (coef = 0.58). And the ‘Readers’ can also be positively related like YTHDF3 and YTHDC1 (coef = 0.44), or negatively related such as YTHDF3 and HNRNPA2B1 (coef = −0.51). Similarly, a ‘Writer’ can be positively related to a ‘Reader’ such as METTL3 and HNRNPA2B1 (coef = 0.68), or negatively related to another ‘Reader’ such as METTL3 and YTHDF3 (coef = −0.61).
Figure 2. Expression and correlations of m6A regulators in DLBCL. A. Expression heatmap of m6A regulators in DLBCL and normal controls. Darker blue indicates lower expression, while darker orange indicates higher expression. B. Violin plots of m6A regulators in DLBCL and normal controls. C. Correlations among the differentially expressed m6A regulators in DLBCL. Darker blue indicates stronger negative correlations, while darker orange indicates stronger positive correlations. The coefficient with a cross glyph on it indicates no statistical significance
m6A-based DLBCL clusters and clinical implication
As we can observe in ) and Figure S1, when clustering the samples using a specified cluster count (k) from 2 to 9, only k = 2 showed the best performance to distinguish the subtypes of DLBCL by the differentially expressed m6A regulators. In ), the heatmap showed that the samples in cluster 1 were highly correlated, so were those in cluster 2. There was barely any correlation significant between cluster 1 and cluster 2, which indicated that m6A regulators were capable to differentiate the DLBCL samples into molecularly distinguishable subtypes. The finding was validated using the PCA analysis, which was displayed in ). The samples in cluster 1 and cluster 2 were both highly clustered, which further proved that m6A-based DLBCL clusters are reliable. The clinical significance of the two m6A-based DLBCL clusters was also investigated and demonstrated in ). ) displayed the expression heatmap of the differentially expressed m6A regulators in m6A-based clusters and their correlation with clinical parameters in DLBCL. The gender, age, ECOG performance status, number of extranodal site, and survival status showed statistical differences in cluster 1 and cluster 2 (p < 0.05). In ), the survival of DLBCL patients in cluster 1 and cluster 2 also showed statistical difference. The overall survival rate of DLBCL patients in cluster 2 outperformed those in cluster 1 (p < 0.001).
Figure 3. Molecular clusters of DLBCL based on m6A regulators and their clinical significance. A. Consensus cumulative distribution function (CDF) plot displays what optimal number of clusters should be determined for yielding the best confidence of consensus and cluster. B. Delta area plot displays the relative change in area under the CDF curve, which helps determine k at which there is no appreciable increase. C. Tracking plot shows the cluster assignment of items (horizontal ordinate) for each k (vertical coordinate) by colors. D. The graph of consensus matrix color legend. E. Heatmap and dendrogram of the consensus matrix for k = 2. The cluster memberships are marked by colored rectangles. F. Principal component analysis (PCA) analysis reveals the reliability of clusters divided by m6A regulators. G. The combination of m6A expression heatmap and clinical features in m6A-based clusters. The clinical parameters gender, age, ECOG performance status, number of extranodal sites, and survival status shows a statistically significant difference in m6A-sorted clusters. H. K-M survival curve displays the patients in cluster 2 have better survival than patients in cluster 1
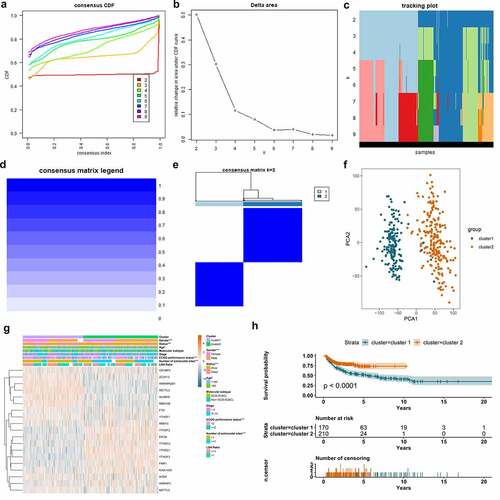
Figure 4. Construction of m6A prognostic signature using the Lasso algorithm in the training set. A. Forest plot displays the prognostic value of differentially expressed m6A regulators using univariate Cox regression. B. Cross-validation curve for tuning variant selection in the LASSO regularized model. A thousand times across-validations were adopted for determining the best Lambda value. C. Lasso coefficient shrinkage of the six included m6A regulators along with larger numbers of log Lambda. Each colored line describes a single predictor and its coefficient score. D. The survival information of the patients in the training set. The upper part displays the survival time and status of each patient, while the lower part displays the m6A risk score curve of the patients. E. K-M survival analysis depicts the overall survival of the patients in the training set. The patients in low-risk group have better survivals than those in high-risk group (p < 0.001). F. ROC curve displays the predictive efficacy of the m6A signature in the training set. The predictive AUC of 1-, 2-, and 5-year is 0.674, 0.699, 0.691, respectively
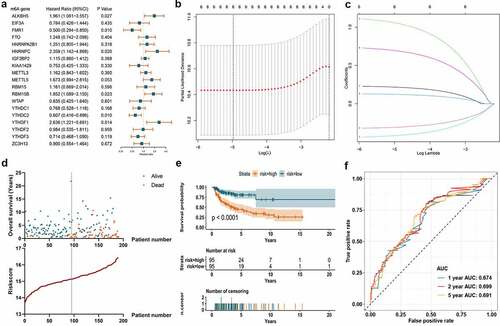
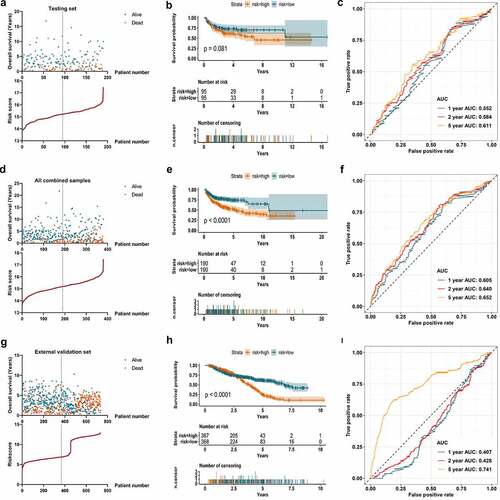
Figure 5. Validation of the m6A signature in the testing set, entire combined samples, and external datasets. A. The survival information of the patients in the testing set. The upper part displays the survival time and status of each patient, while the lower part displays the m6A risk score curve of the patients. B. K-M survival analysis depicts the overall survival of the patients in the testing set. The patients in low-risk group show a trend to have better survivals than those in high-risk group (p = 0.081). C. ROC curve displays the predictive efficacy of the m6A signature in the testing set. The predictive AUC of 1-, 2-, and 5-year is 0.552, 0.584, 0.661, respectively. D. The survival information of all the patients in the combination of training and testing sets. The upper part displays the survival time and status of each patient, while the lower part displays the m6A risk score curve of the patients. E. K-M survival analysis depicts the overall survival of all the patients in the combination of training and testing sets. The patients in low-risk group have better survivals than those in high-risk group (p < 0.001). F. ROC curve displays the predictive efficacy of the m6A signature in the combination of training and testing sets. The predictive AUC of 1-, 2-, and 5-year is 0.605, 0.640, 0.652, respectively. G. The survival information of the patients in the external validation set. The upper part shows the survival time and status of each patient, while the lower part shows the m6A risk score curve of the patients. H. K-M survival analysis displays the overall survival of the patients in the external validation set. The patients in low-risk group have better survivals than those in high-risk group in the follow ups after three years (p < 0.001). I. ROC curve displays the predictive efficacy of the m6A signature in the external validation set. The predictive AUC of 5-year is 0.741
m6A signature and clinical implication
Univariate Cox regression algorithm was carried out for the 19 differentially expressed m6A regulators. Six out of the 19 m6A regulators (ALKBH5, FMR1, HNRNPC, RBM15B, YTHDC2, and YTHDF1) showed statistically prognostic value in DLBCL patients ()). Through further Lasso regression, all the six prognostic m6A regulators were determined for the construction of prognostic signature ()). The detailed calculation of risk score was: risk score = 0.21642 × Expression of ALKBH5-0.30866 × Expression of FMR1 + 1.05555 × Expression of HNRNPC+0.12185 × Expression of RBM15B-0.41769 × Expression of YTHDC2 + 0.69323 × Expression of YTHDF1. The calculated risk score curve and survival information of the patients in the training set were displayed in ). The K-M survival curve suggested the patients with low-risk m6A had higher overall survival rate than those in high-risk group in the training set ()). ROC curve revealed the AUC at 1-, 2-, and 5-year was 0.674, 0.699, and 0.691, which suggested certain predictive capacity of the m6A signature in the training set ()).
The m6A prognostic signature in the training set was validated using a testing set and a combined data of the training set and testing set as a whole. In ), the risk score curve and survival information of patients in the testing set were visualized. Although there was no statistical significance when conducting a K-M survival analysis for the samples in the testing set (p = 0.081), it still showed an obvious trend that patients with low-risk m6A had better survival ()). The AUC of the 1-, 2-, and 5-year achieved 0.552, 0.584, and 0.611 in the testing samples ()). ) displayed the calculated risk score and survival information of the combined training set and testing set. A statistically significant difference was observed in the K-M survival curve analysis for the combined samples (p < 0.001). Patients with low-risk m6A showed better survival than those in high-risk group ()). ) displayed the predictive efficacy of the m6A signature, which yielded an AUC for 1-, 2-, and 5-year of 0.605, 0.640, and 0.652, respectively. In the external validation set (735 samples), the survival information and m6A risk score of the patients were shown in ). The survival rate did not show distinct difference in low- and high-risk groups before the first three years. However, three years later, the patients with low-risk m6A began to show better survival than those with high-risk m6A, which indicated the long-term effect of m6A risk (). The predictive AUC of 5-year was 0.741 (). Regarding the clinical parameters, age, ECOG performance status, number of extranodal sites, and survival status showed statistical significance in low- and high-risk groups ().
Figure 6. The relationship between m6A prognostic signature and clinical parameters of DLBCL. A. The combination of m6A expression heatmap and clinical parameters in low- and high-risk groups. The clinical parameters age, ECOG performance status, number of extranodal sites, and survival status shows statistical significance in low- and high-risk groups. B. Forest plot displays the prognostic value of m6A signature and other clinical parameters of DLBCL using univariate Cox regression. m6A signature (p < 0.001), age (p = 0.001), molecular subtype (p < 0.001), ECOG performance status (p < 0.001), stage (p < 0.001), and LDH ratio (p < 0.001) show statistically significant difference in low- and high-risk groups. C. Forest plot displays the independent predictors in DLBCL using multivariate Cox regression. m6A signature (p < 0.001), age (p = 0.004), molecular subtype (p = 0.003), ECOG performance status (p = 0.036), and LDH ratio (p = 0.003) are validated as independent prognostic predictors in DLBCL
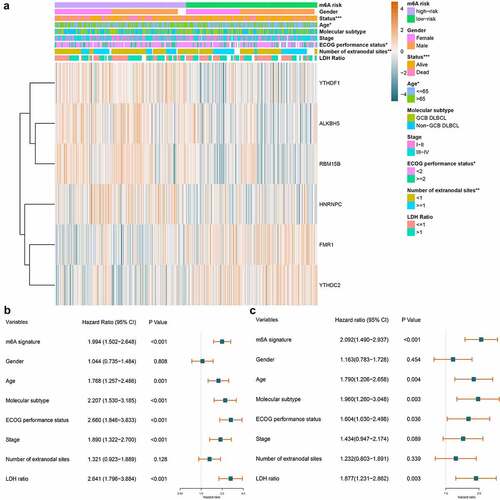
Whether m6A signature is an independent factor in DLBCL was investigated. Displaying in , the univariate Cox regression revealed that m6A signature (HR = 1.994, p < 0.001), age (HR = 1.768, p = 0.001), molecular subtype (HR = 2.207, p < 0.001), ECOG performance status (HR = 2.660, p < 0.001), stage (HR = 1.890, p < 0.001), and LDH ratio (HR = 2.641, p < 0.001) were all statistically significant prognostic predictors. And multivariate Cox regression analysis displayed in further verified that m6A signature (HR = 2.092, p < 0.001), age (HR = 1.790, p = 0.004), molecular subtype (HR = 1.960, p = 0.003), ECOG performance status (HR = 1.604, p = 0.036), and LDH ratio (HR = 1.877, p = 0.003) were all independent prognostic predictors in DLBCL.
Estimation of m6A risk and tumor immune microenvironment characteristics
The immune cell infiltration in low- and high-risk groups was explored. The bar plot in Figure S2 visualized the proportion of the 22 immune cells in each DLBCL sample on the whole. And also displayed the 22 immune cells’ distribution in low- and high-risk groups as a heatmap. The immune cell infiltration difference in low-risk vs. high-risk groups was compared by statistics. As shown in , ten out of 22 immune cells showed statistical differences between the low- and high-risk groups. The B cell naïve, NK cells resting, NK cells activated, and Mast cells activated were significantly up-regulated in high-risk group. The Plasma cells, T cells CD4 memory activated, T cells gamma delta, Dendritic cells resting, Mast cells resting, and Eosinophils were significantly down-regulated in high-risk group. Integrating some immunological studies [Citation40–42], the immunological mechanism and final effect against tumor of the top three altered lymphocytes were shown in . We can notice that alternations of immune cell infiltration caused by m6A risk did not always associate with anti-tumor effect. The correlations among the 10 differentially distributed immune cells were depicted in Figure S3. We can notice that T cells CD4 memory activated was positively correlated with T cells gamma delta (coef = 0.41), while negatively correlated with B cell naïve (coef = −0.35). The T cells gamma delta was negatively related to B cell naïve (coef = −0.44) and NK cells resting (coef = −0.49).
Table 2. Immune effects of the top three altered lymphocytes
Figure 7. The effect of m6A risk on immune cell infiltration and immunity cycle activity. A. Heatmap visualizes immune cell infiltration degree in each DLBCL samples. Statistically significant immune cell infiltration in low-risk vs. high-risk DLBCL was marked with an asterisk (p < 0.001***, p < 0.005**, p < 0.05*). B. Violin plot displays the difference of each type of immune cell in low-risk vs. high-risk DLBCL. C. Heatmap visualizes the activity of each step in cancer immunity cycle in each DLBCL samples. Statistically significant steps in cancer immunity cycle in low-risk vs. high-risk DLBCL was marked with an asterisk (p < 0.001***, p < 0.005**, p < 0.05*). D. Violin plot displays the difference of each step in cancer immunity cycle in low-risk vs. high-risk DLBCL
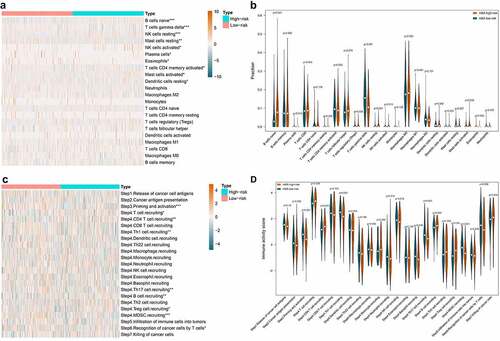
The effect of m6A risk on the activity of cancer-immunity cycle was also investigated. As shown in , the heatmap displayed the distribution of the activity of seven stepwise events of anti-cancer immune response in low- and high-risk groups. The immune activity scores of Step 3 (Priming and activation), Step 4 (Th1 cell recruiting, Th17 cell recruiting, MDSC recruiting), and Step 6 (Recognition of cancer cells by T cells) were all significantly lower in high-risk group compared with low-risk group. The immune activity scores of Step 4 (T cell recruiting, CD4 T cell recruiting, B cell recruiting, Treg cell recruiting) were significantly higher in high-risk group compared with low-risk group ().
Immune checkpoint is a critical mechanism of tumor immune escape, which makes it a prospective target for cancer immunotherapy. Therefore, the expression of nine well-studied immune checkpoint genes in the low- and high-risk group was analyzed and displayed in . We found that PDCD1 (P = 0.045) and KIR3DL1 (P = 0.012) were significantly increased in high-risk group, while TIGIT (p < 0.001), IDO1 (p = 0.016), and BTLA (p = 0.008) were significantly decreased instead. Regards LAG3, CTLA4, VISTA, and HAVCR2, no statistical significance was observed.
Figure 8. Comparison of immune checkpoint genes and potential immunotherapeutic response in low- and high-risk DLBCL. A. Violin plot displays the expression difference of immune checkpoint genes in low-risk vs. high-risk DLBCL. B. Violin plot displays the difference of TIDE score in low-risk vs. high-risk DLBCL. The TIDE score in high-risk group is significantly decreased, which indicates lower potential of tumor evasion, thus more likely to benefit from immunotherapy
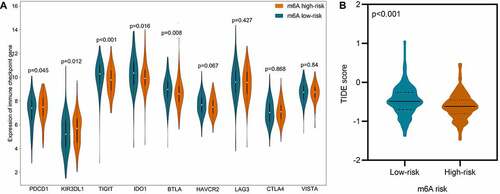
The response to immunotherapy in low- and high-risk groups were predicted using an external independent cohort of 481 samples. As displayed in , the TIDE score in low-risk group surpassed that in high-risk group, which indicates higher potential of tumor evasion, thus less likely to benefit from immunotherapy.
Enriched pathways in low- and high-risk DLBCL
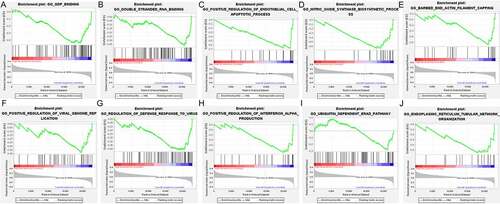
To reveal the difference of potential biological function between the low-risk and high-risk groups, GSEA analysis was carried out. The top 10 significantly enriched terms in the low-risk group and high-risk group were selected for displaying, respectively. As we can see in , the top 10 significantly enriched terms in high-risk group included Telomerase holoenzyme complex, Mitotic G2-M transition checkpoint, Blastocyst formation, Regulation of transcription by RNA polymerase III, Saga type complex, Base excision repair, ATPase complex, DNA replication checkpoint, Histone H4 acetylation, INO80 type complex. And GDP binding, Double stranded RNA binding, Positive regulation of endothelial cell apoptotic process, Nitric oxide synthase biosynthetic process, Barbed end actin filament capping, Positive regulation of viral genome replication, Regulation of defense response to virus, Positive regulation of interferon Alpha production, Ubiquitin dependent ERAD pathway, and Endoplasmic reticulum tubular network organization were the top 10 significantly enriched items in low-risk group ().
Figure 9. The enriched GO terms in high-risk DLBCL. The top part in each plot displays the enrichment score (ES) of each gene. The middle part of each plot displays the leading edge subset, in which a vertical line represents a single gene. The bottom part shows the distribution of ranking metric scores, in which the red section is positively correlated with high-risk patients, while the blue section is negatively correlated with low-risk patients. A. Enrichment plot of Telomerase holoenzyme complex. B. Enrichment plot of Mitotic G2-M transition checkpoint. C. Enrichment plot of Blastocyst formation. D. Enrichment plot of Regulation of transcription by RNA polymerase III. E. Enrichment plot of Saga type complex. F. Enrichment plot of Base excision repair. G. Enrichment plot of ATPase complex. H. Enrichment plot of DNA replication checkpoint. I. Enrichment plot of Histone H4 acetylation. J. Enrichment plot of INO80 type complex
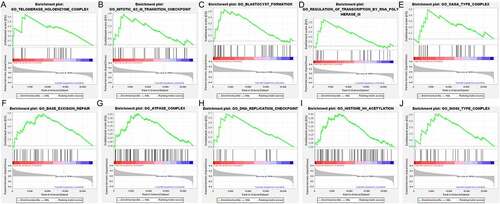
Figure 10. The enriched GO terms in low-risk DLBCL. The top portion in each plot demonstrates the enrichment score (ES) of each gene. The middle portion of each plot displays the leading edge subset, in which a vertical line represents a single gene. The bottom portion shows the ranking metric scores distribution, in which the red section is positively correlated with high-risk patients, while the blue section is negatively correlated with low-risk patients. A. Enrichment plot of GDP binding. B. Enrichment plot of Double stranded RNA binding. C. Enrichment plot of Positive regulation of endothelial cell apoptotic process. D. Enrichment plot of Nitric oxide synthase biosynthetic process. E. Enrichment plot of Barbed end actin filament capping. F. Enrichment plot of Positive regulation of viral genome replication. G. Enrichment plot of Regulation of defense response to virus. H. Enrichment plot of Positive regulation of interferon Alpha production. I. Enrichment plot of Ubiquitin dependent ERAD pathway. J. Enrichment plot of Endoplasmic reticulum tubular network organization
Discussion
Emerging evidence substantiated that m6A modification exerts indispensable regulatory effects in neuronal disorders, osteoporosis, metabolic disease, viral infection, and various cancers [Citation43,Citation44]. Targeting m6A regulators for cancer therapy has been a closely focused field by scholars. For instance, Huang et al. recently developed two promising FTO inhibitors named FB23 and FB23-2 using structure-based rational design. Encouragingly, FB23-2 was found to dramatically inhibit proliferation and enhance the differentiation/apoptosis of acute myeloid leukemia (AML) cell line in vitro. More importantly, in vivo experiment, FB23-2 could significantly suppress the progression of AML primary cells in xeno-transplanted mice [Citation45]. In recent years, the prominent role of m6A modification in cancer immunotherapy has been gaining more and more attention. Han et al. recently discovered that m6A-binding protein YTHDF1 could control anti-tumor immunity by recognizing m6A-marked transcripts encoding lysosomal proteases to increase their translation in dendritic cells. Specifically, the deficiency of YTHDF1 elevated the cross-presentation of tumor antigens and antigen-specific CD8 + T cell antitumor response. More remarkably, loss of YTHDF1 enhanced the therapeutic efficacy of PD-L1 checkpoint blockade in vivo [Citation46]. Despite the rapid development of m6A research in cancer, few research works have reported the pathological role of m6A regulators and their clinical significance in DLBCL. Cheng et al. once reported that down-regulated methyltransferase METTL3 functionally inhibited the DLBCL cell proliferation through reducing the m6A methylation and total mRNA level of pigment epithelium-derived factor [Citation47]. Another study revealed that up-regulated piRNA-30473 was associated with aggressive phenotype and poor prognosis of DLBCL patients by virtue of m6A dependent regulatory manners. Mechanistically, piRNA-30473 exerted its oncogenic effect via increasing the expression of methylase WTAP and its critical target gene HK2, thus enhanced the global m6A level [Citation48]. Nevertheless, the above studies only focused on a single m6A regulator, lacking a comprehensive understanding of the potential clinical value of different m6A regulators as a whole. Given that, our current study primarily focused on evaluating the prognostic value of 22 known m6A regulators, constructing a prognosis predictive model, and investigating the influence on immune microenvironment characteristics of m6A risk in DLBCL.
The majority of m6A regulators showed differential expression in DLBCL and their interactions were complicated. The same m6A regulator could be positively correlated with a regulator while negatively correlated with another regulator. This indicated the m6A regulatory network in DLBCL was sophisticated, which deserves further analysis. More interestingly, we found that the DLBCL patients could be divided into two clusters based on differentially expressed m6A regulators. More importantly, the gender, age, extranodal site, ECOG performance status, and overall survival of the patients in the two clusters showed statistically significant differences. The patients in cluster 1 had worse survival. Our results were consistent with Shen’s findings, which discovered that m6A-based subtypes were significantly associated with overall survival in pan-cancer including DLBCL [Citation49]. As we all known, DLBCL can be mainly divided into two subtypes namely ABC-DLBCL and GCB-DLBCL according to gene expression profile. ABC-DLBCL is associated with more malignant biological properties and worse clinical outcomes than GCB-DLBCL. Population-based studies showed evidence that the 5-year overall survival rate of ABC-DLBCL patients is 35%, while it is 60% for GBC-DLBCL patients [Citation50]. This suggested more positive therapy and follow-up measures should be taken when managing ABC-DLBCL patients. Similarly, different m6A-based DLBCL clusters also had distinct overall survival, which is worthy of clinical attention. Since the patients in cluster 1 and ABC-DLBCL subtype both suffered from worse survival, their relationship is worth further investigation. Why ABC-DLBCL is more refractory was deemed to be associated with constitutive activation of the NF-κB and BCR signaling pathways [Citation51]. Whether m6A regulators are implicated in the NF-κB and BCR signaling pathways, resulting in corresponding clinical phenotype features also bears thinking about.
Another highlight achieved in the current study was we constructed an m6A-based prognostic model for predicting the overall survival of DLBCL patients. Patients with high-risk m6A were verified to have poorer outcomes. m6A risk scoring model was validated as an independent prognostic predictor, which is as significant as age, molecular subtype, ECOG performance status, and LDH ratio. Scholars have previously constructed prognostic signatures for DLBCL using other predictors. For example, Zhou et al. constructed a prognostic immunoscore model using immune cell infiltration, yielding an AUC of 0.562 in DLBCL [Citation52]. And Hu et al. constructed an integrated prognostic model of a pharmacogenomic gene signature for DLBCL with a predictive AUC of 0.67 [Citation53]. Moreover, Zhang et al. utilized a combined five types of alternative splicing events to construct prognostic predictors for DLBCL patients, which showed an AUC of 0.564 [Citation54]. In the current study, the 5-year predictive AUC of m6A signature in the 380 DLBCL patients were 0.652, while it achieved 0.741 in the external validation set of 735 cohorts. Compared with previously published prognostic models, the m6A signature showed satisfactory predictive performance, which is qualified for potential clinical application.
The concept of tumor microenvironment (TME) has been come up with for years, and its development has never been kept from moving with the times. It is now clear that TME consists of tumor cells, immune cells, stromal cells, endothelial cells, and cancer-associated fibroblasts [Citation55]. Although infiltrated by immune cells, the cancer cells can somehow escape from immune supervision and destruction through multiple tricky mechanisms. The tumor immune privilege mechanisms mainly include reduced expression of cancer antigens and major histocompatibility complex class I, elevated expression of immune checkpoints, as well as increased recruitment of immunosuppressive cells, such as T regulatory cells, tumor-associated macrophages, and myeloid-derived suppressor cells, etc. [Citation56]. Immune blockades have been developing vigorously over the years, among which, PD-1 is the living proof. PD-1 inhibitor, mainly putting brakes on unrestricted cytotoxic T effector function, was first approved by U.S. Food and Drug Administration for the treatment of unresectable/metastatic melanoma cancer and non-small-cell lung cancer second-line alternative supported by National Comprehensive Cancer Network guideline [Citation57]. However, in relapsed/refractory DLBCL, PD-1 blockade therapy has been disappointing, achieving an objective response of merely 36% [Citation58]. As a result, making immune blockades a success in treating DLBCL is still challenging, while taking a deeper insight into the immune microenvironment characteristics is an essential step.
Plenty of studies have unveiled a close connection between m6A and immune microenvironment characteristics. For instance, Shen et al. found that m6A modifications contributed to immune regulation in HCC, which were promising to act as novel prognostic predictors and immune therapeutic targets [Citation59]. In gastric cancer, scholars discovered that m6A modulation patterns were crucial for TME diversity and complexity. Patients with lower m6A score yielded therapeutic advantages and clinical benefits [Citation60]. Xu et al. discovered that m6A-related lncRNA is promising biomarkers for predicting immunotherapeutic responses in LUAD [Citation61]. Our current study also provided novel findings on the relationship between m6A and immune cell infiltration in DLBCL. We discovered a bunch of up-regulated (B cell naïve, NK cells resting, NK cells activated, and Mast cells activated) and down-regulated (Plasma cells, T cells CD4 memory activated, T cells gamma delta, Dendritic cells resting, Mast cells resting, and Eosinophils) immune cells in high-risk patients. And immune checkpoint-related genes could be up-regulated (PDCD1 and KIR3DL1) or down-regulated (TIGIT, IDO1, and BTLA) in high-risk group, which implied complicated mechanism. Cao et al. have comprehensively reviewed the sophisticated relationship among cancer epigenetics, tumor immunity, and immunotherapy, which suggested tremendous potential of epigenetic therapies [Citation62]. Our current study also investigated the relationship among m6A risk, the activity of cancer immunity cycle, and the response to immunotherapy. Our results showed that m6A risk did significantly influence the activity of priming and activation of effector T cells, recognition of cancer cells by T cells and the trafficking of some immune cells. High risk of m6A signature were discovered to be more likely to response to immunotherapy. This indicated the potential clinical implication of m6A signature in prediction of immunotherapeutic response.
Whether the underlying biological function and molecular pathways are different between low-risk and high-risk DLBCL is a noteworthy aspect. Therefore, we explored the possible molecular mechanism in low- and high-risk DLBCL. We discovered that the enriched biological function in high-risk group mainly included cell cycle, DNA replication, transcription, post-transcriptional modification, and DNA repair relative pathways, which were manifestations of malignant tumor features. And in low-risk group, the enriched biological functions included several interesting items such as Positive regulation of endothelial cell apoptotic process, Nitric oxide synthase biosynthetic process, Regulation of defense response to virus, and Positive regulation of interferon Alpha production, which were mostly associated with defensive processes. In detail, we know that anti-angiogenesis is an important perspective for cancer therapy, in which inducing the apoptosis of vascular endothelial cells is a pivotal process [Citation63–65]. And Nitric oxide has been found to be involved in the immune response. Its important synthase NOS2 could regulate macrophages, T cells, B cells, and myeloid-derived suppressor cells [Citation66]. Interferon Alpha has been approved for the treatment of more than 14 types of cancers, including hairy cell leukemia, melanoma, and renal cell carcinoma, as an immune-based oncologic drug for years [Citation67,Citation68]. Collectively, these might help explain why patients in high-risk m6A group suffered from worse survival than those in low-risk group on molecular mechanism level. Still, experimental experiments are worthy and necessary to be carried out for further validation.
Despite the highlights of m6A-based prognostic signature and their correlation with tumor immune microenvironment characteristics, several limitations should be acknowledged in this study. First, even though we investigated the mRNA expression of the m6A regulators, their protein expression should also be verified by immunohistochemistry. Second, although we investigated the influence of m6A risk on some immune microenvironment characteristics, such as immune cell infiltration, immune checkpoint-related genes, cancer immunity cycle, and immunotherapeutic response, other important immune characteristics like tumor mutation burden, microsatellite instability, neoantigen, etc. should also be comprehensively analyzed in the future. Besides, the current study design and results were based on bioinformatics analysis. Future experimental studies are required to validate the results and elaborate the exact molecular regulatory mechanism between m6A regulators and tumor immune microenvironment characteristics.
Conclusions
This study comprehensively investigated the clinical significance of multiple m6A regulators and established a novel m6A risk scoring signature for predicting the survival of DLBCL patients for the first time, which achieved satisfactory predictive performance. More importantly, we unveiled several highlights of immune cell infiltration, immune checkpoint genes, cancer immunity cycle, immunotherapeutic response, and underlying molecular pathways in low- and high-risk DLBCL pioneeringly, which shed light on the potential regulatory relationship between m6A and immune microenvironment characteristics. Nevertheless, the obtained results especially the exact mechanism on how m6A affects immune microenvironment characteristics still need further experimental research. Anyhow, the findings in this study provided whole new perspectives for the m6A epitranscriptome and immunomics in DLBCL, which are promising for the development of individualized and comprehensive management of DLBCL patients.
Highlights
m6A regulators can class the DLBCL into two subgroups with distinct clinical traits and outcomes.
m6A-based prognostic signature is an independent prognostic predictor in DLBCL.
m6A-based prognostic signature is related to immune cell infiltration, cancer-immunity cycle, and immune checkpoint genes’ expression.
m6A-based prognostic signature is potential to predict the response of immunotherapy.
Authors’ contributions
ZGP designed and revised the manuscript. QYX and ZDH contributed to download and preprocess the data, while MWL and HYH analyzed the data. ZCX re-checked all the data and wrote the entire manuscript. All authors have approved the final version and publication.
Supplemental Material
Download ()Disclosure statement
No potential conflict of interest was reported by the author(s).
Availability of data and materials
The clinical information, RNA-seq, and microarray expression data were obtained from the GEO (https://www.ncbi.nlm.nih.gov/geo/), GTEx (https://gtexportal.org/home/), and TCGA (https://portal.gdc.cancer.gov/) databases, which are all publicly available.
Supplementary material
Supplemental data for this article can be accessed here.
Additional information
Funding
Related Research Data
References
- Siegel RL, Miller KD, Fuchs HE, et al. Cancer statistics, 2021. CA Cancer J Clin. 2021;71(1):7–33.
- Feugier P, Van Hoof A, Sebban C, et al. Long-term results of the R-CHOP study in the treatment of elderly patients with diffuse large B-cell lymphoma: a study by the Groupe d’Etude des Lymphomes de l’Adulte. J Clin Oncol. 2005;23(18):4117–4126.
- Pfreundschuh M, Schubert J, Ziepert M, et al. Six versus eight cycles of bi-weekly CHOP-14 with or without rituximab in elderly patients with aggressive CD20+ B-cell lymphomas: a randomised controlled trial (RICOVER-60). Lancet Oncol. 2008;9(2):105–116.
- Pfreundschuh M, Trümper L, Osterborg A, et al. CHOP-like chemotherapy plus rituximab versus CHOP-like chemotherapy alone in young patients with good-prognosis diffuse large-B-cell lymphoma: a randomised controlled trial by the MabThera International Trial (MInT) group. Lancet Oncol. 2006;7(5):379–391.
- Gisselbrecht C, Glass B, Mounier N, et al. Salvage regimens with autologous transplantation for relapsed large B-cell lymphoma in the rituximab era. J Clin Oncol. 2010;28(27):4184–4190.
- Friedberg JW. Relapsed/refractory diffuse large B-cell lymphoma. Hematology Am Soc Hematol Educ Program. 2011;2011(1):498–505.
- Alizadeh AA, Eisen MB, Davis RE, et al. Distinct types of diffuse large B-cell lymphoma identified by gene expression profiling. Nature. 2000;403(6769):503–511.
- Miao Y, Medeiros LJ, Li Y, et al. Genetic alterations and their clinical implications in DLBCL. Nat Rev Clin Oncol. 2019;16(10):634–652.
- Brower V. Ibrutinib promising in subtype of DLBCL. Lancet Oncol. 2015;16(9):e428.
- Wilson WH, Young RM, Schmitz R, et al. Targeting B cell receptor signaling with ibrutinib in diffuse large B cell lymphoma. Nat Med. 2015;21(8):922–926.
- de Vos S, Swinnen LJ, Wang D, et al. Venetoclax, bendamustine, and rituximab in patients with relapsed or refractory NHL: a phase Ib dose-finding study. Ann Oncol. 2018;29(9):1932–1938.
- Davids MS, Roberts AW, Seymour JF, et al. Phase I first-in-human study of venetoclax in patients with relapsed or refractory non-Hodgkin lymphoma. J Clin Oncol. 2017;35(8):826–833.
- Younes A, Berdeja JG, Patel MR, et al. Safety, tolerability, and preliminary activity of CUDC-907, a first-in-class, oral, dual inhibitor of HDAC and PI3K, in patients with relapsed or refractory lymphoma or multiple myeloma: an open-label, dose-escalation, phase 1 trial. Lancet Oncol. 2016;17(5):622–631.
- Petrich AM, Leshchenko V, Kuo P-Y, et al. Akt inhibitors MK-2206 and nelfinavir overcome mTOR inhibitor resistance in diffuse large B-cell lymphoma. Clin Cancer Res. 2012;18(9):2534–2544.
- Zeng C, Huang W, Li Y, et al. Roles of METTL3 in cancer: mechanisms and therapeutic targeting. J Hematol Oncol. 2020;13(1):117.
- Wang J, Wang J, Gu Q, et al. The biological function of m6A demethylase ALKBH5 and its role in human disease. Cancer Cell Int. 2020;20(1):347.
- Liu S, Li G, Li Q, et al. The roles and mechanisms of YTH domain-containing proteins in cancer development and progression. Am J Cancer Res. 2020;10(4):1068–1084.
- Zhou J, Wang J, Hong B, et al. Gene signatures and prognostic values of m6A regulators in clear cell renal cell carcinoma - a retrospective study using TCGA database. Aging (Albany NY). 2019;11(6):1633–1647.
- Geng Y, Guan R, Hong W, et al. Identification of m6A-related genes and m6A RNA methylation regulators in pancreatic cancer and their association with survival. Ann Transl Med. 2020;8(6):387.
- Shi H, Zhao J, Han L, et al. Retrospective study of gene signatures and prognostic value of m6A regulatory factor in non-small cell lung cancer using TCGA database and the verification of FTO. Aging (Albany NY). 2020;12(17):17022–17037.
- Zhao X, Cui L. Development and validation of a mA RNA methylation regulators-based signature for predicting the prognosis of head and neck squamous cell carcinoma. Am J Cancer Res. 2019;9(10):2156–2169.
- Su Y, Huang J, Hu J. m6A RNA methylation regulators contribute to malignant progression and have clinical prognostic impact in gastric cancer. Front Oncol. 2019;9:1038.
- Liu J, Sun G, Pan S, et al. The Cancer Genome Atlas (TCGA) based m6A methylation-related genes predict prognosis in hepatocellular carcinoma. Bioengineered. 2020;11(1):759–768.
- Ji L, Chen S, Gu L, et al. Exploration of potential roles of m6A regulators in colorectal cancer prognosis. Front Oncol. 2020;10:768.
- Ruppert AS, Dixon JG, Salles G, et al. International prognostic indices in diffuse large B-cell lymphoma: a comparison of IPI, R-IPI, and NCCN-IPI. Blood. 2020;135(23):2041–2048.
- Han SH, Choe J. Diverse molecular functions of m6A mRNA modification in cancer. Exp Mol Med. 2020;52(5):738–749.
- Zhao Y, Shi Y, Shen H, et al. m6A-binding proteins: the emerging crucial performers in epigenetics. J Hematol Oncol. 2020;13(1):35.
- Huang H, Weng H, Chen J. m6A Modification in coding and non-coding RNAs: roles and therapeutic implications in cancer. Cancer Cell. 2020;37(3):270–288.
- Li Y, Xiao J, Bai J, et al. Molecular characterization and clinical relevance of m6A regulators across 33 cancer types. Mol Cancer. 2019;18(1):137.
- Leek JT, Johnson WE, Parker HS, et al. The sva package for removing batch effects and other unwanted variation in high-throughput experiments. Bioinformatics. 2012;28(6):882–883.
- Wilkerson MD, Hayes DN. ConsensusClusterPlus: a class discovery tool with confidence assessments and item tracking. Bioinformatics. 2010;26(12):1572–1573.
- Abid A, Zhang MJ, Bagaria VK, et al. Exploring patterns enriched in a dataset with contrastive principal component analysis. Nat Commun. 2018;9(1):2134.
- Sauerbrei W, Royston P, Binder H. Selection of important variables and determination of functional form for continuous predictors in multivariable model building. Stat Med. 2007;26(30):5512–5528.
- Maurer MJ, Habermann TM, Shi Q, et al. Progression-free survival at 24 months (PFS24) and subsequent outcome for patients with diffuse large B-cell lymphoma (DLBCL) enrolled on randomized clinical trials. Ann Oncol. 2018;29(8):1822–1827.
- Chen B, Khodadoust MS, Liu CL, et al. Profiling tumor infiltrating immune cells with CIBERSORT. Methods Mol Biol. 2018;1711:243–259.
- Xu L, Deng C, Pang B, et al. TIP: a web server for resolving tumor immunophenotype profiling. Cancer Res. 2018;78(23):6575–6580.
- Toor SM, Sasidharan Nair V, Decock J, et al. Immune checkpoints in the tumor microenvironment. Semin Cancer Biol. 2020;65:1–12.
- Jiang P, Gu S, Pan D, et al. Signatures of T cell dysfunction and exclusion predict cancer immunotherapy response. Nat Med. 2018;24(10):1550–1558.
- Subramanian A, Tamayo P, Mootha VK, et al. Gene set enrichment analysis: a knowledge-based approach for interpreting genome-wide expression profiles. Proc Natl Acad Sci U S A. 2005;102(43):15545–15550.
- Stoycheva D, Simsek H, Weber W, et al. External cues to drive B cell function towards immunotherapy. Acta Biomater. 2021.
- Chabab G, Barjon C, Bonnefoy N, et al. Pro-tumor γδ T cells in human cancer: polarization, mechanisms of action, and implications for therapy. Front Immunol. 2020;11:2186.
- Myers JA, Miller JS. Exploring the NK cell platform for cancer immunotherapy. Nat Rev Clin Oncol. 2021;18(2):85–100.
- Yang C, Hu Y, Zhou B, et al. The role of m6A modification in physiology and disease. Cell Death Dis. 2020;11(11):960.
- Chen Y, Lin Y, Shu Y, et al. Interaction between N-methyladenosine (mA) modification and noncoding RNAs in cancer. Mol Cancer. 2020;19(1):94.
- Huang Y, Su R, Sheng Y, et al. Small-molecule targeting of oncogenic FTO demethylase in acute myeloid leukemia. Cancer Cell. 2019;35(4):677–691.
- Han D, Liu J, Chen C, et al. Anti-tumour immunity controlled through mRNA m6A methylation and YTHDF1 in dendritic cells. Nature. 2019;566(7743):270–274.
- Cheng Y, Fu Y, Wang Y, et al. The m6A methyltransferase METTL3 is functionally implicated in DLBCL development by regulating m6A modification in PEDF. Front Genet. 2020;11:955.
- Han H, Fan G, Song S, et al. piRNA-30473 contributes to tumorigenesis and poor prognosis by regulating m6A RNA methylation in DLBCL. Blood. 2021;137(12):1603–1614.
- Shen S, Zhang R, Jiang Y, et al. Comprehensive analyses of m6A regulators and interactive coding and non-coding RNAs across 32 cancer types. Mol Cancer. 2021;20(1):67.
- Nowakowski GS, Feldman T, Rimsza LM, et al. Integrating precision medicine through evaluation of cell of origin in treatment planning for diffuse large B-cell lymphoma. Blood Cancer J. 2019;9(6):48.
- Pasqualucci L, Dalla-Favera R. The genetic landscape of diffuse large B-cell lymphoma. Semin Hematol. 2015;52(2):67–76.
- Zhou H, Zheng C, Huang D-S. A prognostic gene model of immune cell infiltration in diffuse large B-cell lymphoma. PeerJ. 2020;8:e9658.
- Hu J, Xu J, Yu M, et al. An integrated prognosis model of pharmacogenomic gene signature and clinical information for diffuse large B-cell lymphoma patients following CHOP-like chemotherapy. J Transl Med. 2020;18(1):144.
- Zhang R, Lin P, Yang X, et al. Survival associated alternative splicing events in diffuse large B-cell lymphoma. Am J Transl Res. 2018;10(8):2636–2647.
- Hanahan D, Weinberg RA. Hallmarks of cancer: the next generation. Cell. 2011;144(5):646–674.
- Saleh R, Elkord E. Treg-mediated acquired resistance to immune checkpoint inhibitors. Cancer Lett. 2019;457:168–179.
- Vaddepally RK, Kharel P, Pandey R, et al. Review of indications of FDA-approved immune checkpoint inhibitors per NCCN guidelines with the level of evidence. Cancers (Basel). 2020;12(3):738.
- Lesokhin AM, Ansell SM, Armand P, et al. Nivolumab in patients with relapsed or refractory hematologic malignancy: preliminary results of a phase Ib study. J Clin Oncol. 2016;34(23):2698–2704.
- Shen S, Yan J, Zhang Y, et al. N6-methyladenosine (m6A)-mediated messenger RNA signatures and the tumor immune microenvironment can predict the prognosis of hepatocellular carcinoma. Ann Transl Med. 2021;9(1):59.
- Zhang B, Wu Q, Li B, et al. m6A regulator-mediated methylation modification patterns and tumor microenvironment infiltration characterization in gastric cancer. Mol Cancer. 2020;19(1):53.
- Xu F, Huang X, Li Y, et al. m6A-related lncRNAs are potential biomarkers for predicting prognoses and immune responses in patients with LUAD. Mol Ther Nucleic Acids. 2021;24:780–791.
- Cao J, Yan Q. Cancer epigenetics, tumor immunity, and immunotherapy. Trends Cancer. 2020;6(7):580–592.
- Qin S, Li A, Yi M, et al. Recent advances on anti-angiogenesis receptor tyrosine kinase inhibitors in cancer therapy. J Hematol Oncol. 2019;12(1):27.
- Shojaei F. Anti-angiogenesis therapy in cancer: current challenges and future perspectives. Cancer Lett. 2012;320(2):130–137.
- Wang J, Zhu C. Anticoagulation in combination with antiangiogenesis and chemotherapy for cancer patients: evidence and hypothesis. Onco Targets Ther. 2016;9:4737–4746.
- Gantner BN, LaFond KM, Bonini MG. Nitric oxide in cellular adaptation and disease. Redox Biol. 2020;34:101550.
- Belardelli F, Ferrantini M, Proietti E, et al. Interferon-alpha in tumor immunity and immunotherapy. Cytokine Growth Factor Rev. 2002;13(2):119–134.
- Vidal P. Interferon α in cancer immunoediting: from elimination to escape. Scand J Immunol. 2020;91(5):e12863.