
ABSTRACT
Heterotopic ossification (HO) is frequently seen in patients with spinal injuries. Therefore, this study aimed to characterize the association of HO with ankylosing spondylitis (AS) through gene expression profiling. The human transcriptomic datasets (GSE73754 and GSE94683) were obtained from the Gene Expression Omnibus database for analysis. Overlapping differentially expressed genes (DEGs) were identified between AS and HO disease states. Subsequently, weighted gene co-expression network analysis (WGCNA) was performed for constructing and identifying hub genes for each condition. Finally, a consensus of the overlapping DEGs and the hub genes in AS and HO was taken for determining the key genes involved in AS-induced HO. Quantitative real-time polymerase chain reaction and western blotting were used to detect the mRNA and protein expression levels in mesenchymal stem cells of AS patients and controls. Additionally, immunohistochemistry was performed on interspinous ligament samples for experimental validation of genes. DEG analysis identified 355 overlapping genes between HO and AS. WGCNA indicated that the salmon module of the 22 modules constructed, was most significantly correlated with AS-induced HO. Subsequently, Gene Ontology and Kyoto Encyclopedia of Genes and Genomes analysis of the salmon module indicated the presence of genes enriched in proteasome regulatory particle and proteasome pathways. mRNA expression analysis identified TCP1 and PSMC1 as the key genes in AS-induced HO. Further validation of these genes could help elucidate their role in the complex association of AS and HO.
Introduction
Ankylosing spondylitis (AS) is an autoimmune disease affecting spine and joint health [Citation1,Citation2]. The end-stage of AS is characterized by progressive heterotopic ossification (HO), leading to a rigid thoracolumbar kyphotic deformity and joint stiffness or ‘gelling’[Citation3]. Such deformities in patients can adversely affect their quality of life. Factors, such as mechanical strain [Citation4], inflammation, and genetic predisposition, are known to contribute to AS-related HO [Citation5,Citation6]. However, the pathogenic players at the cellular and molecular level remain unclear [Citation6–8]. The existing knowledge does not provide an effective method for preventing ossification of ligaments in AS patients. Therefore, it is of the utmost importance to identify the potential genes and underlying mechanisms of AS-induced HO to facilitate the understanding of abnormal bone formation at the later stages of the disease. This study attempts to elucidate the genetic basis of HO development in AS patients.
This study utilizes a bioinformatics approach to identify the potential genes involved in AS-induced HO. Datasets from the Gene Expression Omnibus (GEO) database were analyzed to identify key genes implicated in bone formation that can act as potential drivers of AS-related HO. Additionally, gene co-expression networks were constructed to filter important modules and screen hub genes using weighted gene co-expression network analysis (WGCNA). Finally, preliminary experimental validation of the identified genes was performed using immunohistochemistry (IHC), western blotting, and quantitative real-time polymerase-chain reaction (qRT-PCR); thereby, providing new insights into the molecular pathogenesis of AS-induced HO.
Methods and materials
Data collection
The dataset for the analysis was obtained from the GEO database of NCBI by performing a database search using the keywords ‘ankylosing spondylitis’ and ‘heterotopic ossification’. The microarray dataset GSE73754 was selected for AS analysis that provided the gene expression profiles of mononuclear cells from 20 healthy donors and 52 AS patients [Citation9]. The microarray dataset GSE94683 was selected for HO analysis that provided gene expression profiles of mesenchymal stromal cells (MSCs) from seven HO patients and nine healthy controls [Citation10] (Gene Expression Omnibus, http://www.ncbi.nlm.gov/geo).
Screening of differentially expressed genes
Differentially expressed genes (DEGs) in disease state (AS and HO) with respect to healthy controls were determined using the limma R package [Citation11]. The false discovery rate statistic was used to adjust P-values. Genes with adjusted P-value < 0.05 and |log2 fold change (FC)| > 0.2 were classified as DEGs. The top 50 significant DEGs were used to construct heatmaps using Morpheus (https://software.broadinstitute.org/morpheus).
Weighted gene co-expression network analysis
WGCNA was conducted on the AS microarray dataset GSE73754 using ‘WGCNA’ package in R [Citation12]. The soft-threshold power and cut height used for network construction were 2 and 0.25, respectively. The minimum module size used for module detection was 30. Gene significance (GS) and module membership (MM) were calculated for deriving correlations between clinical traits and modules. Module having the highest correlation with AS was identified as the key module.
Protein–protein interaction network construction and functional enrichment analysis
Genes composing the key module were mapped in the STRING database (STRING, V11.0; https://www.string-db.org/) for predicting their functional associations and interactions at the protein level (protein–protein interactions or PPI). Interactions with reliability scores > 0.4 were considered as statistically significant. Gene Ontology (GO) categories and Kyoto Encyclopedia of Genes and Genomes (KEGG) pathway analysis were performed using the ‘clusterProfiler’ package in R for further elucidation of the molecular functions of genes composing the key module [Citation13]. GO processes and KEGG pathways having a P-value < 0.05 were considered statistically significant.
Identification of key genes in AS-induced HO
Genes having a |MM| > 0.8 and |GS| > 0.4 were identified as hub genes. Taking the consensus of the AS hub genes, AS DEGs, and HO DEGs, the overlapping DEGs were identified as the key genes involved in heterotopic ossification progression in AS patients.
Ligament specimens and bone marrow samples
This study was approved by the Institutional Review Board of the Affiliated Drum Tower Hospital of Nanjing University Medical School (IRB approval no. 2,011,052). Fifteen patients (2 females and 13 males, aged 28–61 years) diagnosed with AS according to the modified New York criteria [Citation14] and 11 patients (6 females and 5 males, aged 30–59 years) with thoracolumbar fractures were enrolled for the study. All participants provided written informed consent. Patients with AS had not received prior treatment with systemic drugs. Interspinous ligament samples were obtained from six AS patients and four patients with thoracolumbar fractures. Bone marrow samples were collected from the iliac crest of participants.
Cell culture
Bone marrow samples were treated with red blood cell lysis solution (Miltenyi Biotec, Bergisch Gladbach, Germany) for isolating MSCs [Citation15]. The MSCs were transplanted at a density of 105 cells/mL in low glucose Dulbecco modified Eagle medium (Gibco, Waltham, MA, USA) supplemented with 10% fetal bovine serum (Gibco) and 1% penicillin–streptomycin (Gibco). Subsequently, the cells were incubated in a 5% humidified CO2 chamber at 37°C, recovered using 0.25% trypsin-ethylenediaminetetraacetic acid (0.25% trypsin-EDTA; Gibco), and reseeded on attaining 80% confluency. Cells from passage 3–5 were used in this study.
RNA extraction and real-time PCR
RNA was extracted from cultured cells using TRIzol Reagent (Invitrogen, Carlsbad, California, USA) and reverse transcribed using a cDNA synthesis kit (Takara, Kusatsu, Shiga, Japan) following the manufacturer’s protocols [Citation2]. The cDNAs were stored at −80 °C. qRT-PCR was performed for detecting mRNA levels of t-complex 1 (TCP1), proteasome 26S subunit, ATPase 1 (PSMC1), and cell division cycle 42 small effector 2 (CDC42SE2) using a LightCycle 480 II real-time PCR machine (Roche, Indianapolis, Indiana, USA) and glyceraldehyde-3-phosphate dehydrogenase (GAPDH) as an internal control. Cycling conditions were as follows: 95 °C for 5 min, followed by 45 cycles of 95 °C for 10 s, 60 °C for 10 s, and 72°C for 10 s. Gene-specific primers were designed based on their GenBank sequences. The primers used were as follows: Homo sapiens TCP1, 5′-GTGGTCATTACAGACCCTGAAAA-3′ and 5′-AACTCTTCTAACTGCCATAGCAC-3′; Homo sapiens PSMC1, 5′-CACACTCAGTGCCGGTTAAAA-3′ and 5′-GTAGACACGATGGCATGATTGT-3′; Homo sapiens CDC42SE2, 5′-TTCTGGTTGTGTTTCAACTGCT-3′ and 5′-GGCTCTCCAATCATACTTCTGTC-3′; Homo sapiens GAPDH, 5′-GAGTCAACGGATTTGGTCGT-3′ and 5′-TTGATTTTGGAGGGATCTCG-3′.
Western blot analysis
Proteins were extracted from cultured cells using radioimmunoprecipitation assay buffer [Citation7] and quantified using Quick Start Bradford Dye Reagent (BioRad, Richmond, CA, USA). Equal amounts of protein were separated by sodium dodecyl sulfate-polyacrylamide gel electrophoresis and transferred to nitrocellulose membranes (Millipore, Billerica, MA, USA). The antibodies against TCP1 (1:1000; ab109126; Abcam, Cambridge, MA, USA) and GAPDH (1:10,000; ab8245; Abcam, Cambridge, MA, USA) were used for western blot analysis following the manufacturer’s protocol. Signal detection was performed using an enhanced chemiluminescence substrate.
IHC
IHC was performed on 5-μm-thick paraffin-embedded sections of interspinous ligament samples as previously described [Citation3]. Paraffin sections were deparaffinized and hydrated. After quenching with 3% H2O2/H2O, the sections were heated to 37 °C for 1 h in 0.25% trypsin-EDTA (Gibco) for antigen retrieval. The sections were blocked using 5% bovine serum albumin (BSA) and incubated with primary antibodies against human TCP1 (ab109126; 1:200 Abcam, 1% BSA) overnight at 4°C in a humidified chamber, followed by incubation for 1 h at room temperature. Subsequently, the slides were incubated with secondary antibodies at room temperature for 3 h and chromogenic substrates were used to detect immunoactivity. The slides were then counterstained using a hematoxylin stain.
Statistical analysis
Statistical analysis was performed using GraphPad Prism 8 (San Diego, California). Data are presented as their mean ± SD. Statistical significance was calculated using the nonparametric Mann–Whitney test. Differences were considered significant at P-value < 0.05.
Results
For better elucidation of HO progression in AS patients, microarray datasets from the GEO database were analyzed for the screening and identification of critical genes and pathways associated with abnormal bone formation related to AS. In the current study, it was hypothesized that the low expression of TCP1 and PSMC1 is related to AS-induced HO. This hypothesis was validated through Western Blot analysis, qRT-PCR, and IHC experiments.
Identification of DEGs
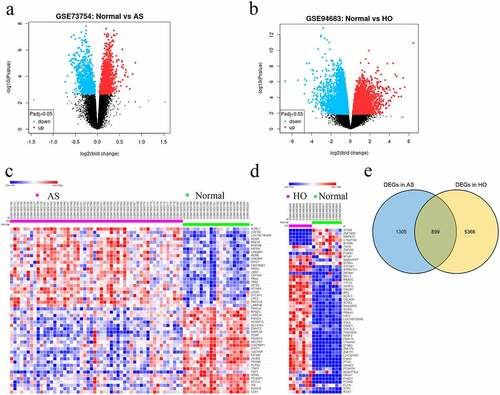
A total of 850 (252 upregulated and 598 downregulated) and 6265 DEGs (1757 upregulated and 4508 downregulated) in AS and HO, respectively, were identified. This differential gene expression was captured using heat maps and the volcano plots (). DEG analysis identified 355 overlapping genes between the two disease states ().
Figure 1. A Volcano plots showing DEGs in GSE73754 and b GSE94683 microarray datasets. c Heatmaps and hierarchical clustering analysis of the top 50 DEGs in GSE73754 and d GSE94683. e Genes with adjusted P-value < 0.05 and |log2 fold change (FC)| > 0.2 are identified as DEGs. Red indicates up-regulation and blue indicates down-regulation. Venn diagram depicting 355 overlapping DEGs identified between GSE73754 and GSE94683 datasets
WGCNA and identification of the key module
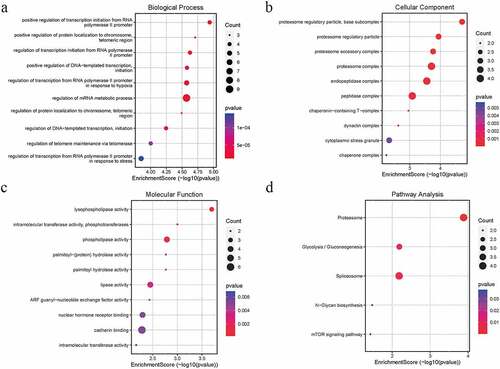
WGCNA was performed on the AS expression dataset GSE73754 (). The correlation coefficient threshold and the soft-thresholding power used was 0.85 and 2, respectively (, b). A total of 21 co-expression modules were constructed (, d). The heat map of the module-trait correlations indicated that the salmon and the red module were most significantly correlated with AS (cor = −0.60, P = 3 × 10⁻⁸; ). Taking into account the GS and MM scores of the two modules, the salmon module (cor = −0.36, P = 1.6 × 10⁻⁵; ) was identified to be the key module correlated with AS. GO and KEGG analyses of the 138 genes composing the salmon module indicated that they were enriched in molecular and cellular functions, such as phospholipase activity, and assembly pathway of the proteasome regulatory particle-based subcomplex (). Additionally, the PPI network of the genes composing the salmon module was constructed and has been indicated in .
Figure 2. A Hierarchical clustering of 52 AS and 20 healthy samples. b Analysis of network topology for various soft-thresholding powers. Left: The x-axis reflects the soft-thresholding power; the y-axis reflects the scale independent topology model fit index. Right: The x-axis reflects the soft-thresholding power; the y-axis reflects the mean connectivity (degree). c Clustering dendrogram of genes with dissimilarity based on topological overlap, together with assigned their module colors. d Eigengene dendrogram and eigengene adjacency plot. e Module trait association. Each row corresponds to a module; each cell contains the corresponding correlation and P-value. The table is color-coded by correlation. f Scatter diagrams depicting gene correlation of the module. Left: salmon module; Right: red module. Comparison between the red and the salmon module indicated salmon to be the key module correlated with AS (cor = −0.36)
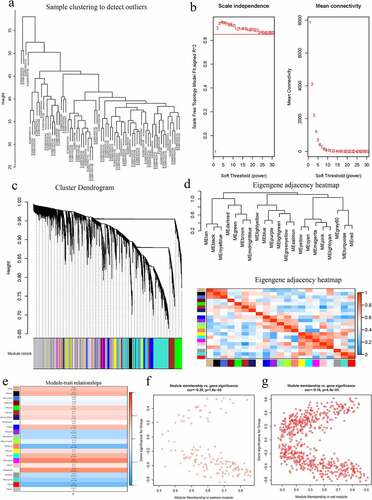
Figure 3. GO and KEGG pathway analysis of the salmon module. Node size reflects gene count, and the node color reflects P-value [-log10 (P-value)]. a Biological processes. b Cellular components. c Molecular functions of the DEGs. d KEGG pathway analysis
![Figure 3. GO and KEGG pathway analysis of the salmon module. Node size reflects gene count, and the node color reflects P-value [-log10 (P-value)]. a Biological processes. b Cellular components. c Molecular functions of the DEGs. d KEGG pathway analysis](/cms/asset/892dbb2c-bc2e-4b08-9762-89597921240b/kbie_a_1975981_f0003_oc.jpg)
Figure 4. A PPI network construction of the DEGs in the salmon module. The red arrows indicate the positions of the three hub genes. b Venn diagram depicting the three DEGs identified simultaneously in the GSE73754, and GSE94683 datasets and hub genes of AS
Identification of key genes in HO progression in AS patients
Nine downregulated hub genes in the key module were identified and have been indicated in . The duplication analysis of the AS hub genes, AS DEGs, and HO DEGs identified three key genes TCP1, CDC42SE2 and PSMC1 that were experimentally validated ().
Table 1. Hub genes were screened in a salmon module. Hub genes were defined as having a module membership over 0.8 and a gene significance over 0.4
Validation of the hub genes
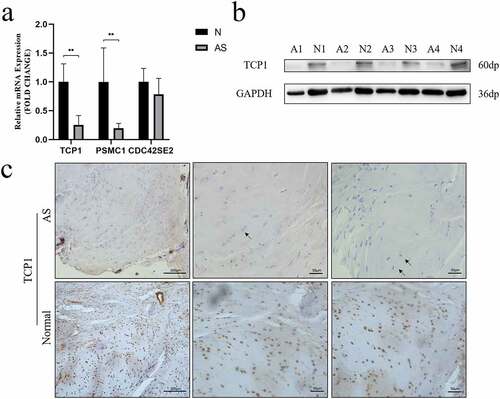
The expression of TCP1, PSMC1 and CDC42SE2 were investigated in AS and healthy controls via qRT-PCR. qRT-PCR analysis revealed that the mRNA levels of TCP1 (P = 0.0022) and PSMC1 (P = 0.0087) were significantly decreased () in the AS group. Western blot analysis further validated that the expression of TCP1 in AS patients was lower than in healthy controls (). Moreover, the expression of TCP1 was validated in paraffin sections of interspinous ligament samples by IHC. These results indicated that the expression of TCP1 in AS patients compared to healthy controls was significantly decreased ().
Figure 5. A TCP1 and PSMC1 mRNA expression were significantly decreased in AS patients. **P < 0.001. b TCP1 protein expression was analyzed using western blot. TCP1 protein levels in AS decreased compared to those in control. c Sections of interspinous ligament from AS patients and healthy controls were immunostained for TCP1 and counterstained with hematoxylin. The black arrows indicate fibrochondrocytes. Immunohistochemistry showed that TCP1 was expressed in the nucleus of fibrochondrocytes under normal conditions, but absent in AS patients
Discussion
Thoracolumbar kyphotic deformity and joint ankylosis caused by HO are recognized as debilitating sequelae of AS [Citation3]. Patients with this deformity have a poor quality of life and must undergo surgery [Citation16]. To date, the molecular mechanisms underlying the pathophysiology of AS-related HO remain unclear [Citation6]. Moreover, the drugs used to treat AS have limited effects on inhibiting HO [Citation6,Citation17,Citation18]. Therefore, this necessitates exploring the susceptibility modules and genes associated with HO progression in AS patients.
To better understand the molecular mechanisms and explore new targets for HO treatment in AS patients, gene expression profile datasets available in the GEO database were analyzed for identifying potential DEGs associated with HO progression in AS patients. WGCNA is a powerful tool of systems biology used to describe pairwise relationships among gene transcripts that provides a more complete analysis [Citation12]. Instead of performing only a DEG analysis, false-positive results were taken into account in this study. To our best of knowledge, this is the first study to conduct WGCNA and construct co-expression networks for identifying susceptibility modules and genes associated with HO progression in AS.
Proteasome associated with HO in AS
The present study analyzed publicly available datasets to construct co-expression modules using WGCNA followed by functional enrichment analysis. The systematic reanalysis of the GSE73754 dataset identified the salmon module to be most significantly correlated with the pathogenesis of AS. GO and KEGG analyses demonstrated that the proteasome pathway was activated during AS progression.
After comparing protein expression in monocytes of AS and rheumatoid arthritis patients, Wright et al. reported that the ubiquitin proteasome pathway was specific for AS monocytes [Citation19]. Previous studies have supported the use of proteasome inhibitors as a novel approach for treating autoimmune diseases including osteoarthritis and systemic lupus erythematosus [Citation20–22]. Moreover, Ma et al. provided support for the application of proteasome inhibitors in AS to decrease abnormal angiogenesis [Citation23]. It is well recognized that highly abundant blood vessels are observed during HO progression [Citation3]. Overall, proteasome pathway is indicated to be an essential target for the development of HO during AS.
Potential genes related to Wnt signaling
Previous studies have indicated that both direct membranous and endochondral bone formation are involved in the development of HO associated with AS [Citation5,Citation7]. Although Li et al. confirmed the key role of Wnt signaling in new bone formation in AS [Citation8], the effects of Wnt signaling on bone formation remain unclear. The Wnt family comprises 19 glycoproteins with varying functions in physiological and pathological development [Citation5]. The activation of the canonical Wnt signaling pathway is directly associated with membranous bone formation [Citation24]. However, the role of Wnt is more complex in endochondral bone formation. Some Wnt ligands promote chondrogenesis in endochondral bone formation, whereas others play opposite roles [Citation25]. Intriguingly, TCP1, PSMC1 and CDC42 were associated with the Wnt signaling pathway.
TCP1 is a subunit of the cytosolic chaperone T-complex protein-1 ring complex that participates in protein folding and regulates the expression of multiple signaling proteins and cytoskeletal components in cells [Citation26]. In a previous study on hepatocellular carcinoma, the downregulation of TCP1 significantly reduced the expression of Wnt7b and β-catenin [Citation26]. Moreover, the expression of CCT-3 has been shown to be a molecular chaperone protein of TCP1 and is associated with the Wnt signaling pathway [Citation27]. In addition, a previous study illustrated that the upregulation of CCT-3 activated the Wnt/β-catenin signaling pathway, leading to the induction of breast cancer cell proliferation [Citation28].
PSMC1 is an ATPase belonging to the triple-A family of ATPases that forms an essential component of the 19S proteasome [Citation29]. The existing literature review suggests a close relationship between the expression of PSMC1 and PSMC6 [Citation30,Citation31]. In addition, the correlation analysis of a previous study indicated that genes associated with PSMC6 are highly enriched in Wnt signaling pathways, illustrating that PSMC1 can also be associated with Wnt signaling [Citation31].
Cell division cycle 42 (CDC42), a member of the Rho GTPase family regulates cytoskeletal reorganization in various ways [Citation32]. Although CDC42SE2 could not be validated in the current study, a previous study confirmed the importance of CDC42 in bone metabolism and bone deterioration [Citation33,Citation34]. In addition, CDC42 is closely correlated with immunity and inflammation [Citation35]. Osteoclastogenesis and bone resorption can be suppressed by inhibiting CDC42 activity [Citation36]. A previous study on nerve damage indicated that CDC42 regulated Schwann cell migration and proliferation via both canonical and non-canonical Wnt signaling pathways [Citation37]. This finding suggests that CDC42 is a valuable target, which should be explored in further studies.
It is conceivable that these key genes may mediate the progression of HO during AS through Wnt signaling. Further experimental validation is required for the better elucidation of this association.
Two main reasons that attributed to the use of MSCs for experimental validation are: Firstly, MSCs are identified as important participants in the pathogenesis of various rheumatic diseases [Citation38,Citation39]. Secondly, osteoblasts, which are differentiated MSCs, play significant roles during bone formation [Citation40]. Previous studies indicate that MSCs are involved in HO progression [Citation10], notably during AS [Citation7,Citation8,Citation41]. Yu et al. suggested that MSCs play a key role in chondrocyte proliferation, hypertrophy, calcification, and osteoblasts differentiation during AS-induced HO [Citation3]. In the current study, the low expression of TCP1 was observed in both MSCs and the nuclei of fibrochondrocytes of ligament samples. These findings validate to an extent, the potential role of TCP1 in HO inhibition.
However, this study is not completely devoid of shortcomings. Although molecular experiments preliminarily validate the findings in the present study, a larger sample size, more detailed clinical data, and functional studies of key genes are necessary. Additionally, the expression of key genes is subjected to change due to inflammatory microenvironments, different cell types, differentiation directions, and durations. Hence, further elucidation of the specific roles of these key genes would support the present findings and help understand the etiology of HO progression in AS in future studies.
Conclusions
This study adopts a novel approach of investigating AS-related HO by constructing co-expression networks for identifying key modules and genes involved in pathogenesis. One key module and two genes are reported to be crucial components in the molecular mechanism of AS-related HO. The low expression levels of TCP1 and PSMC1 gene in AS patients may result in the formation of HO directly or indirectly. This finding can direct future investigations on AS-related HO and the treatment of abnormal osteogenesis. Further experimental validation of these key genes is needed for better comprehension of the molecular mechanisms underlying AS-related HO.
Research highlights
TCP1 and PSMC1 play an important role in progression of AS-induced HO.
Proteasome pathway is activated during AS progression.
Key genes may mediate AS-induced HO progression through Wnt signaling.
Ethical approval
This study was approved by the Institutional Review Board of the Affiliated Drum Tower Hospital of Nanjing University Medical School (IRB approval no. 2,011,052).
Device Status/Drug Statement
The manuscript submitted does not contain information about the medical device(s)/drug(s) used.
Acknowledgements
BPQ and YQ acknowledge the Jiangsu Provincial Medical Talent Program (ZDRCA2016068) and the Jiangsu Provincial Key Medical Center (YXZXA2016009), respectively, for funding this work.
Disclosure statement
The authors do not report any conflict of interest reading the materials or methods used in this study or the findings of this paper.
Additional information
Funding
References
- Torossian F, Guerton B, Anginot A, et al. Macrophage-derived oncostatin M contributes to human and mouse neurogenic heterotopic ossifications. JCI Insight. 2017;2(21). DOI:10.1172/jci.insight.96034
- Qian BP, Ji ML, Qiu Y, et al. Identification of serum miR-146a and miR-155 as novel noninvasive complementary biomarkers for ankylosing spondylitis. Spine (Phila Pa 1976). 2016;41(9):735–742.
- Yu T, Zhang J, Zhu W, et al. Chondrogenesis mediates progression of ankylosing spondylitis through heterotopic ossification. Bone Res. 2021;9(1):19.
- Jacques P, Lambrecht S, Verheugen E, et al. Proof of concept: enthesitis and new bone formation in spondyloarthritis are driven by mechanical strain and stromal cells. Ann Rheum Dis. 2014;73(2):437–445.
- Lories RJ, Luyten FP, de Vlam K. Progress in spondylarthritis. Mechanisms of new bone formation in spondyloarthritis. Arthritis Res Ther. 2009;11(2):221.
- Baraliakos X, Heldmann F, Callhoff J, et al. Which spinal lesions are associated with new bone formation in patients with ankylosing spondylitis treated with anti-TNF agents? A long-term observational study using MRI and conventional radiography. Ann Rheum Dis. 2014;73(10):1819–1825.
- Xie Z, Wang P, Li Y, et al. Imbalance between bone morphogenetic protein 2 and noggin induces abnormal osteogenic differentiation of mesenchymal stem cells in ankylosing spondylitis. Arthritis Rheumatol. 2016;68:430–440.
- Li X, Wang J, Zhan Z, et al. Inflammation intensity-dependent expression of osteoinductive Wnt proteins is critical for ectopic new bone formation in ankylosing spondylitis. Arthritis Rheumatol. 2018;70(7):1056–1070.
- Gracey E, Yao Y, Green B, et al. Sexual dimorphism in the Th17 signature of ankylosing spondylitis. Arthritis Rheumatol. 2016;68(3):679–689.
- Torossian F, Guerton B, Anginot A, et al. Macrophage-derived oncostatin M contributes to human and mouse neurogenic heterotopic ossifications. JCI Insight. 2017;2(21). DOI:10.1172/jci.insight.96034
- Ritchie ME, Phipson B, Wu D, et al. limma powers differential expression analyses for RNA-sequencing and microarray studies. Nucleic Acids Res. 2015;43(7):e47.
- Langfelder P, Horvath S. WGCNA: an R package for weighted correlation network analysis. BMC Bioinformatics. 2008;9(1):559.
- Yu G, Wang LG, Han Y, et al. clusterProfiler: an R package for comparing biological themes among gene clusters. Omics. 2012;16(5):284–287.
- Van Der Linden S, Valkenburg HA, Cats A. Evaluation of diagnostic criteria for ankylosing spondylitis. A proposal for modification of the New York criteria. Arthritis Rheum. 1984;27(4):361–368.
- Osyczka AM, Nöth U, Danielson KG, et al. Different osteochondral potential of clonal cell lines derived from adult human trabecular bone. Ann N Y Acad Sci. 2002;961(1):73–7.16.
- Qian BP, Qiu Y, Wang B, et al. Pedicle subtraction osteotomy through pseudarthrosis to correct thoracolumbar kyphotic deformity in advanced ankylosing spondylitis. Eur Spine J. 2012;21(4):711–718.
- Woo JH, Lee HJ, Sung IH, et al. Changes of clinical response and bone biochemical markers in patients with ankylosing spondylitis taking etanercept. J Rheumatol. 2007;34:1753–1759.
- van der Heijde D, Landewé R, Einstein S, et al. Radiographic progression of ankylosing spondylitis after up to two years of treatment with etanercept. Arthritis Rheum. 2008;58(5):1324–1331.
- Wright C, Edelmann M, diGleria K, et al. Ankylosing spondylitis monocytes show upregulation of proteins involved in inflammation and the ubiquitin proteasome pathway. Ann Rheum Dis. 2009;68(10):1626–1632.
- Ahmed AS, Li J, Ahmed M, et al. Attenuation of pain and inflammation in adjuvant-induced arthritis by the proteasome inhibitor MG132. Arthritis Rheum. 2010;62:2160–2169.
- Seavey MM, Lu LD, Stump KL, et al. Novel, orally active, proteasome inhibitor, delanzomib (CEP-18770), ameliorates disease symptoms and glomerulonephritis in two preclinical mouse models of SLE. Int Immunopharmacol. 2012;12(1):257–270.
- Van Dam LS, Osmani Z, Kamerling SWA, et al. A reverse translational study on the effect of rituximab, rituximab plus belimumab, or bortezomib on the humoral autoimmune response in SLE. Rheumatol (Oxford). 2020;59(10):2734–2745.
- Ma M, Yang W, Cai Z, et al. SMAD-specific E3 ubiquitin ligase 2 promotes angiogenesis by facilitating PTX3 degradation in MSCs from patients with ankylosing spondylitis. Stem Cells. 2021;39:581–599.
- Macsai CE, Foster BK, Xian CJ. Roles of Wnt signalling in bone growth, remodelling, skeletal disorders and fracture repair. J Cell Physiol. 2008;215(3):578–587.
- Yang Y, Topol L, Lee H, et al. Wnt5a and Wnt5b exhibit distinct activities in coordinating chondrocyte proliferation and differentiation. Development. 2003;130(5):1003–1015.
- Tang N, Cai X, Peng L, et al. TCP1 regulates Wnt7b/beta-catenin pathway through P53 to influence the proliferation and migration of hepatocellular carcinoma cells. Signal Transduct Target Ther. 2020;5(1):169.
- Qian T, Cui L, Liu Y, et al. High expression of chaperonin-containing TCP1 subunit 3 may induce dismal prognosis in multiple myeloma. Pharmacogenomics J. 2020;20(4):563–573.
- Qu H, Zhu F, Dong H, et al. Upregulation of CCT-3 induces breast cancer cell proliferation through miR-223 competition and Wnt/beta-catenin signaling pathway activation. Front Oncol. 2020;10:533176.
- Gómez-Garre P, Jesús S, Carrillo F, et al. PSMC1 gene in Parkinsons disease. Eur Neurol. 2012;68(4):193–198.
- Shi CX, Kortum KM, Zhu YX, et al. CRISPR genome-wide screening identifies dependence on the proteasome subunit PSMC6 for bortezomib sensitivity in multiple myeloma. Mol Cancer Ther. 2017;16(12):2862–2870.
- Zhang JY, Shi KZ, Liao XY, et al. The silence of PSMC6 inhibits cell growth and metastasis in lung adenocarcinoma. BioMed Res Int. 2021;2021:9922185.
- Amano M, Nakayama M, Kaibuchi K. Rho-kinase/ROCK: a key regulator of the cytoskeleton and cell polarity. Cytoskeleton (Hoboken). 2010;67(9):545–554.
- Liu Y, Dou Y, Yan L, et al. The role of Rho GTPases’ substrates Rac and Cdc42 in osteoclastogenesis and relevant natural medicinal products study. Biosci Rep. 2020;40(7). DOI:10.1042/BSR20200407
- Hu X, Ji X, Yang M, et al. Cdc42 is essential for both articular cartilage degeneration and subchondral bone deterioration in experimental osteoarthritis. J Bone Miner Res. 2018;33(5):945–958.
- Cao J, Zhang C, Jiang GQ, et al. Identification of hepatocellular carcinoma-related genes associated with macrophage differentiation based on bioinformatics analyses. Bioengineered. 2021;12(1):296–309.
- Park SJ, Lee JY, Lee SH, et al. SLIT2 inhibits osteoclastogenesis and bone resorption by suppression of Cdc42 activity. Biochem Biophys Res Commun. 2019;514(3):868–874.
- Han B, Zhao JY, Wang WT, et al. Cdc42 promotes Schwann cell proliferation and migration through Wnt/beta-catenin and p38 MAPK signaling pathway after sciatic nerve injury. Neurochem Res. 2017;42(5):1317–1324.
- Bocelli-Tyndall C, Bracci L, Spagnoli G, et al. Bone marrow mesenchymal stromal cells (BM-MSCs) from healthy donors and auto-immune disease patients reduce the proliferation of autologous- and allogeneic-stimulated lymphocytes in vitro. Rheumatol (Oxford). 2007;46(3):403–408.
- Sun LY, Zhang HY, Feng XB, et al. Abnormality of bone marrow-derived mesenchymal stem cells in patients with systemic lupus erythematosus. Lupus. 2007;16(2):121–128.
- Li F, Wu H, Zou G, et al. Circular RNA_0062582 promotes osteogenic differentiation of human bone marrow mesenchymal stem cells via regulation of microRNA-145/CBFB axis. Bioengineered. 2021;12(1):1952–1963.
- Liu CH, Raj S, Chen CH, et al. HLA-B27-mediated activation of TNAP phosphatase promotes pathogenic syndesmophyte formation in ankylosing spondylitis. J Clin Invest. 2019;129(12):5357–5373.