
ABSTRACT
CircPRKDC has been disclosed to participate in the tumorigenesis of serval tumors, but the regulatory mechanisms of circPRKDC in GC are still unknown. CircPRKDC, miR-493-5p, and insulin receptor substrate 2 (IRS2) levels were tested by RT-qPCR. The epithelial-mesenchymal transition (EMT)-related protein levels were evaluated via western blot. The cell viability, migration and invasion were evaluated through CCK-8 and Transwell assays. Luciferase reporter and RIP assays were employed to confirm the binding ability between miR-493-5p and circPRKDC or IRS2. CircPRKDC was upregulated in GC samples, and circPRKDC silencing restrained GC cell viability, metastasis, and EMT and suppressed GC tumor growth. Besides, miR-493-5p was a target of circPRKDC, and the repressive impact of circPRKDC knockdown on GC development was neutralized by miR-493-5p inhibition. Moreover, miR-493-5p targeted IRS2 and IRS2 addition rescued the effects of circPRKDC depletion on GC progression. Finally, circPRKDC knockdown could regulate IRS2 expression by targeting miR-493-5p. These results elaborated that circPRKDC accelerated GC development via sponging miR-493-5p and increasing IRS2, which might provide novel potential targets for GC treatment.
KEYWORDS:
Introduction
Gastric cancer (GC) is a major cause of cancer-related mortality around the world and the most common digestive tract-derived malignancy in East Asia, especially in China [Citation1–3]. In recent years, numerous improvements have been achieved in therapeutic methods for GC patients; nevertheless, there is still a high recurrence and metastasis rate in GC patients [Citation4,Citation5]. Since there are few specific symptoms for GC, many patients were diagnosed with GC at an advanced stage [Citation6]. At present, there is still a lack of clear understanding of the mechanism in GC progression and metastasis, which greatly limits the development of more effective diagnostic and therapeutic methods [Citation7]. Hence, it is urgent to find novel biomarkers for GC therapy.
Circular RNAs (circRNAs) are a novel type of RNAs characterized by a covalently closed-loop structure [Citation8]. Recently, there is a heated discussion over the functions of circRNAs in different tumor progression [Citation9]. For instance, circRNA_0000392 regulated the miR-193a-5p/PIK3R3/AKT pathway to accelerate colorectal cancer tumorigenesis [Citation10]. Circ_POLA2 facilitated the malignant progression of lung cancer via elevating GNB1 by targeting miR-326 [Citation11]. CircNRIP1 interacted with miR-149-5p to facilitate GC development by activating the AKT1/mTOR pathway [Citation12]. Previous studies also implied that circPRKDC level was increased in colorectal cancer and aggravated the development and chemoresistance of colorectal cancer [Citation13,Citation14]. Nevertheless, the regulatory mechanism of circPRKDC in GC is unclear.
MicroRNAs (miRNAs) are small non-coding RNAs of 18–22 nts in length [Citation15], which serve as an essential function in tumorigenesis [Citation16,Citation17]. miR-493-5p was demonstrated to exert an anti-tumor effect in human cancers. For example, miR-493-5p suppressed tumorigenicity through downregulating FUT4 in breast cancer [Citation18]. miR-493-5p facilitated apoptosis and inhibited viability in hepatocellular cancer cells via modulating VAMP2 [Citation19]. miR-493-5p inhibited colorectal cancer cell migration by modulating the PI3K-Akt-FoxO3a pathway [Citation20]. Nevertheless, its potential regulating mechanism in GC is still unclear.
The purpose of this research is to evaluate the molecular mechanism of circPRKDC in GC, and we hypothesized that circPRKDC was an oncogenic factor in GC. Results from our study indicated that circPRKDC facilitated cell viability, metastasis, and EMT of GC through miR-493-5p/IRS2 axis. This discovery may offer new sights in GC treatment.
Materials and methods
Clinical samples
A total of 36 pairs of GC and adjacent non-tumor tissues and serum were gained from patients at Weifang People’s Hospital (Weifang, China). In addition, serum samples were collected from 36 healthy individuals as a healthy control group. Written informed consent was gained and this study was approved by the Ethics Committee of Weifang People’s Hospital.
Cell culture
Human GC cell lines (HGC27, AGS, and NCI-N87) and the normal gastric epithelial cell line (GES-1) were gained from the American Type Culture Collection (ATCC, USA) and certificated by STR genotyping. Cells were cultured in RPMI-1640 medium with 10% fetal bovine serum (FBS) at 37°C with 5% CO2. HGC27 cells were derived from the metastatic lymph nodes of GC. AGS cells were derived from gastric adenocarcinoma. NCI-N87 cells were derived from gastric tubular adenocarcinoma.
Cell transfection
The shRNA targeting circPRKDC (shcircPRKDC) was designed to knockdown circPRKDC, with non-targeted shRNA (shNC) as the negative control. miR-493-5p mimics/inhibitor was synthesized to upregulate or downregulate miR-493-5p expression, with NC mimics or NC inhibitor as the negative control. The full-length sequence of IRS2 was subcloned into pcDNA3.1 vectors to overexpress IRS2, with pcDNA3.1 vector serving as the control. All plasmids were bought from Genepharma. The transfection process was performed with Lipofectamine 2000 (Invitrogen). After 48-h transfection, the cells were harvested for subsequent experiments.
Reverse transcription-quantitative PCR (RT-qPCR)
Total RNA was isolated from GC tissues, adjacent non-tumor tissues, GC cell lines (HGC27, AGS, and NCI-N87), and the normal gastric epithelial cell line (GES-1) using TRIzol® reagent (Invitrogen). The synthesization of cDNAs was done through using the PrimeScript RT reagent Kit (TaKaRa). Then, qPCR was conducted using the SYBR-Green PCR Master Mix kit (Takara Bio, Inc.) on the ABI Prism 7300 Sequence Detection System (Applied Biosystems; Thermo Fisher Scientific, Inc.). The PCR amplification reaction was carried out with the following conditions: 95°C for 10 min, 95°C for 15 sec, 62°C for 30 sec, and 72°C for 30 sec. GAPDH and U6 were used as endogenous control. 2−ΔΔCt method was used for calculation of relative gene expression. The primers were as follows: circ-PRKDC forward, 5ʹ-TAAAGATCGCCTGGCTCAGT-3ʹ and reverse, 5ʹ-GGTTGTAGCCTGGCCAAAT-3ʹ; miR-493-5p forward, 5ʹ-GGTCCAGAGGGGAGAT-3ʹ and reverse, 5ʹ-GAATACCTCGGACCCTGC-3ʹ; IRS2 forward, 5ʹ-TCTCAGGAAAAGCAGCGAGG-3ʹ and reverse, 5ʹ-TCACGTCGATGGCGATGTAG-3ʹ; GAPDH forward, 5ʹ-GAATGGGCAGCCGTTAGGAA-3ʹ and reverse, 5ʹ-AAAAGCATCACCCGGAGGAG-3ʹ; U6 forward, 5ʹ-AATTGGAACGATACAGAGAAGATTAGC-3ʹ and reverse, 5ʹ-TATGGAACGCTTCACGAATTTG-3ʹ.
CCK-8 assay
Cell Counting Kit-8 (CCK-8; Beyotime) was used to measure cell viability [Citation21]. HGC27 and AGS cells (1 × 10⁴) were seeded into 96-well plates and cultured for 24, 48, and 72 h. Then, 10 μl CCK-8 reagent was added to each well and cultured for 2 h at 37°C. The absorption was recorded at 450 nm by a microplate reader (Bio-Rad).
Colony formation assay
Transfected HGC27 and AGS cells (400 cells/well) were seeded in 6-well plates. Following incubation for 2 weeks, HGC27 and AGS cells were fixed and stained with 0.5% crystal violet both at room temperature for 10 min. Then, colony numbers were counted using a light microscope [Citation22].
Transwell assay
Transwell assays were performed to evaluate the migration and invasion abilities of HGC27 and AGS cells [Citation23]. Cell migration and invasion were assessed using Transwell chambers (8.0-μm). Briefly, 1 × 10⁵ cells were plated in the upper chamber in serum-free media (precoated with Matrigel for invasion assay). 600 µl medium was added into the lower chambers. 48 h later, the cells on the lower surface were fixed using 4% paraformaldehyde solution and dyed with 0.1% crystal violet. The migratory or invasive cells were counted under a microscope (Nikon).
Western blot
Total protein was isolated via RIPA lysis buffer (Beyotime, China) and quantified using the BCA Protein Assay kit (Pierce; Thermo Fisher Scientific, Inc.). Proteins (20 μg) were separated using 10% SDS-PAGE, and then transferred to the PVDF membrane (Millipore, USA). The membranes were sealed with 5% skimmed milk for 2 h and probed with primary antibodies against E-cadherin (Abcam), N-cadherin (Abcam), and β-actin (Abcam) overnight at 4°C, followed by incubation with secondary antibodies for 1 h at 37°C. The bands were visualized by the ECL Kit.
Dual-luciferase reporter assay
Dual-luciferase reporter assay (Promega Corporation) was performed to investigate the interaction between miR-493-5p and circPRKDC or IRS2 [Citation24]. Site-directed mutagenesis was used to create the mutant 3ʹ-untranslated region (UTR) sequence of IRS2 and circPRKDC. Wild-type or mutant circPRKDC or IRS2 sequences were cloned into pmirGLO vectors (Promega). These constructed reporters were co-transfected with miR-493-5p mimics or NC mimics into HGC27 and AGS cells. The luciferase activities were detected through the Dual-Luciferase Reporter Assay System (Promega).
RNA-binding protein immunoprecipitation (RIP) assay
RIP assay was performed with a Magna RIP RNA-binding protein immunoprecipitation kit (Millipore) [Citation25]. Briefly, HGC27 and AGS cells were lysed with RNA lysis buffer (Beyotime) and incubated with magnetic beads binding to anti-Argonaute2 (Ago2; Abcam) or negative control anti-IgG. After incubation, the enrichment of miR-493-5p and circPRKDC and IRS2 were measured by RT-qPCR.
In vivo assay
The animal protocols were approved by the Ethics Committee of Weifang People’s Hospital. HGC27 cells transfected with shNC or shcircPRKDC were subcutaneously injected into male BALB/c nude mice. The volume and weight of the tumors were determined every 7 days. The tumors were dissected and analyzed.
Immunohistochemistry staining (IHC) assay
Tumor tissues were fixed with 4% paraformaldehyde, embedded in paraffin. and cut into 4 μm sections. Next, sections were incubated with Ki67 (Abcam), E-cadherin (Abcam), N-cadherin (Abcam) and cleaved caspase-3 (Abcam) antibodies at 4°C overnight. After incubation with secondary antibody, the sections were were stained by hematoxylin and photographed under a microscope [Citation26].
Statistical analysis
Data are displayed as the mean ± SD using SPSS 19.0 software (SPSS, Inc.). The association between genes was assessed using Pearson’s correlation analysis. Student’s t-test or one-way ANOVA was used to compare the significant difference between groups. The diagnostic value was analyzed by the ROC curve. p < 0.05 indicated statistical significance.
Results
To explore the function and molecular mechanism of circPRKDC in GC, a series of functional assays were carried out, and the results determined that circPRKDC could promote GC progression by regulating the miR-493-5p/IRS2 axis.
CircPRKDC level is enhanced in GC
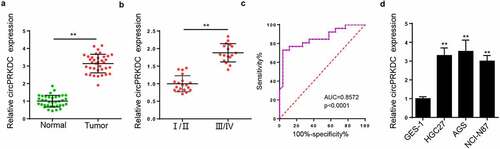
Firstly, we measured the circPRKDC levels in GC tissues and RT-qPCR displayed that circPRKDC was overexpressed in GC tissues (). Moreover, it was found that circPRKDC expression was higher in the III/IV stage than that in I/II stage (). The ROC curve results indicated that the area under the curve (AUC) of circPRKDC was 0.8572 (), suggesting that circPRKDC could be used as an indicator for diagnosing GC. Moreover, RT-qPCR elaborated that circPRKDC level was increased in GC cells (HGC27, AGS, and NCI-N87) (). As circPRKDC was most highly expressed in HGC27 and AGS cells, the two cell lines were adopted for the following assays.
Figure 1. CircPRKDC level is enhanced in GC. (a) RT-qPCR showed the relative expression of circPRKDC in GC tissues (n = 36) and adjacent normal tissues (n = 36). (b) RT-qPCR showed the relative expression of circPRKDC in patients with GC in stage I/II (n = 19) and III/IV (n = 17).(c) The ROC curve of serum circPRKDC for diagnosing GC. (d) RT-qPCR showed the relative expression of circPRKDC in GC cell lines (HGC27, AGS, and NCI-N87) and normal gastric epithelial cell line (GES-1). **p < 0.01
Silence of circPRKDC restrains the viability, migration, and invasion of GC cells
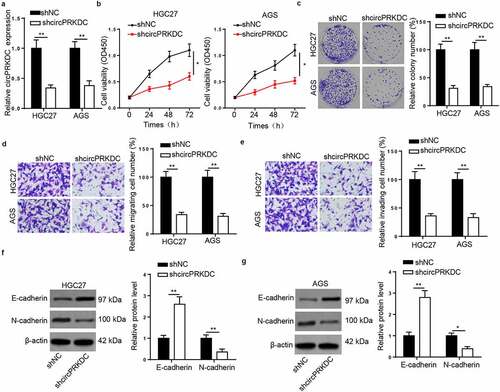
To verify the underlying mechanism of circPRKDC in GC, we interfered with circPRKDC by transfection with shcircPRKDC in HGC27 and AGS cells (). Then, CCK-8 and colony formation assays found that the viability of HGC27 and AGS cells was repressed by circPRKDC depletion ( and c). Moreover, transwell assay results demonstrated that circPRKDC silence restrained GC cell migrated and invaded capacity ( and e). Next, EMT markers were analyzed via western blot. The E-cadherin level was raised, and N-cadherin level was constrained after circPRKDC deletion ( and g). These findings implied that circPRKDC deletion may suppress GC progression in vitro.
Figure 2. Silence of circPRKDC restrains the viability, migration and invasion of GC cells. (a) RT-qPCR showed the relative expression of circPRKDC in HGC27 and AGS cells transfected with shNC and shcircPRKDC. (b and c) CCK-8 and colony formation assays showed the viability of HGC27 and AGS cells transfected with shNC and shcircPRKDC. (d and e) Transwell assay showed that the migration and invasion abilities of HGC27 and AGS cells transfected with shNC and shcircPRKDC. (f and g) Western blot showed the protein levels of E-cadherin and N-cadherin in HGC27 and AGS cells transfected with shNC and shcircPRKDC. *p < 0.05, **p < 0.01, ***p < 0.001
CircPRKDC knockdown suppresses tumor growth in vivo
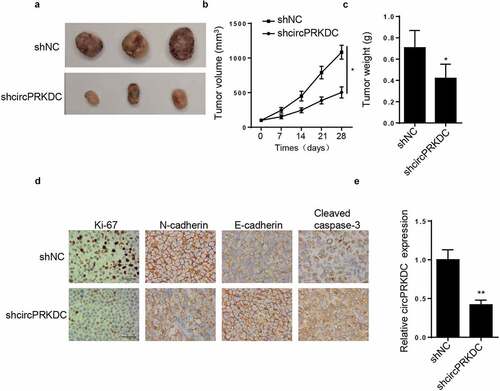
To verify the function of circPRKDC in GC tumorigenesis in vivo, HGC27 cells with stable transfection of shcircPRKDC or shNC were inoculated into nude mice via subcutaneous injection. As depicted in , the volume and weight tumors from the mice were hampered in shcircPRKDC group. Moreover, IHC showed that the levels of Ki-67 and N-cadherin were decreased, while the levels E-cadherin and cleaved caspase 3 were increased in shcircPRKDC group compared with shNC group (). Besides, RT-qPCR indicated that circPRKDC expression was downregulated in shcircPRKDC group (). These findings determined that circPRKDC silence impeded GC tumor growth in vivo.
Figure3. circPRKDC knockdown suppresses tumor growth in vivo. (a) The tumors excised from mice in shcircPRKDC group and shNC group. (b and c) The tumor volume and weight were confirmed in shcircPRKDC group and shNC group. (d) IHC staining showed the levels of Ki-67, E-cadherin, N-cadherin, and cleaved caspase 3 in shcircPRKDC group and shNC group. (e) RT-qPCR was used to measure the levels of circPRKDC in shcircPRKDC group and shNC group. *p < 0.05, **p < 0.01
CircPRKDC sponges miR-493-5p in GC
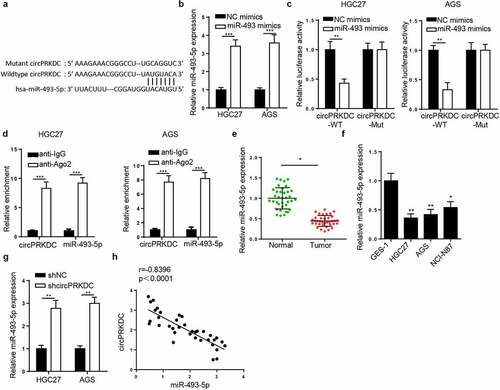
Subsequently, the downstream regulatory mechanism of circPRKDC was probed. It was predicted by StarBase that miR-493-5p could bind to circPRKDC (). Then, the overexpression efficiency of miR-493-5p was confirmed via RT-qPCR (). Moreover, it was demonstrated that the luciferase activity in circPRKDC-WT was reduced after co-transfecting with miR-493-5p mimics, However, no evident changes were observed in circPRKDC-MUT group (). Furthermore, RIP assay elucidated that miR-493-5p and circPRKDC were significantly enriched in the compound precipitated by anti-Ago2 (). Subsequently, RT-qPCR results determined that miR-493-5p level was constrained in GC tissues and cells ( and f). CircPRKDC knockdown markedly augmented miR-493-5p level (), and a distinct negative association between circPRKDC and miR-493-5p was displayed in . These findings uncovered that circPRKDC sponged miR-493-5p in GC.
Figure 4. CircPRKDC sponges miR-493-5p in GC. (a) The binding site between circPRKDC and miR-493-5p was predicted through starBase website. (b) RT-qPCR showed the relative expression of miR-493-5p in HGC27 and AGS cells transfected with NC mimics and miR-493-5p mimics. (c) Luciferase reporter assay showed luciferase activity of circPRKDC-WT or circPRKDC-MUT in GC cells transfected with NC mimics or miR-493 mimics. (d) The RIP assay was performed by using Ago2 to study the relationship between circPRKDC and miR-493-5p. (e and f) miR-493-5p expression was verified through RT-qPCR in GC tissues and cells. (g) RT-qPCR was employed to assess miR-493-5p expression in HGC27 and AGS cells transfected with shNC and shcircPRKDC. (h) Pearson’s correlation analysis showed the correlation between miR-493-5p and circPRKDC in GC tissues. *p < 0.05, **p < 0.01, ***p < 0.001
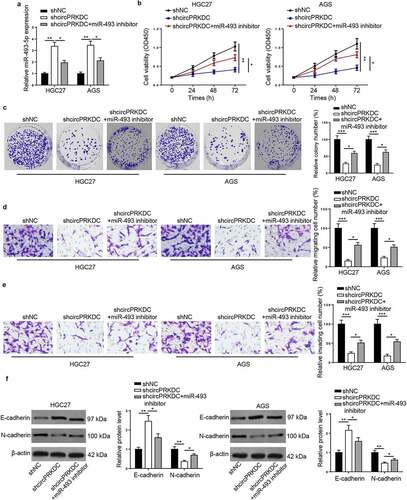
CircPRKDC contributes to GC progression via miR-493-5p
To further explore whether circPRKDC promoted the tumorigenesis of GC through regulating miR-493-5p, functional assays were conducted. Firstly, HGC27 and AGS cells were transfected with shNC, shcircPRKDC, and shcircPRKDC+miR-493 inhibitor. As shown in , miR-493-5p suppression partially abrogated the promoting impact of circPRKDC knockdown on miR-493-5p expression. CCK-8 and colony formation discovered that circPRKDC deficiency impeded cell viability in GC cells, and the repression on cell viability was eliminated by miR-493-5p silence ( and c). Besides, the downregulation of circPRKDC restrained the migrative and invasive abilities of GC cells, and such repression could be abolished after inhibition of miR-493-5p ( and e). Moreover, circPRKDC knockdown elevated E-cadherin and decreased N-cadherin level, while these impacts were partially reversed by miR-494 inhibition (). Taken together, it was disclosed that circPRKDC promoted the cell viability and metastasis of GC cells via miR-493-5p.
Figure 5. CircPRKDC contributes to GC progression via miR-493-5p. (a) RT-qPCR showed the relative expression of miR-493-5p in HGC27 and AGS cells transfected with shNC, shcircPRKDC, shcircPRKDC+miR-493-5p inhibitor. (b and c) CCK-8 and colony formation assays showed the viability of HGC27 and AGS cells transfected with shNC, shcircPRKDC, shcircPRKDC+miR-493-5p inhibitor. (d and e) Transwell assay showed that the migration and invasion abilities of HGC27 and AGS cells transfected with shNC, shcircPRKDC, shcircPRKDC+miR-493-5p inhibitor. (f) Western blot showed the protein levels of E-cadherin and N-cadherin in HGC27 and AGS cells transfected with shNC, shcircPRKDC, shcircPRKDC+miR-493-5p inhibitor. *p < 0.05, **p < 0.01, ***p < 0.001
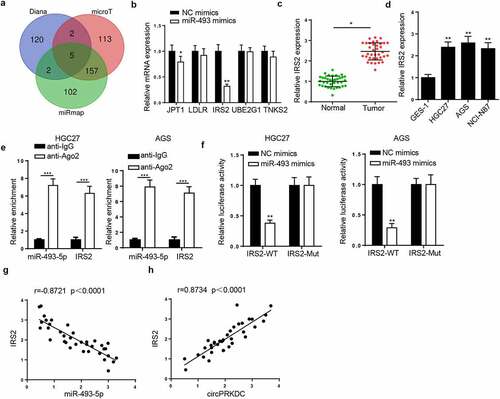
IRS2 is a target of miR-493-5p
The downstream target of miR-493-5p was further investigated. Venn diagram showed that 5 target genes existed in microT, miRmap, and Diana databases (). Then, the JPT1, LDLR, IRS2, UBE2G1, and TNKS2 levels were detected after miR-493-5p supplementation. The IRS2 expression exhibited the most significant change by overexpressing miR-493-5p (). In addition, IRS2 level was notably raised in GC tissues and cells ( and d). Findings from RIP and luciferase reporter assays elaborated that miR-493-5p could bind with IRS2 ( and f). Next, IRS2 level was uncovered to be negatively correlated with miR-493-5p, and positively related to circPRKDC in GC tissues ( and h). In summary, miR-493-5p negatively modulated IRS2 level via direct interaction.
Figure 6. IRS2 is a target of miR-493-5p. (a) The venn diagram showed the downstream target genes which could bind with miR-493-5p in microT, miRmap and Diana databases. (b) The JPT1, LDLR, IRS2, UBE2G1 and TNKS2 levels were examined through RT-qPCR after overexpressing miR-493-5p. (c and d) IRS2 expression was verified in GC tissues and cells through RT-qPCR. (e and f) The binding ability between miR-493-5p and IRS2 was evaluated through RIP and luciferase reporter assay. (g and h) The correlation between IRS2 and miR-493-5p (or circPRKDC) expression in GC tissues was confirmed. *p < 0.05, **p < 0.01, ***p < 0.001
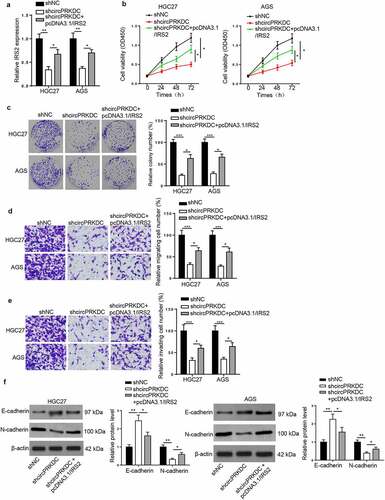
CircPRKDC facilitates GC progression via the miR-493-5p/IRS2 axis
Finally, rescue assays were conducted to verify whether circPRKDC facilitated GC progression through regulating IRS2. RT-qPCR indicated that circPRKDC deletion downregulated the mRNA level of IRS2, but this effect could be offset by upregulating IRS2 (). Then, the addition of IRS2 reversed the circPRKDC silence-induced inhibition of cell viability in GC cells ( and c). Moreover, circPRKDC depletion repressed cell migration and invasion, which was subsequently improved by pcDNA3.1/IRS2 transfection ( and e). Besides, the enhanced E-cadherin and the reduced N-cadherin caused by silencing circPRKDC were reversed following overexpressing IRS2 (). The above results confirmed that circPRKDC contributed to GC development via the miR-493-5p/IRS2 axis.
Figure 7. CircPRKDC facilitates GC progression via the miR-493-5p/IRS2 axis. (a) RT-qPCR showed the relative expression of IRS2 in HGC27 and AGS cells transfected with shNC, shcircPRKDC, shcircPRKDC+pcDNA3.1/IRS2. (b and c) CCK-8 and colony formation assays showed the viability of HGC27 and AGS cells transfected with shNC, shcircPRKDC, shcircPRKDC+pcDNA3.1/IRS2. (d and e) Transwell assay showed that the migration and invasion abilities of HGC27 and AGS cells transfected with shNC, shcircPRKDC, shcircPRKDC+pcDNA3.1/IRS2. (f) Western blot showed the protein levels of E-cadherin and N-cadherin in HGC27 and AGS cells transfected with shNC, shcircPRKDC, shcircPRKDC+pcDNA3.1/IRS2. *p < 0.05, **p < 0.01, ***p < 0.001
Discussion
The effect of dysregulated circRNAs on numerous cancers’ progression has received extensive attention, and several circRNAs have been uncovered as oncogenes in GC [Citation27]. For example, circNRIP1 facilitated viability and metastasis of GC cells via the AKT1/mTOR pathway [Citation28]. CircDONSON promoted GC progression by activating SOX4 via NURF complex [Citation29]. CircCACTIN facilitated GC tumorigenesis via targeting the miR-331-3p/TGFBR1 regulatory axis [Citation30]. CircPRKDC was identified to be implicated in the development of several cancers, including colorectal cancer [Citation31], breast cancer [Citation32], and osteosarcoma [Citation33]. In this research, we found that circPRKDC was enhanced in GC tissues and cells. As indicated by functional assays in vitro and in vivo, we further identified the oncogenic role of circPRKDC in GC.
Increasing studies indicated that circRNAs could regulate gene expression transcriptionally as sponges for miRNAs in the competing endogenous RNA (ceRNA) network, thus affecting biological processes involved in cancers [Citation34]. For instance, circRNA_0058063 bound with miR-486-3p to contribute to bladder cancer by upregulating FOXP [Citation35]. CircPDZD8 hampered GC cell viability via the miR-197-5p/CHD9 axis [Citation36]. Herein, miR-493-5p was uncovered to be a direct target of circPRKDC. Moreover, miR-493-5p was identified to inhibit the tumorigenesis of various cancers, including bladder cancer and hepatic cancer [Citation37,Citation38]. Our results implied that miR-493-5p level was declined in GC tissues, and was inversely correlated with circPRKDC. Moreover, miR-493-5p suppression recovered the repressive impact of circPRKDC deficiency on GC progression. These data indicated that circPRKDC promoted the tumorigenesis of GC by targeting miR-493-5p.
MiRNAs are transcribed by RNA polymerase II, processed, and exported to the cytoplasm where they bind to the 3ʹ UTRs of target mRNAs to inhibit translation, which can further regulate the pathogenesis of various diseases [Citation39]. To determine the downstream regulator of miR-493-5p, the target genes of miR-493-5p were predicted. IRS2 is a signaling adapter protein belonging to the family of IRS [Citation40]. Previous studies reported that IRS2 regulated by miRNAs participates in the tumorigenesis of numerous cancers. To cite an instance, miR-766 restrained cell viability and induced the apoptosis of papillary thyroid cancer vis modulating IRS2 [Citation41]. miR-146a repressed esophageal squamous cell carcinoma progression by reducing IRS2 level [Citation42]. This research demonstrated that miR-493-5p targeted IRS2 and overexpression of IRS2 rescued the repressive impact of circPRKDC silence on GC progression. Moreover, circPRKDC was uncovered to increase IRS2 level by downregulating miR-493-5p in GC. These results demonstrated that circPRKDC contributed to GC progression and acted as a ceRNA to regulate IRS2 by sponging miR-493-5p.
Conclusion
The present research was the first to explore the function and mechanism of circPRKDC in GC. The results demonstrated that circPRKDC promoted cell viability, migration, and invasion via targeting miR-493-5p to upregulate IRS2 in GC, uncovering the oncogenic role of circPRKDC in GC. The current study might provide a new insight into the tumorigenesis of GC, and circPRKDC might be a potential biomarker of GC diagnosis and treatment.
Disclosure statement
No potential conflict of interest was reported by the author(s).
Additional information
Funding
References
- Ferlay J, Soerjomataram I, Dikshit R, et al. Cancer incidence and mortality worldwide: sources, methods and major patterns in GLOBOCAN 2012. Int J Cancer. 2015;136(5):E359–386.
- Torre LA, Bray F, Siegel RL, et al. Global cancer statistics, 2012. CA Cancer J Clin. 2015;65(2):87–108.
- Gao K, Wu J. National trend of gastric cancer mortality in China (2003-2015): a population-based study. Cancer Commun (Lond). 2019;39(1):24.
- Zhao TT, Xu H, Xu HM, et al. The efficacy and safety of targeted therapy with or without chemotherapy in advanced gastric cancer treatment: a network meta-analysis of well-designed randomized controlled trials. Gastric Cancer. 2018;21(3):361–371.
- Uemura N, Okamoto S, Yamamoto S, et al. Helicobacter pylori infection and the development of gastric cancer. N Engl J Med. 2001;345(11):784–789.
- Van Cutsem E, Ducreux M. Colorectal and gastric cancer in 2015: the development of new agents and molecular classifications. Nat Rev Clin Oncol. 2016;13(2):69–70.
- Ito K, Chuang LS, Ito T, et al. Loss of Runx3 is a key event in inducing precancerous state of the stomach. Gastroenterology. 2011;140(5):1536–1546 e1538.
- Chen LL, Yang L. Regulation of circRNA biogenesis. RNA Biol. 2015;12(4):381–388.
- Zhang HD, Jiang LH, Sun DW, et al. CircRNA: a novel type of biomarker for cancer. Breast Cancer. 2018;25(1):1–7.
- Xu H, Liu Y, Cheng P, et al. CircRNA_0000392 promotes colorectal cancer progression through the miR-193a-5p/PIK3R3/AKT axis. J Exp Clin Cancer Res. 2020;39(1):283.
- Fan Z, Bai Y, Zhang Q, et al. CircRNA circ_POLA2 promotes lung cancer cell stemness via regulating the miR-326/GNB1 axis. Environ Toxicol. 2020;35(10):1146–1156.
- Zhang X, Wang S, Wang H, et al. Circular RNA circNRIP1 acts as a microRNA-149-5p sponge to promote gastric cancer progression via the AKT1/mTOR pathway. Mol Cancer. 2019;18(1):20.
- Wang G, Li Y, Zhu H, et al. <p>Circ-PRKDC facilitates the progression of colorectal cancer through miR-198/DDR1 regulatory axis. Cancer Manag Res. 2020;12:12853–12865.
- Chen H, Pei L, Xie P, et al. Circ-PRKDC Contributes to 5-fluorouracil resistance of colorectal cancer cells by regulating miR-375/FOXM1 Axis and Wnt/β-Catenin Pathway. Onco Targets Ther. 2020;13:5939–5953.
- Bartel DP. MicroRNAs: genomics, biogenesis, mechanism, and function. Cell. 2004;116(2):281–297.
- Qadir MI, Faheem A. miRNA: a Diagnostic and Therapeutic Tool for Pancreatic Cancer. Crit Rev Eukaryot Gene Expr. 2017;27(3):197–204.
- Tutar Y. miRNA and cancer; computational and experimental approaches. Curr Pharm Biotechnol. 2014;15(5):429.
- Zhao L, Feng X, Song X, et al. miR-493-5p attenuates the invasiveness and tumorigenicity in human breast cancer by targeting FUT4. Oncol Rep. 2016;36(2):1007–1015.
- Wang G, Fang X, Han M, et al. MicroRNA-493-5p promotes apoptosis and suppresses proliferation and invasion in liver cancer cells by targeting VAMP2. Int J Mol Med. 2018;41:1740–1748.
- Cui FC, Chen Y, Wu XY, et al. MicroRNA-493-5p suppresses colorectal cancer progression via the PI3K-Akt-FoxO3a signaling pathway. Eur Rev Med Pharmacol Sci. 2020;24:4212–4223.
- Geethadevi A, Nair A, Parashar D, et al. Oncostatin M Receptor-targeted antibodies suppress STAT3 signaling and inhibit ovarian cancer growth. Cancer Res. 2021;canres.0483.2021. DOI:10.1158/0008-5472.CAN-21-0483
- Lu X, Chen L, Li Y, et al. Long non-coding RNA LINC01207 promotes cell proliferation and migration but suppresses apoptosis and autophagy in oral squamous cell carcinoma by the microRNA-1301-3p/lactate dehydrogenase isoform A axis. Bioengineered. 2021. DOI:10.1080/21655979.2021.1972784
- Liao Z, Zhang H, Su C, et al. Long noncoding RNA SNHG14 promotes hepatocellular carcinoma progression by regulating miR-876-5p/SSR2 axis. J Exp Clin Cancer Res. 2021;40(1):36.
- Zhang H, Fang Z, Guo Y, et al. Long noncoding RNA SNHG10 promotes colorectal cancer cells malignant progression by targeting miR-3690. Bioengineered. 2021;12(1):6010–6020.
- Zhang CC, Li Y, Feng XZ, et al. Circular RNA circ_0001287 inhibits the proliferation, metastasis, and radiosensitivity of non-small cell lung cancer cells by sponging microRNA miR-21 and up-regulating phosphatase and tensin homolog expression. Bioengineered. 2021;12(1):414–425.
- Parashar D, Geethadevi A, McAllister D, et al. Targeted biologic inhibition of both tumor cell-intrinsic and intercellular CLPTM1L/CRR9-mediated chemotherapeutic drug resistance. NPJ Precis Oncol. 2021;5(1):16.
- Li R, Jiang J, Shi H, et al. CircRNA: a rising star in gastric cancer. Cell Mol Life Sci. 2020;77(9):1661–1680.
- Zhang X, Wang S, Wang H, et al. Circular RNA circNRIP1 acts as a microRNA-149-5p sponge to promote gastric cancer progression via the AKT1/mTOR pathway. Mol Cancer. 2019;18:20.
- Ding L, Zhao Y, Dang S, et al. Circular RNA circ-DONSON facilitates gastric cancer growth and invasion via NURF complex dependent activation of transcription factor SOX4. Mol Cancer. 2019;18(1):45.
- Zhang L, Song X, Chen X, et al. Circular RNA CircCACTIN promotes gastric cancer progression by sponging MiR-331-3p and Regulating TGFBR1 Expression. Int J Biol Sci. 2019;15(5):1091–1103.
- Jin C, Wang A, Liu L, et al. Hsa_circ_0136666 promotes the proliferation and invasion of colorectal cancer through miR-136/SH2B1 axis. J Cell Physiol. 2019;234(5):7247–7256.
- Liu LH, Tian QQ, Liu J, et al. Upregulation of hsa_circ_0136666 contributes to breast cancer progression by sponging miR-1299 and targeting CDK6. J Cell Biochem. 2019;120(8):12684–12693.
- Zhang C, Zhou H, Yuan K, et al. Overexpression of hsa_circ_0136666 predicts poor prognosis and initiates osteosarcoma tumorigenesis through miR-593-3p/ZEB2 pathway. Aging (Albany NY). 2020;12(11):10488–10496.
- Qi X, Zhang DH, Wu N, et al. ceRNA in cancer: possible functions and clinical implications. J Med Genet. 2015;52(10):710–718.
- Liang H, Huang H, Li Y, et al. CircRNA_0058063 functions as a ceRNA in bladder cancer progression via targeting miR-486-3p/FOXP4 axis. Biosci Rep. 2020;40(3). DOI:10.1042/BSR20193484
- Xia T, Pan Z, Zhang J. CircPDZD8 promotes gastric cancer progression by regulating CHD9 via sponging miR-197-5p. Aging (Albany NY). 2020;12(19):19352–19364.
- Ueno K, Hirata H, Majid S, et al. Tumor suppressor microRNA-493 decreases cell motility and migration ability in human bladder cancer cells by downregulating RhoC and FZD4. Mol Cancer Ther. 2012;11(1):244–253.
- Yasukawa K, Liew LC, Hagiwara K, et al. MicroRNA-493-5p-mediated repression of the MYCN oncogene inhibits hepatic cancer cell growth and invasion. Cancer Sci. 2020;111:869–880.
- Altomare DA, Rybak SM, Pei J, et al. Onconase responsive genes in human mesothelioma cells: implications for an RNA damaging therapeutic agent. BMC Cancer. 2010;10(1):34.
- Lee YH, White MF. Insulin receptor substrate proteins and diabetes. Arch Pharm Res. 2004;27(4):361–370.
- Zhao J, Li Z, Chen Y, et al. MicroRNA‑766 inhibits papillary thyroid cancer progression by directly targeting insulin receptor substrate 2 and regulating the PI3K/Akt pathway. Int J Oncol. 2019;54:315–325.
- Liu H, Ren G, Zhu L, et al. The upregulation of miRNA-146a inhibited biological behaviors of ESCC through inhibition of IRS2. Tumour Biol. 2016;37(4):4641–4647.