
ABSTRACT
Cisplatin (CDDP) has been widely used for glioblastoma treatment. miR-485-5p and E2F transcription factor 1 (E2F1) dysfunction has been reported in glioblastoma. Nonetheless, whether CDDP affects glioblastoma progression via the miR-485-5p-E2F1 axis requires investigation. The expression of miR-485-5p and E2F1 was investigated by quantitative real-time polymerase chain reaction or western blotting in glioblastoma tissues and cell lines. The interaction between miR-485-5p and E2F1 was confirmed using a luciferase assay. The malignancy of glioblastoma was detected using Cell Counting Kit-8, bromodeoxyuridine (BrdU), cell adhesion, flow cytometry, and transwell assays. We identified miR-485-5p downregulation and E2F1 upregulation in glioblastoma, and miR-485-5p inhibited cell growth and elevated cell apoptosis in glioblastoma cells after CDDP treatment. Moreover, miR-485-5p targeting E2F1 repressed cell growth and improved cell apoptosis in glioblastoma cells after CDDP treatment. Our study revealed that CDDP retarded glioblastoma cell development via the miR-485-5p-E2F1 axis, which may be a new direction for glioblastoma therapy.
Introduction
Glioblastoma is the most common central nervous system malignancy with a poor prognosis [Citation1,Citation2]. Despite advances in understanding the molecular mechanisms of glioblastoma, patients still present a high recurrence rate and a low 5-year survival rate [Citation3,Citation4]. Thus, additional potential mechanisms underlying glioblastoma initiation and progression are crucial for glioblastoma diagnosis and treatment.
Cisplatin (CDDP) has been widely used as a cytotoxic drug in multiple tumors, including lung, bladder, and esophageal cancers [Citation5–7]. CDDP treatment has been frequently applied in the diagnosis and treatment of glioblastoma [Citation8]. For instance, Wang et al. [Citation9] identified miR-152-3p as a CDDP sensitizer for glioblastoma in 2019. In 2020, Kim et al. [Citation10] studied the effects of CDDP on cytotoxicity, apoptosis, autophagy, and the AKT/mTOR pathway in U87MG and U373MG cells. Therefore, we aimed to explore the mechanism of CDDP in glioblastoma, thereby improving the efficacy of CDDP in glioblastoma therapy.
MicroRNAs (miRNAs) consist of approximately 22 nucleotides, which bind to target gene mRNAs’ 3ʹ-untranslated regions (3ʹ-UTR) [Citation11]. miRNAs have been reported to play important roles in regulating cell growth and differentiation in numerous cancers [Citation12,Citation13]. Evidence suggests that miRNAs are key regulators of glioblastoma development under CDDP treatment. For instance, miR-186 reversed CDDP resistance and inhibited Yin Yang 1 expression in glioblastoma, which significantly diminished glioblastoma proliferation [Citation14]. Moreover, miR-152-3p coordinated with CDDP to repress SOS1 expression and reduce glioblastoma cell progression [Citation9]. miR-485-5p has been identified as a suppressor in glioblastoma, hampering cell viability, migration, and invasion, while elevating cell apoptosis in glioblastoma U87 and U251 cells [Citation15,Citation16]. However, whether miR-485-5p influences glioblastoma progression under CDDP treatment remains unknown.
The E2F transcription factor 1 (E2F1) gene is located on chromosome 20q11.22 and consists of seven exons. It encodes a member of the E2F family of transcription factors, which plays a crucial role in controlling the cell cycle and regulating tumor suppressor proteins [Citation17]. Evidence displays that E2F1 aggravates cancer progression as an oncogene [Citation18]. E2F1 has been reported to facilitate glioblastoma development, where it accelerates cell growth under CDDP treatment [Citation19]. One study revealed that miR-136 remarkably repressed E2F1 expression to promote CDDP chemosensitivity in glioma cells [Citation20]. Notably, the function of the miR-485-5p-E2F1 axis in glioblastoma with CDDP treatment is unclear.
Therefore, we aimed to investigate the effect of the miR-485-5p-E2F1 axis in glioblastoma cells under CDDP treatment. It was hypothesized that CDDP-assisted miR-485-5p might reduce E2F1 expression following CDDP treatment in glioblastoma. This study provides novel insights into the molecular mechanisms underlying glioblastoma.
Materials and methods
Clinical Tissues, Cell Culture, and Cell Transfection
Human glioblastoma tissues and adjacent normal tissues were collected from 34 patients in our hospital with informed consent and approved by the Ethics Committee of our hospital. The patients’ baseline data are presented in . Human glioblastoma U251 and U87 cells were obtained from ATCC (VA, USA) and were maintained in Dulbecco’s Modified Eagle’s Medium (Gibco, TX, USA) supplemented with 10% fetal bovine serum (FBS; Gibco) at 37°C and 5% CO2. For CDDP or temozolomide (TMZ) treatment, CDDP (Cat#: 232,120, Sigma-Aldrich, MO, USA) or TMZ (Cat#: 34,219, Sigma-Aldrich) was dissolved in phosphate-buffered saline (PBS), and final concentrations of 10, 20, and 30 μM were added to the medium. The miR-485-5p inhibitor, mimic, E2F1 overexpression plasmid (OE), and their negative controls (NC) were obtained from GenePharm (Shanghai, China). When cells reached 50% confluence, U251 and U87 cells were transfected using Lipofectamine 3000 (Invitrogen, MA, USA), and the following experiments were conducted after 48 h of transfection.
Table 1. The baseline characteristics of 34 glioblastoma patients
RNA Extraction and quantitative real-time polymerase chain reaction (qRT-PCR)
TRIzol reagent (Invitrogen) was used for RNA isolation, and the miRNeasy Mini Kit (Cat#: 217,004, QIAGEN, Hilden, Germany) was used for miRNA isolation from U251 and U87 cells. Next, cDNA transcribed from RNA was applied using the PrimeScript First Strand cDNA Synthesis Kit (Takara Bio, Shiga, Japan), and cDNA transcribed from miRNA was obtained using a miScript II RT Kit (Cat#: 218,161, QIAGEN). qRT-PCR was performed using SYBR Premix Ex Taq (Takara Bio) for E2F1 expression and the miScript SYBR Green PCR Kit (Cat#: #218,075, QIAGEN) for miR-485-5p expression. Relative expression was normalized to Glyceraldehyde-3-phosphate dehydrogenase (GAPDH) or small RNA U6 (U6) using the 2-ΔΔCt method [Citation21]. All primer sequences are listed in .
Table 2. Primer sequences
Cell counting kit-8 (CCK8) assay
U251 and U87 cells were seeded at a density of 1 × 10⁴ cells/well in 96-well plates. After adherence, the cells were treated with different concentrations of CDDP or TMZ for 48 h, followed by the incubation with 10 μL CCK8 solution (Dojindo, Kumamoto, Japan) for 2 h. Furthermore, a different set of cells was treated with 10 μM CDDP and incubated with 10 μL CCK8 solution for 2 h at four time points (0, 24, 48, and 72 h). The OD value at 450 nm was detected using a multimode plate reader (Thermo Fisher Scientific, MA, USA) [Citation20,Citation22].
Bromodeoxyuridine (BrdU) assay
The BrdU assay was performed according to a previous study [Citation23]. U251 and U87 cells were seeded at a density of 1 × 10⁴ cells/well in 96-well plates. After cells reached 80% confluence, the cells were labeled with BrdU (Cat#: ab126556, Abcam, Cambridge, UK) for 12 h. After washing twice with PBS, the cells were permeabilized and incubated with BrdU antibody for 2 h at room temperature. Then, the cells were incubated with anti-mouse antibody (Abcam, Cambridge, UK) for 1 h and subjected to a multimode-plate-reader at OD 450 nm (Thermo Fisher Scientific).
Cell adhesion assay
Collagen I solution (Sigma-Aldrich) was added to a 96-well plate for cell adhesion detection, and 2 × 10⁴ U251 and U87 cells were cultured into the plate at 37°C for 4 h. Post culture, the medium was discarded, and the cells were treated with 3-(4,5-dimethylthiazol-2-yl)-2,5-diphenyltetrazolium bromide reagent (C0009S, Beyotime, Jiangsu, China) for 2 h at 37°C. Then, 100 µL dimethyl sulfoxide was added to each well, and the OD value at 570 nm was detected using a multimode-plate-reader (Thermo Fisher Scientific) [Citation24].
Cell apoptosis assay
As previously described [Citation25], the Annexin V-FITC Apoptosis Detection Kit (Cat#: 556,547; BD, NJ, USA) was used to detect apoptosis in U251 and U87 cells. Cells were harvested and treated with 5 µL fluorescein isothiocyanate and propidium iodide. After incubation for 20 min in the dark, the cells were washed twice, suspended, and analyzed by flow cytometry. The sum of the two right quadrants represented cell apoptosis, which was calculated using the FlowJo software (Tree Star, OR, USA).
Transwell assay
U251 and U87 cell migration was measured using a transwell chamber (Cat#: 3244, Corning, NY, USA) in a 24-well plate. The bottom compartment was prepared with 10% FBS medium, and cell suspensions (2 × 10⁵ cells) without FBS were added to the top compartment. After 24 h of incubation, cells in the upper layer were removed, and cells in the lower layer were treated with 4% paraformaldehyde and 0.5% crystal violet for 15 min. Finally, the migrated cells were randomly captured using a microscope (Olympus, Tokyo, Japan) [Citation26].
Luciferase reporter assay
This assay was performed according to a previous study [Citation27]. Wild-type (WT) sequence of E2F1 3ʹ-UTR based on the binding site, and a random mutated (MUT) sequence was constructed into the pmiRGLO vectors. U251 and U87 cells were co-transfected with pmiRGLO-E2F1-WT or pmiRGLO-E2F1-MUT and either miR-NC or miR-485-5p using Lipofectamine 3000. After 72 h, Firefly and Renilla luciferase activities were applied to the Luciferase Assay Kit (Abcam). Renilla luciferase activity was used as an internal control.
Western blot
E2F1 protein expression was measured by western blotting, as previously described [Citation28]. The protein from the cells was extracted using a cell lysis buffer. Then, 20 µg protein was separated using 10% sodium dodecyl sulfate polyacrylamide gel electrophoresis, transferred onto a polyvinylidene fluoride membrane, and blocked with 5% nonfat milk. The E2F1 (1:1000, Cat#: ab112580, Abcam) and GAPDH (1:5000, Cat#: 5174, CST, MA, USA) antibodies were used to incubate the membranes overnight at 4°C. The membranes were then washed and incubated with anti-HRP-Rabbit antibody (1:5000, Cat#: 80,403, CST) for 1 h at 25°C. Finally, protein bands were detected using enhanced chemiluminescence (ECL) reagents (Thermo Fisher Scientific, MA, USA).
Statistical analysis
Independent sample t-tests for two-group comparisons and one-way analysis of variance with Dunnett’s post hoc test for multiple group comparisons were used for data analysis, which was performed using GraphPad (CA, USA). The data are presented as the mean ± standard deviation based on three independent experiments. Pearson analysis was used to determine the correlation between E2F1 expression and miR-485-5p expression in glioblastoma tissues. Statistical significance was set at P < 0.05.
Results
In this study, we hypothesized that miR-485-5p inhibits glioblastoma progression by suppressing E2F1 expression under CDDP treatment. First, we identified the key miRNA (miR-485-5p) and target gene (E2F1) through bioinformatics analysis and found that CDDP treatment upregulated miR-485-5p levels in glioma cells and downregulated E2F1 levels. To investigate the role of CDDP, miR-485-5p, or E2F1 in glioma cells, we evaluated the effects of CDDP combined with miR-485-5p or E2F1 expression on the viability, proliferation, apoptosis, and invasion of glioma cells. Additionally, we validated target binding between miR-485-5p and E2F1. It was revealed that the CDDP-miR-485-5p-E2F1 axis may be a new direction for glioblastoma therapy.
Upregulated E2F1 level and downregulated miR-485-5p level were observed in glioblastoma
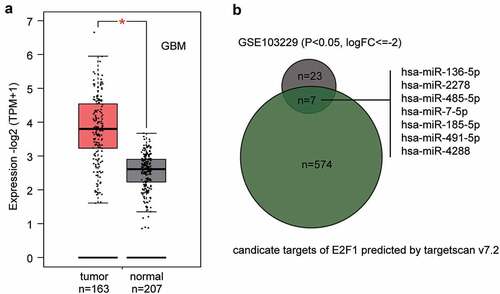
The high E2F1 expression in GEPIA glioblastoma data is shown in . GSE103229 from GEO DataSets stored the miRNAs expression profile in glioblastoma samples and normal brain samples. According to the ceRNA mechanism, there is a negative correlation between miRNA and its target genes. Therefore, to identify a potential upstream regulator miRNA of E2F1 in glioblastoma, we intersected the significantly downregulated miRNAs from the GSE103229 data series (screening criteria: P < 0.05 and logFC≤-2) and the predicted miRNAs that could regulate E2F1 by TargetScan algorithm. Seven candidates were identified to target E2F1 and be downregulated in glioblastoma samples (). The candidates are ranked according to their downregulation levels in GSE103229. miR-136-5p has been reported to be a significant tumor suppressor in glioblastoma and is the most significantly downregulated miRNA among the seven; however, it has been previously studied in CDDP resistance in glioblastoma [Citation20]. The second most ranked miRNA, miR-485-5p, is a significant tumor suppressor in glioblastoma; however, it has never been studied in glioblastoma chemoresistance. Thus, we chose miR-485-5p as our study focus.
Figure 1. The identification of miR-485-5p as the miRNA of interest in this study.(a) The expression level of E2F1 in GBM (glioblastoma multiforme) from GEPIA database (http://gepia2.cancer-pku.cn/). (b) The intersection of the predicted target miRNAs of E2F1 by targetscan v7.2 and the significantly downregulated miRNAs from GSE103229 data series. FC: fold change
CDDP inhibited glioblastoma progression by upregulating miR-485-5p
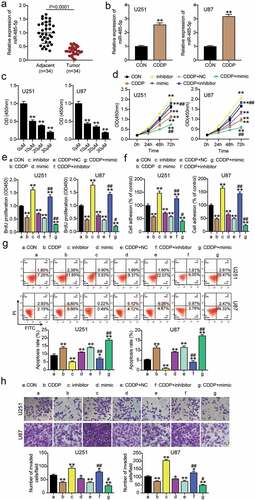
To investigate the function of CDDP and miR-485-5p in glioblastoma, miR-485-5p expression in glioblastoma tissues was examined. The results showed that miR-485-5p expression was downregulated in glioblastoma tissues (). When CDDP was used to treat U251 and U87 cells, miR-485-5p expression increased (). Subsequently, we determined cell viability in U251 and U87 glioblastoma cells treated with CDDP at concentrations of 0, 10, 20,30 μM, and found that cell viability was significantly decreased at 10 μM treatment, which was the half maximal inhibitory concentration (IC50) (). Therefore, we selected 10 μM CDDP for subsequent experiments. In addition, to confirm the CDDP efficacy in glioma cells, cells were also targeted with TMZ. The results showed that cell viability decreased with an increase in TMZ concentration. The OD value of TMZ-treated cells was similar to that of CDDP-treated cells (Supplementary Figure 1). After transfection of the miR-485-5p inhibitor or miR-485-5p mimic in U251 and U87 cells with CDDP treatment, we found that the miR-485-5p inhibitor increased cell viability, miR-485-5p mimic decreased cell viability, and treatment with an inhibitor or mimic accentuated or reversed the inhibitory effect of CDDP on cell viability (). miR-485-5p inhibitor elevated cell proliferation, while the CDDP and miR-485-5p mimic groups reduced cell proliferation (). In addition, the enhanced or decreased cell adhesion of miR-485-5p inhibitor or miR-485-5p mimic were all partially eliminated or sharpened by the inhibitory adhesion of CDDP (). Moreover, 50% reduced cell apoptosis in the miR-485-5p inhibitor group was observed, but cell apoptosis observed in the CDDP or miR-485-5p mimic groups was higher (). Simultaneously, apoptosis changes caused by transfection with mimic or inhibitor were observed to be reversed or aggravated by CDDP treatment (). Finally, cell migration was elevated in the miR-485-5p inhibitor, while the CDDP or miR-485-5p mimic groups repressed cell migration (). Altogether, these data suggest that CDDP suppresses cell growth and enhances cell apoptosis by promoting miR-485-5p in glioblastoma.
Figure 2. CDDP inhibited cell growth and promoted apoptosis by upregulating miR-485-5p levels in glioblastoma. The miR-485-5p level was detected in glioblastoma tissues and adjacent normal tissues by qRT-PCR. (b) The miR-485-5p level was detected in U251 and U87 cells treated with CDDP by qRT-PCR. **, P < 0.001 compared with CON. (c) Cell viability was detected in U251 and U87 cells treated with different concentration of CDDP at 0, 10, 20,30 μM by CCK8 assay. **, P < 0.001 compared with 0 μM. (d) Cell viability was detected in U251 and U87 cells transfected with NC, inhibitor, mimic and treated with CDDP by CCK8 assay. (e) Cell proliferation was detected in U251 and U87 cells transfected with NC, inhibitor, mimic and treated with CDDP by BrdU assay. (f) Cell adhesion was detected in U251 and U87 cells transfected with NC, inhibitor, mimic and treated with CDDP by MTT regent. (g) Cell apoptosis was determined in U251 and U87 cells transfected with NC, inhibitor, mimic and treated with CDDP by FITC apoptosis detection kit. (h) Cell migration was detected in U251 and U87 cells transfected with NC, inhibitor, mimic and treated with CDDP by transwell assay. *, P < 0.05; **, P < 0.001 compared with CON. #, P < 0.05; ##, P < 0.001 compared with CDDP+NC. CON, blank control; inhibitor, miR-485-5p inhibitor; mimic, miR-485-5p mimic; CDDP+NC, CDDP+ negative control; CDDP+ mimic, CDDP+ miR-485-5p mimic; CDDP+ inhibitor, CDDP+ miR-485-5p inhibitor
E2F1 is a target of miR-485-5p in glioblastoma
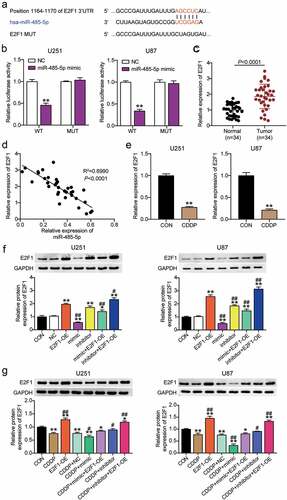
To determine whether E2F1 interacted with miR-485-5p, the binding site between E2F1 and miR-485-5p was obtained using TargetScan Human 7.2 (). The luciferase activity in cells treated with pmiRGLO-E2F1 E2F1 3-UTR WT and miR-485-5p mimic was decreased; however, no difference was observed in cells transfected with pmiRGLO-E2F1 3ʹUTR MUT, suggesting that miR-485-5p interacted with E2F1 in U251 and U87 cells (). Next, we found that E2F1 expression was upregulated in glioblastoma tissues from 34 patients (), and a negative correlation between E2F1 expression and miR-485-5p expression was observed in glioblastoma tissues from 34 patients (). E2F1 expression was downregulated in U251 and U87 cells following CDDP treatment (). In addition, compared with the control group, the E2F1 protein level was upregulated in the E2F1-OE and miR-485-5p inhibitor groups, and downregulated in the mimic group; CDDP treatment facilitated the effect of miR-485-5p mimic and offset the effect of the inhibitor, suggesting that miR-485-5p is upstream of E2F1 under CDDP treatment in glioblastoma ( and g).
Figure 3. E2F1 was a target of miR-485-5p in glioblastoma. TargetScan showed the predicted binding sequences of E2F1 3ʹ-UTR for miR-485-5p. (b) Dual luciferase assay was performed in cells co-transfected with plasmids E2F1 -WT or E2F1 -MUT and miR-NC or miR-485-5p mimic in U251 and U87 cells. **, P < 0.001 compared with NC. (c) The E2F1 expression was detected in glioblastoma tissues and adjacent normal tissues by qRT-PCR. (d) The correlation between E2F1 expression and miR-485-5p level was analyzed by Pearson analysis. (e) The E2F1 expression was detected in U251 and U87 cells treated with CDDP by qRT-PCR. **, P < 0.001 compared with CON. (f) The E2F1 protein expression was detected in U251 and U87 cells transfected with E2F1-OE, NC, mimic, inhibitor, mimic+ OE and inhibitor+ OE by WB detection. (g) The E2F1 protein expression was detected in U251 and U87 cells transfected with E2F1-OE, NC, mimic, inhibitor, mimic+ OE, inhibitor+ OE, and treated with CDDP by WB detection. *, P < 0.05; **, P < 0.001 compared with CON. #, P < 0.05; ##, P < 0.001 compared with CDDP+NC. CON, blank control; E2F1-OE, E2F1-overexpression; CDDP+NC, CDDP+ negative control; CDDP+ mimic, CDDP+miR-485-5p mimic; CDDP+ inhibitor, CDDP+ miR-485-5p inhibitor; CDDP+ mimic+ OE, CDDP+ miR-485-5p mimic+E2F1-overexpression; CDDP+ inhibitor+ OE, CDDP+ miR-485-5p inhibitor+E2F1-overexpression
CDDP hampered cell progression via the miR-485-5p-E2F1 axis in glioblastoma
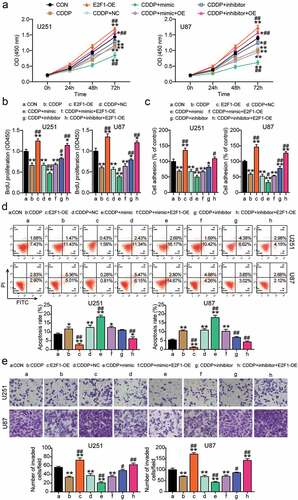
To clarify whether the miR-485-5p-E2F1 axis participates in glioblastoma with CDDP treatment, the CCK8 assay was performed; it was observed that E2F1-OE upregulated cell viability, while this effect was reversed by CDDP and miR-485-5p mimic and aggravated by inhibitor (). Furthermore, E2F1-OE enhanced cell proliferation, while the effect was inhibited by CDDP and miR-485-5p mimic and promoted by the inhibitor (). Moreover, E2F1-OE promoted cell adhesion, while this effect was inhibited by CDDP and the miR-485-5p mimic and accelerated by the inhibitor (). Furthermore, E2F1-OE reduced cell apoptosis, while this effect was suppressed by CDDP and the miR-485-5p mimic and facilitated by the inhibitor (). Finally, E2F1-OE enhanced cell migration, but, this effect was hampered by CDDP and miR-485-5p mimics and aggravated by the inhibitor (). Collectively, the data indicate that CDDP hampers cell growth and promotes cell apoptosis via the miR-485-5p-E2F1 axis in glioblastoma.
Figure 4. CDDP inhibited cell growth and promoted apoptosis via miR-485-5p-E2F1 axis in glioblastoma. Cell viability was detected in U251 and U87 cells transfected with E2F1-OE, NC, mimic, inhibitor, mimic+ OE, inhibitor+ OE, and treated with CDDP by CCK8 assay. (b) Cell proliferation was detected in U251 and U87 cells transfected with E2F1-OE, NC, mimic, inhibitor, mimic+ OE, inhibitor+ OE, and treated with CDDP by BrdU assay. (c) Cell adhesion was detected in U251 and U87 cells transfected with E2F1-OE, NC, mimic, inhibitor, mimic+ OE, inhibitor+ OE, and treated with CDDP by MTT regent. (d) Cell apoptosis was determined in U251 and U87 cells transfected with E2F1-OE, NC, mimic, inhibitor, mimic+ OE, inhibitor+ OE, and treated with CDDP by FITC apoptosis detection kit. (e) Cell migration was detected in U251 and U87 cells transfected with E2F1-OE, NC, mimic, inhibitor, mimic+ OE, inhibitor+ OE, and treated with CDDP by transwell assay. *, P < 0.05; **, P < 0.001 compared with CON. #, P < 0.05; ##, P < 0.001 compared with CDDP+NC. blank control; E2F1-OE, E2F1-overexpression; CDDP+ NC, CDDP+ negative control; CDDP+ mimic, CDDP+ miR-485-5p mimic; CDDP+ inhibitor, CDDP+ miR-485-5p inhibitor; CDDP+ mimic+ OE, CDDP+ miR-485-5p mimic+E2F1-overexpression; CDDP+ inhibitor+ OE, CDDP+ miR-485-5p inhibitor+E2F1-overexpression
Discussion
This study revealed miR-485-5p downregulation and E2F1 upregulation in glioblastoma tissues. miR-485-5p hampered cell proliferation, adhesion, and migration, and elevated cell apoptosis in glioblastoma cells following CDDP treatment. Moreover, miR-485-5p targeting E2F1 repressed glioblastoma progression following CDDP treatment.
miRNAs have been shown to play pivotal roles in cancer with CDDP treatment. Liu et al. found that the knockdown of miR-6727-5 promoted the sensitivity of cervical cancer cells to CDDP [Citation27]. Chen et al. showed that CDDP inhibited miR-132 expression in oral squamous cell carcinoma, thereby regulating the proliferation, invasion, and migration of cancer cells [Citation26]. Moreover. Yang et al. reported that miR-29a significantly repressed prominin-1 (CD133) expression and contributed to CDDP resistance in CD133+ glioblastoma stem cells [Citation29]. Guo et al. reported that Let-7b downregulation elevated cyclin D1 expression under CDDP treatment in glioblastoma cells [Citation30]. Wang et al. found that 10 μM CDDP was an effective concentration for glioblastoma cell treatment, and miR-152-3p downregulation clearly decreased CDDP sensitivity [Citation9]. Similarly, we found that 10 μM CDDP was an effective concentration for glioblastoma cell treatment. We further demonstrated that miR-485-5p retarded cell proliferation, adhesion, and migration, and elevated cell apoptosis in glioblastoma cells after CDDP treatment.
To date, E2F1-targeting treatment has been used in chemotherapy for colorectal and breast cancers [Citation31,Citation32]. One study reported that E2F1 overexpression in glioma-derived cell lines induced p53-independent apoptosis, which was further enhanced by ionizing radiation [Citation33]. Another study showed that adenovirus-mediated transfer of E2F-1 potentiated the chemosensitivity of human glioma cells to TMZ and BCNU [Citation34]. Importantly, Chen et al. revealed that silencing E2F1 enhanced tumor-suppressive functions, while E2F1 upregulation exhibited the opposite effect in glioma cells with CDDP treatment [Citation20]. Consistent with this study, we demonstrated that E2F1 overexpression promoted glioblastoma cell proliferation, adhesion, and migration, and retarded cell apoptosis with CDDP treatment. Importantly, miR-485-5p could repress E2F1 expression and suppressed glioblastoma cell development under CDDP treatment. Our study is the first to show that the CDDP-miR-485-5p-E2F1 axis plays a key role in glioblastoma.
Although our study has revealed that miR-485-5p inhibits glioblastoma cell progression under CDDP treatment by targeting E2F1, the specific signaling pathways require further exploration. Meanwhile, animal models should be applied to confirm the role of the CDDP-miR-485-5p-E2F1 axis in glioblastoma.
Conclusion
Taken together, our study revealed that repressed cell growth and elevated cell apoptosis of glioblastoma cells occurred via the miR-485-5p-E2F1 axis under CDDP treatment. Thus, the CDDP-miR-485-5p-E2F1 axis may be an innovative direction for glioblastoma therapy.
Authors’ contributions
ZQH and FLD performed the experiments and data analysis. CGH and LM conceived and designed the study. RXL and YGZ made the acquisition of data. YW, ZHL and ML did the analysis and interpretation of data. All authors read and approved the manuscript.
Ethics approval and consent to participate
The present study was approved by the Ethics Committee of the The First Hospital of Wuhan (Wuhan, China). The processing of clinical tissue samples is in strict compliance with the ethical standards of the Declaration of Helsinki. All patients signed written informed consent.
Consent to participate
All patients signed written informed consent.
Consent for publication
Consent for publication was obtained from the participants.
Supplemental Material
Download ()Disclosure statement
The authors declare that there is no competing interests.
Availability of data and material
The datasets used and/or analyzed during the current study are available from the corresponding author on reasonable request.
Supplementary material
Supplemental data for this article can be accessed here
Additional information
Funding
Related Research Data
References
- Armstrong TS, Wen PY, Gilbert MR, et al. Management of treatment-associated toxicites of anti-angiogenic therapy in patients with brain tumors. Neuro Oncol. 2012;14(10):1203–1214.
- Bray F, Ferlay J, Soerjomataram I, et al. Global cancer statistics 2018: GLOBOCAN estimates of incidence and mortality worldwide for 36 cancers in 185 countries. CA Cancer J Clin. 2018;68(6):394–424.
- Bageritz J, Puccio L, Piro RM, et al. Stem cell characteristics in glioblastoma are maintained by the ecto-nucleotidase E-NPP1. Cell Death Differ. 2014;21(6):929–940.
- Bernhart E, Damm S, Heffeter P, et al. Silencing of protein kinase D2 induces glioma cell senescence via p53-dependent and -independent pathways. Neuro Oncol. 2014;16(7):933–945.
- Shen Q, Xu Z, Xu S. Long non‑coding RNA LUCAT1 contributes to cisplatin resistance by regulating the miR‑514a‑3p/ULK1 axis in human non‑small cell lung cancer. Int J Oncol. 2020;57:967–979.
- Zhai B, Chen P, Wang W, et al. An ATF(24) peptide-functionalized β-elemene-nanostructured lipid carrier combined with cisplatin for bladder cancer treatment. Cancer Biol Med. 2020;17:676–692.
- Chen H, Zheng B, Xue S, et al. Knockdown of miR-183 enhances the cisplatin-induced apoptosis in esophageal cancer through increase of FOXO1 expression. Onco Targets Ther. 2020;13:8463–8474.
- Contreras-Ochoa CO, López-Arellano ME, Roblero-Bartolon G, et al. Molecular mechanisms of cell death induced in glioblastoma by experimental and antineoplastic drugs: new and old drugs induce apoptosis in glioblastoma. Hum Exp Toxicol. 2020;39(4):464–476.
- Wang M, Wu Q, Fang M, et al. miR-152-3p sensitizes glioblastoma cells towards cisplatin via regulation of SOS1. Onco Targets Ther. 2019;12:9513–9525.
- Kim HI, Hong SH, Ku JM, et al. Gardenia jasminoides enhances CDDP-induced apoptosis of glioblastoma cells via AKT/mTOR pathway while protecting death of astrocytes. Nutrients. 2020;12. DOI:10.3390/nu12010196.
- Calin GA, Croce CM. MicroRNA signatures in human cancers. Nat Rev Cancer. 2006;6(11):857–866.
- Weng L, Ma J, Jia YP, et al. MiR-4262 promotes cell apoptosis and inhibits proliferation of colon cancer cells: involvement of GALNT4. Am J Transl Res. 2018;10:3969–3977.
- Ma F, Zhang L, Ma L, et al. MiR-361-5p inhibits glycolytic metabolism, proliferation and invasion of breast cancer by targeting FGFR1 and MMP-1. J Exp Clin Cancer Res. 2017;36(1):158.
- Li J, Song J, Guo F. miR-186 reverses cisplatin resistance and inhibits the formation of the glioblastoma-initiating cell phenotype by degrading Yin Yang 1 in glioblastoma. Int J Mol Med. 2019;43:517–524.
- Shao L, He Q, Liu Y, et al. UPF1 regulates the malignant biological behaviors of glioblastoma cells via enhancing the stability of Linc-00313. Cell Death Dis. 2019;10(9):629.
- Nayak S, Aich M, Kumar A, et al. Novel internal regulators and candidate miRNAs within miR-379/miR-656 miRNA cluster can alter cellular phenotype of human glioblastoma. Sci Rep. 2018;8(1):7673.
- Chun JN, Cho M, Park S, et al. The conflicting role of E2F1 in prostate cancer: a matter of cell context or interpretational flexibility?, Biochimica et biophysica acta. Rev Cancer. 2020;1873:188336.
- Lv BB, Ma RR, Chen X, et al. E2F1-activated SPIN1 promotes tumor growth via a MDM2-p21-E2F1 feedback loop in gastric cancer. Mol Oncol. 2020;14(10):2629–2645.
- Gong M, Liu H, Sun N, et al. Polyethylenimine-dextran-coated magnetic nanoparticles loaded with miR-302b suppress osteosarcoma in vitro and in vivo. Nanomedicine (Lond). 2020;15(7):711–723.
- Chen W, Yang Y, Chen B, et al. MiR-136 targets E2F1 to reverse cisplatin chemosensitivity in glioma cells. J Neurooncol. 2014;120(1):43–53.
- Livak KJ, Schmittgen TD. Analysis of relative gene expression data using real-time quantitative PCR and the 2(-Delta Delta C(T)) method. Methods. 2001;25(4):402–408.
- Han J, Chen Q. MiR-16 modulate temozolomide resistance by regulating BCL-2 in human glioma cells. Int J Clin Exp Pathol. 2015;8:12698–12707.
- Shou J, Gao H, Cheng S, et al. LncRNA HOXA-AS2 promotes glioblastoma carcinogenesis by targeting miR-885-5p/RBBP4 axis. Cancer Cell Int. 2021;21(1):39.
- Wang H, Zhu Y, Zhao M, et al. miRNA-29c suppresses lung cancer cell adhesion to extracellular matrix and metastasis by targeting integrin β1 and matrix metalloproteinase2 (MMP2). PLoS One. 2013;8(8):e70192.
- Li Q, Wu Q, Li Z, et al. LncRNA LINC00319 is associated with tumorigenesis and poor prognosis in glioma. Eur J Pharmacol. 2019;861:172556.
- Chen L, Zhu Q, Lu L, et al. MiR-132 inhibits migration and invasion and increases chemosensitivity of cisplatin-resistant oral squamous cell carcinoma cells via targeting TGF-β1. Bioengineered. 2020;11(1):91–102.
- Liu H, Song M, Sun X, et al. T-box transcription factor TBX1, targeted by microRNA-6727-5p, inhibits cell growth and enhances cisplatin chemosensitivity of cervical cancer cells through AKT and MAPK pathways. Bioengineered. 2021;12(1):565–577.
- Hamano R, Miyata H, Yamasaki M, et al. Overexpression of miR-200c induces chemoresistance in esophageal cancers mediated through activation of the Akt signaling pathway. Clin Cancer Res. 2011;17(9):3029–3038.
- Yang L, Li N, Yan Z, et al. MiR-29a-mediated cd133 expression contributes to cisplatin resistance in CD133(+) glioblastoma stem cells. J Mol Neurosci. 2018;66(3):369–377.
- Guo Y, Yan K, Fang J, et al. Let-7b expression determines response to chemotherapy through the regulation of cyclin D1 in glioblastoma. J Exp Clin Cancer Res. 2013;32(1):41.
- Yin J, Shen X, Li M, et al. miR-329 regulates the sensitivity of 5-FU in chemotherapy of colorectal cancer by targeting E2F1. Oncol Lett. 2018;16:3587–3592.
- Cataldo A, Romero-Cordoba S, Plantamura I, et al. MiR-302b as a combinatorial therapeutic approach to improve cisplatin chemotherapy efficacy in human triple-negative breast cancer. Cancers (Basel). 2020;12(8):2261.
- Shu HK, Julin CM, Furman F, et al. Overexpression of E2F1 in glioma-derived cell lines induces a p53-independent apoptosis that is further enhanced by ionizing radiation. Neuro Oncol. 2000;2(1):16–21.
- Gomez-Manzano C, Lemoine MG, Hu M, et al. Adenovirally-mediated transfer of E2F-1 potentiates chemosensitivity of human glioma cells to temozolomide and BCNU. Int J Oncol. 2001;19:359–365.