
ABSTRACT
Acute myocardial infarction (AMI) tends to cause severe heart failure and the population suffering from AMI gradually become younger. This study aims to determine the key genes associated with AMI, ferroptosis and hypoxia that could serve as novel biomarkers for AMI. There were 522 up-regulated genes and 119 down-regulated genes in GSE4648. Based on the expression of ferroptosis-related genes (FRGs) and hypoxia-related genes, the ferroptosis Z-score and the hypoxia Z-score calculated by ssGSEA were significantly higher in the infarcted area of AMI mice than in the control group, and there was a positive correlation between ferroptosis and hypoxia Z-score. 6 modules were obtained by Weighted Gene Co-Expression Network Analysis (WGCNA), and 2 key modules and 66 key genes were screened out. Genes in the key modules were found mainly related to ERK1 and ERK2 cascade, TNF signaling pathway, and MAPK signaling pathway through Gene Ontology (GO) and Kyoto Encyclopedia of Genes and Genomes (KEGG) pathway enrichment analysis. Protein-protein interaction (PPI) network analysis was performed on the key genes and 10 hub genes (Atf3, Ptgs2, Cxcl1, Socs3, Hspa1b, Selp, Cxcl2, Il1b, Myd88, and S100a8) were obtained using STRING and Cytohubba. The expression of 9 hub genes except Cxcl1 was consistent in GSE4648 and GSE775. The transcription factors (TFs)-hub genes interaction network was constructed and 48 TFs were obtained using TRRUST. Finally, it was verified through the animal experiment that these hub genes were up-regulated in AMI mice myocardial tissues. This study offers new ideas for the diagnosis and treatment of AMI.
1. Introduction
Acute myocardial infarction (AMI) is a clinical syndrome resulting from coronary artery lesions. Atherosclerotic plaque rupture occurs within the artery. When acute occlusion of arteries occurs, the blood flow is blocked, and normal blood supply within the heart is impossible. The corresponding myocardium suffers from severe ischemia and hypoxia, leading to myocardial damage and death [Citation1]. The adverse ventricular remodeling after the acute phase reduces cardiac function, leads to heart failure and increases mortality [Citation2]. Myocardial hypertrophy and interstitial fibrosis deposition in the non-infarcted area eventually contribute to left ventricular remodeling and heart failure [Citation3].
Ferroptosis is a new form of cell death, and it is mainly related to the content of circulating iron, which is manifested in the imbalance of intracellular redox reaction mediated by excessive iron, the accumulation of lipid peroxides and the production of reactive oxygen species (ROS). The pathophysiological processes of many diseases are closely associated with ferroptosis. Antioxidants and iron chelators can significantly inhibit this biological process. More and more researches have proven that ferroptosis plays a crucial role in myocardial infarction (MI) [Citation4–7]. The in-depth exploration of ferroptosis is helpful to accurately regulate the development of MI, and supply new ideas for the clinical prevention and treatment of the disease.
Belonging to R package, the weighted gene co-expression network analysis (WGCNA) is an algorithm to excavate module information from gene chip expression data [Citation8]. In the gene co-expression network, if the expression patterns of various genes in the same sample are similar, these genes are considered to be in the same co-expression network or the same module. The common relationship is determined by the correlation coefficient between genes.
Ferroptosis and hypoxia exert crucial roles in AMI, and this study aims to determine the key genes associated with AMI, ferroptosis and hypoxia that could serve as novel biomarkers or potential therapeutic targets for AMI. In this research, the expression profile data of GSE4648 were analyzed using WGCNA in order to study the co-expression gene network relationship during AMI, to identify the key modules and key genes related to AMI, ferroptosis and hypoxia, and to reveal the importance of these modules in AMI. The transcription factors (TFs) that regulated the transcription of hub genes were also studied. This study provides a research basis for exploring the potential regulatory targets and possible regulatory mechanisms of AMI, and offers new ideas for the treatment of the disease.
2. Materials and methods
2.1. Data collection and preprocessing
GSE4648 and GSE775 were downloaded from the Gene Expression Omnibus (GEO) database (http://www.ncbi.nlm.nih.gov/geo/). The expression data of 36 samples were obtained from GSE4648, containing infarcted tissue (IF) and surviving left ventricular free wall (FW) from AMI mice and the left ventricular (LV) of sham surgery mice at 6 time points (15 min, 1 h, 4 h, 12 h, 24 h, 48 h post-AMI) [Citation9]. GSE775 includes the expression data of 36 mice myocardial tissues at 6 time points (1 h, 4 h, 24 h, 48 h,1 w, 8 w post-AMI) [Citation10]. The probe was annotated using the GPL81 file corresponding to the datasets. Because several probes were corresponding to the same gene, the mean was used to indicate the expression of the gene.
2.2. Differentially expressed genes (DEGs) identification
GSE4648 was performed with DEGs analysis using the limma package [Citation11]. We analyzed the DEGs in 7 groups (IF_15 min VS LV_15 min, IF_1 h VS LV_1 h, IF_4 h VS LV_4 h, IF_12 h VS LV_12 h, IF_24 h VS LV_24 h, IF_48 h VS LV_48 h, and IF_48 h VS IF_15 min), with |logFC| > 1 and padj < 0.05.
2.3. Gene set variation analysis (GSVA) of ferroptosis and hypoxia
There were 259 ferroptosis-related genes (FRGs) from FerrDb (http://www.zhounan.org/ferrdb/), and 357 hypoxia-related genes from MsigDb (http://www.gsea-msigdb.org/gsea/msigdb/index.jsp). The samples in GSE4648 were analyzed by ssGSEA using GSVA, and the ferroptosis Z-score and hypoxia Z-score of each sample were calculated [Citation12].
2.4. WGCNA of GSE4648
WGCNA was carried out according to the method in the literature [Citation13]. WGCNA was applied to analyze differential genes in GSE4648, and the co-expression modules and key genes related to AMI, ferroptosis and hypoxia were found. We chose R2 = 0.9 and the soft-threshold β = 18. Subsequently, the adjacency matrix was transformed into a topological overlap matrix (TOM). Modules were identified with hierarchical clustering (minModuleSize = 30). The eigengene was calculated, and the modules were hierarchically clustered. The module eigengene (ME) and the module membership (MM) were used to distinguish the vital modules associated with ferroptosis and hypoxia. The relationship between the clinical data (ferroptosis Z-score, hypoxia Z-score, tissue and time) and the modules was calculated to obtain vital modules. ME shows the first principal component in the module, and describes the expression pattern of the module. MM stands for the relationship between genes and module eigengenes, which refers to the reliability of genes being part of modules. Genes in the key module were studied with functional enrichment analysis (Gene Ontology (GO) and Kyoto Encyclopedia of Genes and Genomes (KEGG) pathway) using clusterProfiler [Citation14].
2.5. Protein-protein interaction (PPI) network construction and analysis
The key genes identified by WGCNA were analyzed with PPI network using STRING database, and 10 hub genes were screened out by cytohubba (a cytoscape plugin) [Citation15]. The expression of the 10 genes in GSE4648 was analyzed, and also verified in GSE775.
2.6. Prediction of TFs-hub genes interaction
According to the research [Citation16], we searched the TFs of the 10 hub genes using TRRUST version 2 (https://www.grnpedia.org/trrust/), and applied cytoscape to visualize TFs-hub genes interaction network.
2.7. The construction of AMI mice model
All experiments were performed on female C57BL/6 J mice (24 weeks of age). Surgical AMI was conducted as previously described [Citation17]. The mice in the control group underwent the same protocol without ligation of the coronary artery. All of the animal procedures were approved by The Animal Experiment Welfare Ethics Committee (ZJCLA-IACUC-20030016). Triphenyl tetrazolium chloride (TTC) staining was used to evaluate the infarct size [Citation18].
2.8. qRT-PCR
Based on the manufacturer’s protocol, total RNA was isolated from AMI mice myocardial tissue 48 h after AMI using TRIzol® reagent (Invitrogen, USA) and reverse transcribed to cDNA with PrimeScript™ 1st Strand cDNA Synthesis kit (Takara, China). RT-PCR was carried out with TaKaRa Ex Taq® (Takara, China). The primers for RT-PCR were showed in . The relative mRNA expression of hub genes was normalized to β-actin with the method of 2−ΔΔCt.
Table 1. The primers of hub genes for RT-PCR
2.9. Western blot
The protein was extracted and quantified by BCA colorimetry. After SDS-PAGE separation, the protein was transferred to PVDF by wet-spinning. 5% skim milk was used to block the membrane at room temperature. The membrane was first incubated in the following primary antibody (Invitrogen, USA) at 4°C overnight, and then with the corresponding HRP labeled secondary antibody (1:5000) at room temperature. The photos were collected by Bio-Rad camera system. The protein expression was detected, with β-actin defined as the internal reference. The primary antibodies used in western blot were as follows: Atf3 (#PA5-106,898), Ptgs2 (#PA1-9032), Socs3 (#37-7200), Hspa1b (#PA5-97,846), Selp (#PA5-88,593), Cxcl2 (#MA5-23,737), Il1b (#M421B), Myd88 (#PA5-19,919), and S100a8 (#PA5-47,439).
2.10. Statistics analysis
Statistics analysis were performed with GraphPad Prism 8.0 software using Student’s paired t‐test when comparing the two groups. P < 0.05 was considered statistically significant.
3. Results
This study aims to determine the key genes associated with AMI, ferroptosis and hypoxia. Based on the expression of FRGs and hypoxia-related genes, the ferroptosis Z-score and the hypoxia Z-score were calculated by ssGSEA. The key modules and key genes were obtained through WGCNA. GO and KEGG pathway enrichment analysis were performed on the genes in the key modules, and the key genes were used to construct a PPI network. The TFs-hub genes interaction network was built and the expression of hub genes was validated in the GEO datasets and the AMI mice.
3.1. Identification of DEGs in GSE4648
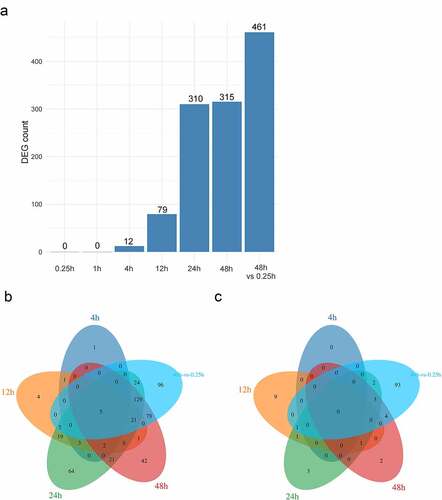
There were 0, 0, 12, 79, 310, 315, and 461 DEGs respectively in 7 groups (IF_15 min VS LV_15 min, IF_1 h VS LV_1 h, IF_4 h VS LV_4 h, IF_12 h VS LV_12 h, IF_24 h VS LV_24 h, IF_48 h VS LV_48 h, and IF_48 h VS IF_15 min) ()). The up-regulated genes and down-regulated genes were analyzed using the venn diagram. There were 641 DEGs in total, including 522 genes being up-regulated ()), and 119 genes being down-regulated ()).
Figure 1. Identification of DEGs. (a). The number of DEGs in different groups; (b). The venn picture showing up-regulated genes; (c). The venn picture displaying down-regulated genes
3.2. ssGSEA of ferroptosis and hypoxia
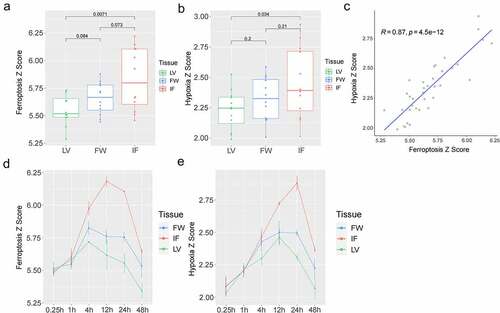
Based on the expression of FRGs and hypoxia-related genes, ssGSEA was used to calculate the ferroptosis and hypoxia Z-scores of each sample. The results suggested that the ferroptosis Z-score ()) and the hypoxia Z-score ()) were significantly higher in the IF of AMI mice than in the LV of the control mice. No significant difference existed between the IF or LV groups and the FW group, with a mean value of IF > FW > LV. A significant positive correlation between ferroptosis Z-score and hypoxia Z-score was also found (R = 0.87, P = 4.5e-12) ()). Temporally, the ferroptosis Z-score in IF group increased from 1 h, peaked at 12 h, and began to decline after 24 h ()), while the hypoxia Z-score began to increase from 1 h, reached the peak at 24 h, and then declined ()). The above results indicated that myocardial infarction was markedly correlated with ferroptosis and hypoxia, and there was a certain relationship between ferroptosis and hypoxia.
Figure 2. Analysis of the ferroptosis Z-score and the hypoxia Z-score. (a). The ferroptosis Z-score in LV, FW, and IF group; (b). The hypoxia Z-score in LV, FW, and IF groups; (c). The correlation analysis between ferroptosis Z-score and hypoxia Z-score; (d). The relationship between ferroptosis Z-score and time in the LV, FW, and IF groups; (e). The relationship between hypoxia Z-score and time in the LV, FW, and IF groups
3.3. WGCNA of GSE4648
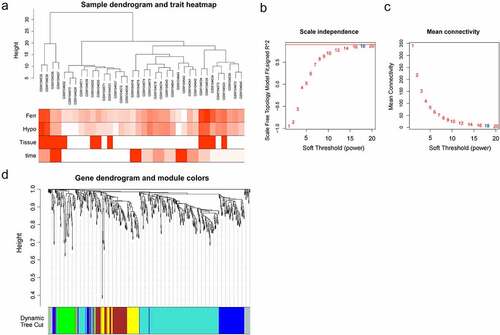
The co-expression modules obtained by WGCNA included a group of genes frequently having high co-expression levels and high topological overlap similarity. There was a DEGs expression matrix of GSE4648 (641 DEGs). The Pearson’s correlation coefficient was applied to cluster the samples, and a sample clustering tree was obtained in ). We chose the soft-threshold 18 (based on the scale-free topology criterion with R2 = 0.9) in order to get a scale-free network. The adjacency matrix was converted into a TOM matrix ( and (c)), which was used to show the similarity between nodes by considering the weighted correlation. Finally, 6 modules were obtained through average hierarchical clustering and dynamic tree clipping ()).
Figure 3. The co-expression modules analysis. (a). Clustering dendrogram of 36 samples; (b). The relationship between the scale-free fit index and various soft-thresholding powers; (c). The relationship between the mean connectivity and various soft-thresholding powers; (d). Clustering dendrogram of genes, various colors represent different modules
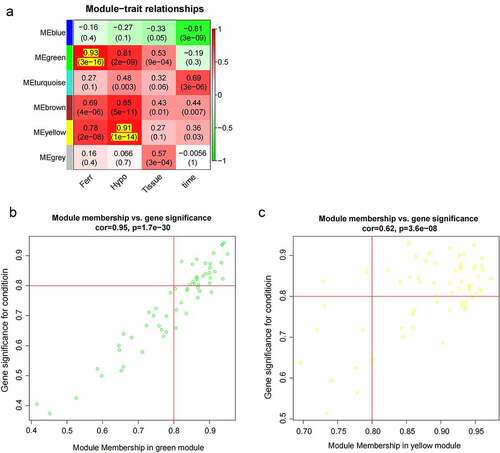
In order to pick out important clinical modules, the relationship between the modules and the clinical data was studied. Among the 6 modules, the green module was highly associated with ferroptosis score (cor = 0.93 and P = 3e-16), the yellow module was highly related to hypoxia score (cor = 0.91 and P = 1e-14), and they were both positively related to IF. Thus, the green module and the yellow module were selected as clinically important modules for further analysis ()). Significant correlation existed in the MM and gene significance (GS) of the green and yellow modules ()(b) and (c). Key genes were screened out with geneTraitSignificance >0.8 and geneModuleMembership >0.8, and 26 and 40 key genes were found in the two modules, respectively.
Figure 4. The clinically important modules analysis. (a). The relationship of four traits and six modules; (b). The scatterplot describing the relationship between MM and GS in green module; (c). The scatterplot describing the relationship between MM and GS in the yellow module
3.4. Gene functional enrichment analysis of two clinically important modules
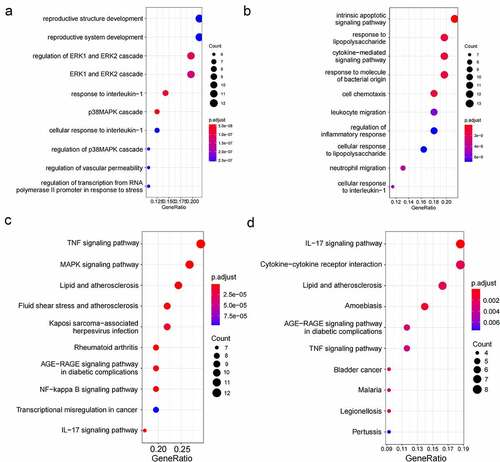
59 DEGs in the green module and 65 DEGs in the yellow module were studied through GO and KEGG enrichment analysis. The results of GO enrichment analysis displayed that genes in the green module were mainly concentrated in ERK1 and ERK2 cascades, p38 MAPK cascade, and regulation of transcription from RNA polymerase II promoter in response to stress ()), while genes in the yellow module were enriched in cytokine-mediated signaling pathway, regulation of inflammatory response, and cellular response to interleukin-1 ()). KEGG enrichment analysis results indicated that genes in the green module were related to TNF signaling pathway, and MAPK signaling pathway ()), whereas genes in the yellow module were associated with pathways, such as cytokine-cytokine receptor interaction and IL-17 signaling pathway ()).
Figure 5. The gene functional enrichment analysis of two clinically important modules. (a). GO enrichment in the green module; (b). GO enrichment in the yellow module; (c). KEGG enrichment in the green module; (d). KEGG enrichment in the yellow module
3.5. The PPI analysis of key genes
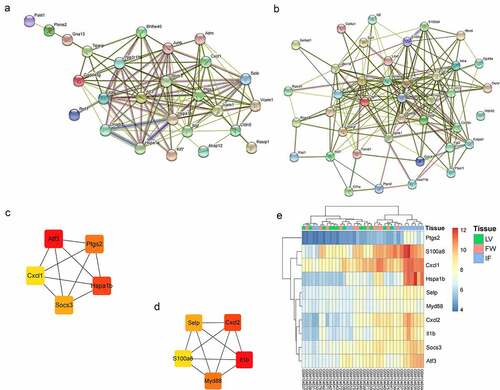
The key genes in the green and yellow modules were analyzed with PPI network. There were 118 interactions among 26 key genes in the green module, with an average of 9 neighbors per node ()), and 197 interactions among 39 of 40 key genes in the yellow module, with an average of 10 neighbors per node ()). 5 hub genes were found in two PPI networks using cytohubba ()(c) and (d). The expression level of the 10 hub genes in GSE4648 was shown in the ). The results indicated that the expression levels of these hub genes were elevated in MI areas.
Figure 6. The PPI analysis of key genes. (a). The PPI network of green module; (b). The PPI network of yellow module; (c). Top 5 hub genes in the green module; (d). Top 5 hub genes in the yellow module; (e). The expression of 10 hub genes in GSE4648
3.6. Validation of hub genes
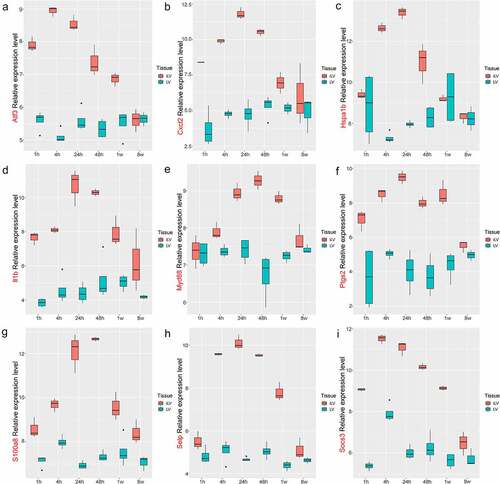
GSE775 was obtained from the GEO database, including the infarcted left ventricles (iLV) from AMI mice and the left ventricles (LV) from the control group, with three reduplicates per sample. The expression level of the 10 hub genes in MI was examined with the GSE775 (). Cxcl1 was not detected in the GSE775, while the expression levels of other 9 genes were elevated, consistent with their expressions in GSE4648.
Figure 7. The expression level of hub genes in GSE775. (a). Atf3; (b), Cxcl2; (c). Hspa1b; (d). Il1b; (e). Myd88; (f). Ptgs2; (g). S100a8; (h). Selp; (i). Socs3.
3.7. Prediction of TFs-hub genes interaction
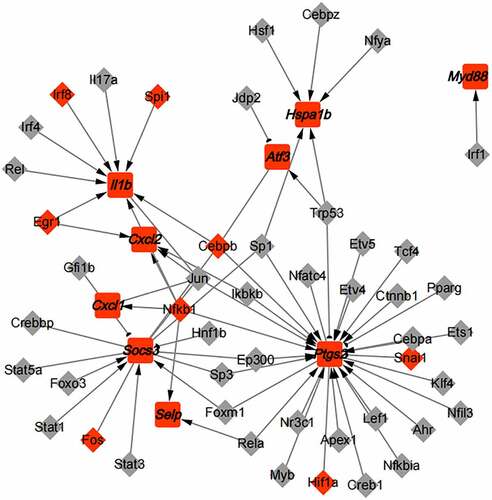
TRRUST database was applied to predict TFs-hub genes interaction. There were 48 TFs, 9 hub genes, and 69 associations (). It was found that Trp53 inhibited the expression of Ptgs2 and activated the expression of Hspa1b and Atf3; Foxo3 activated the transcription of Socs3; Irf1 promoted the expression of Myd88; Irf8, Spi1, Egr1, and Cebpb notably activated the Il1b transcription, and were significantly up-regulated in AMI; Egr1 activated the transcription of Cxcl2; and Nfkb1 activated the expression of Cxcl1 and Selp.
Figure 8. TF-hub genes interaction network. Diamonds represent TFs, squares represent hub genes, red indicated up-regulation of gene expression, and gray indicated no significant difference in the expression
3.8. Hub genes were up-regulated in AMI mice myocardial tissue
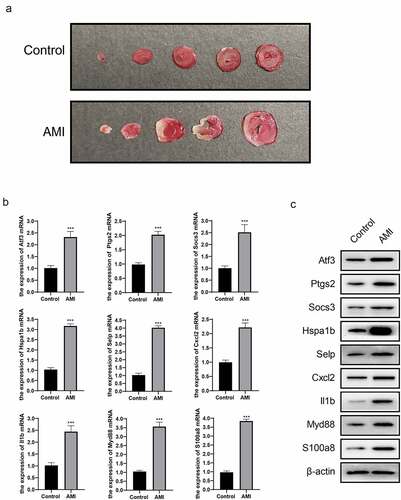
We built an AMI mouse model, and the model was shown successfully constructed by TTC staining ()). Compared with the control group, the relative mRNA expression levels of Atf3, Ptgs2, Socs3, Hspa1b, Selp, Cxcl2, Il1b, Myd88, and S100a8 in AMI mice myocardial tissue were significantly up-regulated ()); and at the same time, the protein expression level also increased significantly ()). The results were consistent with the expression data of GSE4648 and GSE775.
Figure 9. Expression of hub genes in AMI mice myocardial tissue. (a). TTC staining (white is the infarct area); (b). Relative expression level of the hub genes mRNA; (c). Protein expression levels of hub genes
4. Discussion
AMI is the myocardial necrosis resulting from acute and constant ischemia and hypoxia of coronary artery, and can often be life-threatening. After massive myocardial infarction, it is accompanied by ventricular remodeling, leading to severe chronic heart failure. In recent years, the incidence and mortality of AMI have been increasing year after year with a trend toward younger age [Citation19]. In this study, a bioinformatics analysis of GSE4648 database was carried out, and a total of 641 DEGs were found, including 522 up-regulated genes and 119 down-regulated genes ().
It is known that the myocardium is in a hypoxia environment when AMI occurs. Meanwhile, ferroptosis plays a vital role in MI. Baba et al. established the ischemia-reperfusion injury (I/R) mice model and found that 30 min after I/R injury, ferritin accumulated along the myocardial scar area, and this iron accumulation induced the death of cardiomyocytes. This process may be mainly regulated by TfR1 [Citation20]. Gao et al. revealed that in the absence of amino acids, transferrin and glutamine can induce ferroptosis of cells, and that ferroptosis inhibitor (ferrostatin-1, Fer-1) can effectively alleviate the heart I/R injury in an I/R mouse model [Citation5]. Some researchers have proved that the USP7/P53/TfR1 pathway has a key role in ferroptosis induced by I/R [Citation21]. Many studies have found that ferroptosis inhibitors can significantly reduce the degree of I/R injury and improve cardiac function [Citation6,Citation7,Citation22,Citation23]. Based on the expression of FRGs and hypoxia-related genes, the ferroptosis Z-scores and the hypoxia Z-scores of each sample were calculated as clinical characteristics. The ferroptosis Z-score ()) and the hypoxia Z-score ()) were evidently higher in AMI mice than those in the control group.
In this study, 6 modules were obtained using WGCNA, and the green and yellow modules were selected as clinically important modules. The green module was highly related to the ferroptosis score (cor = 0.93 and P = 3e-16) and the yellow module was significantly associated with the hypoxia score (cor = 0.91 and P= 1e-14) ()). Also, 66 key genes related to ferroptosis, hypoxia and AMI were screened out.
124 DEGs in the green and yellow modules were performed with functional enrichment analysis (GO and KEGG). GO enrichment analysis showed that genes were enriched in ERK1 and ERK2 cascade, p38 MAPK cascade, regulation of transcription from RNA polymerase II promoter in response to stress, cytokine-mediated signaling pathway, regulation of inflammatory response, and cellular response to interleukin-1 ()(a) and (b). KEGG enrichment analysis suggested that genes were bound up with TNF signaling pathway, MAPK signaling pathway, IL-17 signaling pathway, and Cytokine-cytokine receptor interaction ()(c) and (d). It is known that these pathways have crucial roles in the development of AMI. miR-34a could influence myocardial apoptosis through the ERK1/2 pathway [Citation24]. The down-regulation of lncRNA MALAT1 could significantly improve the cardiac function by inhibiting the ERK/MAPK pathway [Citation25].
PPI analysis was performed on 26 key genes in the green module and 40 key genes in the yellow module respectively. Then, 5 hub genes were selected from each module (), and they were Atf3, Ptgs2, Cxcl1, Socs3, Hspa1b and Selp, Cxcl2, Il1b, Myd88, S100a8. In the MI area, the expression of 10 hub genes was up-regulated ()). Next, the hub genes were validated in GSE775, and the expression of these genes except Cxcl1 was found consistent with the GSE4648 database (). Meantime, we successfully built an AMI mouse model and found that the expression of the 9 hub genes was up-regulated in AMI mice myocardial tissues. It has been reported that SOCS3 gene could be used as a biomarker to predict the risk of AMI [Citation26]. CXCL2 has been shown to be involved in the pathogenesis of cardiovascular disease [Citation27]. AMI could be prevented via the inhibition of galectin-3/TLR4/MyD88/NF-кB inflammatory signaling [Citation28]. The ruin of S100A8/A9 signaling or the downstream factors (e.g., interleukin-1β) in neutrophils restrains granulopoiesis and may ameliorate heart function in patients with acute coronary syndrome [Citation29]. ATF3 is a familiar stress sensor which can promote ferroptosis induced by erastin [Citation30]. PTGS2 was reported as a ferroptotic marker [Citation31]. The TFs-hub genes network was constructed and a total of 48 TFs were found (). Among them, Foxo3 loss in cardiomyocytes results in a significant increase in the infarct area [Citation32], and EGR1 could induce myocardial damage after AMI [Citation33].
In this research, the key modules and key genes related to AMI, ferroptosis and hypoxia were identified, and the TFs were also studied. Therefore, this study offers new ideas for the disease prevention, diagnosis and treatment of AMI. However, further researches and verifications are still needed.
5. Conclusion
Through WGCNA, the key modules and key genes related to AMI, ferroptosis and hypoxia were identified; the importance of these modules in AMI were further revealed; 9 hub genes (Atf3, Ptgs2, Socs3, Hspa1b, Selp, Cxcl2, Il1b, Myd88, and S100a8) were screened out; and the regulation of TFs on the transcription of hub genes were also investigated. This study definitely provides a research basis for exploring the potential regulatory targets and possible regulatory mechanisms of AMI, and offers new ideas for the treatment of AMI.
Research highlights
1. 522 up-regulated genes and 119 down-regulated genes were in GSE4648.
2. There was a notable positive correlation between ferroptosis Z-score and hypoxia Z-score.
3. There were 2 key modules and 66 key genes related to AMI, ferroptosis and hypoxia, and 10 hub genes were screened out.
4. There was a TFs-hub genes interaction network including 48 TFs, 9 hub genes and 69 associations.
5. The hub genes were validated in the GSE775 and the AMI mice myocardial tissues.
Availability of data and material
The datasets used and/or analyzed during the current study are available from the corresponding author on reasonable request.
Ethics approval
The animal use protocol has been reviewed and approved by the Institutional Animal Care and Use Committee (IACUC), ZJCLA (ZJCLA-IACUC-20030016).
Author contributions
Kai Liu: Data curation, Writing-Original draft preparation.
Shaoxi Chen: Visualization, Investigation.
Ruoyi Lu: Writing-Reviewing and Editing, Conceptualization, Methodology, Supervision.
Disclosure statement
The authors declare that they have no conflict of interest.
Additional information
Funding
References
- Herrmann J. Peri-procedural myocardial injury: 2005 update. Eur Heart J. 2005;26:2493–2519.
- Nian M, Lee P, Khaper N, et al. Inflammatory cytokines and postmyocardial infarction remodeling. Circ Res. 2004;94:1543–1553.
- Sutton MG, Sharpe N. Left ventricular remodeling after myocardial infarction: pathophysiology and therapy. Circulation. 2000;101:2981–2988.
- Kobayashi M, Suhara T, Baba Y, et al. Pathological roles of iron in cardiovascular disease. Curr Drug Targets. 2018;19:1068–1076.
- Gao M, Monian P, Quadri N, et al. Glutaminolysis and transferrin regulate ferroptosis. Mol Cell. 2015;59:298–308.
- Li W, Feng G, Gauthier JM, et al. Ferroptotic cell death and TLR4/Trif signaling initiate neutrophil recruitment after heart transplantation. J Clin Invest. 2019;129:2293–2304.
- Li W, Li W, Leng Y, et al. Ferroptosis is involved in diabetes myocardial ischemia/reperfusion injury through endoplasmic reticulum stress. DNA Cell Biol. 2020;39:210–225.
- Langfelder P, Horvath S. WGCNA: an R package for weighted correlation network analysis. BMC Bioinformatics. 2008;9:559.
- Harpster MH, Bandyopadhyay S, Thomas DP, et al. Earliest changes in the left ventricular transcriptome postmyocardial infarction. Mamm Genome. 2006;17:701–715.
- Tarnavski O, McMullen JR, Schinke M, et al. Mouse cardiac surgery: comprehensive techniques for the generation of mouse models of human diseases and their application for genomic studies. Physiol Genomics. 2004;16:349–360.
- Ritchie ME, Phipson B, Wu D, et al. limma powers differential expression analyses for RNA-sequencing and microarray studies. Nucleic Acids Res. 2015;43:e47.
- Hanzelmann S, Castelo R, Guinney J. GSVA: gene set variation analysis for microarray and RNA-seq data. BMC Bioinformatics. 2013;14:7.
- Tian Z, He W, Tang J, et al. Identification of important modules and biomarkers in breast cancer based on WGCNA. Onco Targets Ther. 2020;13:6805–6817.
- Yu G, Wang LG, Han Y, et al. clusterProfiler: an R package for comparing biological themes among gene clusters. OMICS. 2012;16:284–287.
- Chin CH, Chen SH, Wu HH, et al. cytoHubba: identifying hub objects and sub-networks from complex interactome. BMC Syst Biol. 2014;8(Suppl 4):S11.
- Hao M, Liu W, Ding C, et al. Identification of hub genes and small molecule therapeutic drugs related to breast cancer with comprehensive bioinformatics analysis. PeerJ. 2020;8:e9946.
- Ruparelia N, Godec J, Lee R, et al. Acute myocardial infarction activates distinct inflammation and proliferation pathways in circulating monocytes, prior to recruitment, and identified through conserved transcriptional responses in mice and humans. Eur Heart J. 2015;36:1923–1934.
- Zhang T, Yang WX, Wang YL, et al. Electroacupuncture preconditioning attenuates acute myocardial ischemia injury through inhibiting NLRP3 inflammasome activation in mice. Life Sci. 2020;248:117451.
- Chen DQ, Kong XS, Shen XB, et al. Identification of differentially expressed genes and signaling pathways in acute myocardial infarction based on integrated bioinformatics analysis. Cardiovasc Ther. 2019;2019:8490707.
- Baba Y, Higa JK, Shimada BK, et al. Protective effects of the mechanistic target of rapamycin against excess iron and ferroptosis in cardiomyocytes. Am J Physiol Heart Circ Physiol. 2018;314:H659–H68.
- Tang LJ, Zhou YJ, Xiong XM, et al. Ubiquitin-specific protease 7 promotes ferroptosis via activation of the p53/TfR1 pathway in the rat hearts after ischemia/reperfusion. Free Radic Biol Med. 2021;162:339–352.
- Feng Y, Madungwe NB, Imam Aliagan AD, et al. Liproxstatin-1 protects the mouse myocardium against ischemia/reperfusion injury by decreasing VDAC1 levels and restoring GPX4 levels. Biochem Biophys Res Commun. 2019;520:606–611.
- Fang X, Wang H, Han D, et al. Ferroptosis as a target for protection against cardiomyopathy. Proc Natl Acad Sci U S A. 2019;116:2672–2680.
- Bian WS, Tian FH, Jiang LH, et al. Influence of miR-34a on myocardial apoptosis in rats with acute myocardial infarction through the ERK1/2 pathway. Eur Rev Med Pharmacol Sci. 2019;23:3034–3041.
- Fan YZ, Huang H, Wang S, et al. Effect of lncRNA MALAT1 on rats with myocardial infarction through regulating ERK/MAPK signaling pathway. Eur Rev Med Pharmacol Sci. 2019;23:9041–9049.
- Meng H, Wang X, Ruan J, et al. High expression levels of the SOCS3 gene are associated with acute myocardial infarction. Genet Test Mol Biomarkers. 2020;24:443–450.
- Guo LY, Yang F, Peng LJ, et al. CXCL2, a new critical factor and therapeutic target for cardiovascular diseases. Clin Exp Hypertens. 2020;42:428–437.
- Sun JH, Yang HX, Yao TT, et al. Gentianella acuta prevents acute myocardial infarction induced by isoproterenol in rats via inhibition of galectin-3/TLR4/MyD88/NF-small ka, CyrillicB inflammatory signalling. Inflammopharmacology. 2021;29:205–219.
- Sreejit G, Abdel-Latif A, Athmanathan B, et al. Neutrophil-derived S100A8/A9 amplify granulopoiesis after myocardial infarction. Circulation. 2020;141:1080–1094.
- Wang L, Liu Y, Du T, et al. ATF3 promotes erastin-induced ferroptosis by suppressing system Xc(.). Cell Death Differ. 2020;27:662–675.
- Li N, Wang W, Zhou H, et al. Ferritinophagy-mediated ferroptosis is involved in sepsis-induced cardiac injury. Free Radic Biol Med. 2020;160:303–318.
- Sengupta A, Molkentin JD, Paik JH, et al. FoxO transcription factors promote cardiomyocyte survival upon induction of oxidative stress. J Biol Chem. 2011;286:7468–7478.
- Pan J, Alimujiang M, Chen Q, et al. Exosomes derived from miR-146a-modified adipose-derived stem cells attenuate acute myocardial infarction-induced myocardial damage via downregulation of early growth response factor 1. J Cell Biochem. 2019;120:4433–4443.