
 ?Mathematical formulae have been encoded as MathML and are displayed in this HTML version using MathJax in order to improve their display. Uncheck the box to turn MathJax off. This feature requires Javascript. Click on a formula to zoom.
ABSTRACT
Abnormal levels of autophagy have been implicated in the pathogenesis of multiple diseases, including cancer. However, little is known about the role of autophagy-related genes (ARGs) in low-grade gliomas (LGG). Accordingly, the aims of this study were to assess the prognostic values of ARGs and to establish a genetic signature for LGG prognosis. Expression profile data from patients with and without primary LGG were obtained from The Cancer Genome Atlas (TCGA) and Genome Tissue Expression databases, respectively, and consensus clustering was used to identify clusters of patients with distinct prognoses. Nineteen differentially expressed ARGs were selected with threshold values of FDR < 0.05 and |log2 fold change (FC)| ≥ 2, and functional analysis revealed that these genes were associated with autophagy processes as expected. An autophagy-related signature was established using a Cox regression model of six ARGs that separated patients from TCGA training cohort into high- and low-risk groups. Univariate and multivariate Cox regression analysis indicated that the signature-based risk score was an independent prognostic factor. The signature was successfully validated using the TCGA testing, TCGA entire, and Chinese Glioma Genome Atlas cohorts. Stratified analyses demonstrated that the signature was associated with clinical features and prognosis, and gene set enrichment analysis revealed that autophagy- and cancer-related pathways were more enriched in high-risk patients than in low-risk patients. The prognostic value and expression of the six signature-related genes were also investigated. Thus, the present study constructed and validated an autophagy-related prognostic signature that could optimize individualized survival prediction in LGG patients.
1. Introduction
Gliomas are the most frequent primary tumors of the central nervous system [Citation1], and low-grade gliomas (LGGs), which originate from neuroepithelial tissue [Citation2], are notably fatal in young adults and exhibit highly variable clinical manifestations that make them more difficult to diagnose [Citation3]. Furthermore, despite improvements in the treatment of LGG, disease prognosis remains unsatisfactory owing to the conditions’ complex pathogenesis [Citation4]. Owing to recent technological advances in next-generation sequencing, numerous studies have investigated and identified molecular biomarkers for LGG, including the O-6-methylguanine-DNA methyltransferase (MGMT) methylation and isocitrate dehydrogenase (IDH) mutation [Citation5,Citation6], thereby providing valuable insight into LGG pathogenesis and advancing the development of anti-cancer therapies [Citation7]. However, the most widely used markers fail to adequately account for inter-individual variation or properly assess LGG risk [Citation8,Citation9]. Consequently, there is a pressing need to elucidate the underlying mechanisms of LGG and to develop effective biomarkers that facilitate the early identification and preventative treatment of high-risk patients.
Various relationships between cancer and autophagy have been described. Autophagy (i.e., type II cell death) is a highly conserved and important biological process that maintains intracellular homeostasis by removing aggregation-prone proteins and dysfunctional organelles [Citation10] and plays a crucial role in a variety of diseases, including metabolic and cardiovascular disorders, as well as cancer [Citation11]. However, increasing evidence shows that autophagy plays a bilateral role in cancer pathogenesis, depending on tumor type and stage [Citation12,Citation13]. Indeed, in some cases, autophagy protects cells from oxidative stress and harmful genomic mutations at the level of tumor initiation, thereby suppressing tumor formation [Citation14,Citation15], but in other cases, unbalanced autophagy can promote tumor growth and cancer cell fitness under certain stress conditions [Citation16]. As such, recent studies have investigated the association between autophagy and gliomas and have reported that, in some cases, tumor growth can be inhibited by targeting autophagy [Citation17]. In fact, it is even possible that temozolomide (TMZ), which is commonly used to treat pediatric and adult gliomas, extends the duration of patient survival by stimulating autophagy [Citation18,Citation19].
Previous studies have reported that the abnormal regulation of autophagy is directly related to tumorigenesis. We reasoned that autophagy plays an important role in its LGG progression and development. The expression and prognostic significance of genome-wide expression profiles of ARGs are largely unexplored, yet, in LGG. Accordingly, the aims of the present study were to identify differentially expressed ARGs in patients with and without primary LGG, to evaluate the function of the identified genes, and to develop and evaluate a prognostic ARG signature for LGG. In the present study, we applied bioinformatic methods on LGG and normal cases from the Cancer Genome Atlas (TCGA) database and the Genotype-Tissue Expression (GTEx) database to identify 19 differentially expressed ARGs. The Gene Ontology (GO) and Kyoto Encyclopedia of Genes and Genomes (KEGG) pathways analyses were applied for function analysis. Then, we constructed a 6-gene autophagy prognostic signature, which had good prognostic value and could be used as an independent prognostic indicator within the TCGA training group. In addition, the signature was further confirmed in the Chinese Glioma Genome Atlas (CGGA) database. In conclusion, the findings might contribute to further explore the functional role of ARGs in LGG pathogenesis and to improve clinical practice.
2. Materials and methods
2.1 Data collection
RNA sequencing data for a cohort of 508 patients with primary LGG and corresponding clinical data were downloaded from The Cancer Genome Atlas (TCGA) database [Citation20], and expression data for patients without primary LGG (n = 1152) were obtained from the Genome Tissue Expression (GTEx) portal (https://www.gtexportal.org/) [Citation21]. The expression data (fragments per kilobase of exon per million fragments, FPKM) from both databases were then log2-transformed for normalization and combined using the ‘limma’ package in R, and the batch effect was processed [Citation22]. Expression data and clinical information for patients with primary LGG were also obtained from the Chinese Glioma Genome Atlas (CGGA) database (http://www.cgga.org.cn/) to be used as an external validation cohort [Citation23].
2.2 Acquisition of autophagy-related genes
A total of 232 ARGs that were either directly or indirectly related to autophagy were obtained from the Human Autophagy Database (HADb) database (http://autophagy.lu/clustering/index.html) [Citation24] and an additional 396 non-duplicate ARGs were obtained from Molecular Signatures Database v7.2 (MSigDB, https://www.gsea-msigdb.org/gsea/index.jsp.) [Citation25], resulting in a final set of 539 non-duplicate ARGs for subsequent analysis.
2.3 ARG consensus clustering
The TCGA-LGG cohort data were clustered by ARG expression profiles using the ‘ConsensusClusterPlus’ package in R to investigate whether ARG expression is associated with prognosis [Citation26], and principal component analysis (PCA) was used to better visualize gene expression patterns in diverse clusters. Overall survival (OS) analysis between different clusters was estimated using Kaplan-Meier method.
2.4 Identification and analysis of differentially expressed ARGs
Differentially expressed genes (DEGs) were identified using TCGA and GTEx data for patients with and without LGG, using the ‘limma’ package in R, and threshold values of FDR < 0.05, and |log2 fold change (FC)| ≥ 2. P-values were adjusted to control for the false discovery rate (FDR) using the Benjamini-Hochberg method [Citation27]. The intersection of the DEGs and ARGs were regarded as the significantly differential expressed ARGs and was then visualized via Venn diagrams. A protein-protein interaction (PPI) network was generated by STRING (https://string-db.org/) [Citation28] and Pearson correlation analysis was used to evaluate the relationship among different expressed ARGs.
To identify the major biological attributes of the differentially expressed ARGs, Gene Ontogeny (GO) and pathway (Kyoto Encyclopedia of Genes and Genomes, KEGG) analyses were performed, and the annotation analysis results were visualized using the ‘ggplot2’ and ‘GOplot’ packages in R [Citation29]. Statistical significance was maintained at an adjusted P-value of < 0.05.
2.5 Construction of autophagy-related prognostic signature
Strong correlations between ARG expression and OS were identified by using univariate Cox regression (P < 0.05) to analyze DEG expression data from TCGA-LGG patients. Patients with primary LGG were randomly separated into a training cohort (60%) and internal validation cohort (40%) using the ‘caret’ package [Citation30]. Subsequently, stepwise multivariate Cox regression analysis was performed to identify optimal prognostic gene sets and their coefficients in the TCGA training cohort, and the gene sets were used to construct an autophagy-related prognostic risk signature. The risk score formula was calculated as follows: Risk score = , where Coef(i) denotes the coefficient of a specific gene and x(i) indicates the expression level of the same gene. The prognostic signature was used to calculate a risk score for each patient with LGG patient, and then the patients were separated into low- and high-risk groups according to the median risk score. Survival analysis and area under the receiver operating characteristic (ROC) curve (AUC) were used to assess prediction performance of the constructed signature, and both univariate and multivariate Cox regression analyses were used to investigate whether the signature can be used as an independent prognostic factor. The performance of the ARG-based prognostic signature was further evaluated using the TCGA testing cohort, entire TCGA cohort, and CGGA cohort.
2.6 Clinical applications of the ARG signature
Relationships between clinicopathological variables of LGG patients and the predicted high- and low-risk groups were compared. To further investigate the prognostic value of the two groups in different clinical subgroups, hierarchical survival analysis was performed for age (g40 and >40 years), sex (female and male), grade (G2 and G3), IDH status (mutation and wild-type), radiotherapy (yes and no), and chemotherapy (yes and no), as indicated by information in the TCGA database. Based on this analysis, two additional clinical characteristics from the CGGA database, (1p19q codeletion status and MGMT methylation status) were added.
2.7 Gene set enrichment analysis
Gene set enrichment analysis (GSEA) was conducted using GSEA software (http://www.broadinstitute.org/gsea/index.jsp) [Citation31], with a minimum and maximum gene set size of 15 and 500, respectively, and 10,000 permutations. Statistical significance was set at P < 0.05, and FDR values of <0.25 were regarded as to be statistically significant.
2.8 Analysis of signature-related genes
OS analysis was used to determine the prognostic value of each signature gene to better investigate the function of these genes in disease progression. The Human Protein Atlas database (HPA; https://www.proteinatlas.org/) is an interactive open-access database that provides protein expression profiles for a variety of human proteins [Citation32]. Protein expression levels in tissues from patients with and without LGG were evaluated using immunohistochemistry analysis.
2.9 Quantification of ARGs in patient samples
Quantitative reverse transcription-polymerase chain reaction (qRT-PCR) was used to quantify the expression of signature-related genes in 45 tissues samples, including 17 from patients with LGG, 20 from patients with high-grade glioma (HGG), and eight from peritumoral brain regions. All samples were obtained from Shandong Provincial Hospital, which is affiliated with Shandong University (Jinan, Shandong, China), between 2018 and 2019, with written informed consent. All pathological features were reviewed by two pathologists, and none of the patients had received chemotherapy or radiotherapy before surgery. All procedures were approved by the ethics committee of our hospital.
Briefly, qRT-PCR was performed using SYBR GreenER qPCR SuperMix reagents (Invitrogen, Carlsbad, CA, USA), a Bio-Rad iCycler (Bio-Rad Laboratories, Inc., Hercules, CA, USA), and GAPDH as an endogenous control. Gene expression was calculated using the 2− ΔΔCt method, and all primers were synthesized by Guangzhou Rui Bo Biological Technology (Guangzhou, China) (). All data represent means (n = 3).
Table 1. Primer sequences used for qRT-PCR in this study
3. Results
Abnormal levels of autophagy have been implicated in the pathogenesis of a variety of diseases, including cancer. However, ARGs have rarely been analyzed in patients with LGG. We reasoned that autophagy plays an important role in its LGG progression and development. Accordingly, the aims of the present study were to identify differentially expressed ARGs in patients with and without primary LGG, to evaluate the function of the identified genes, and to develop and evaluate a prognostic ARG signature for LGG.
3.1 ARG consensus clustering
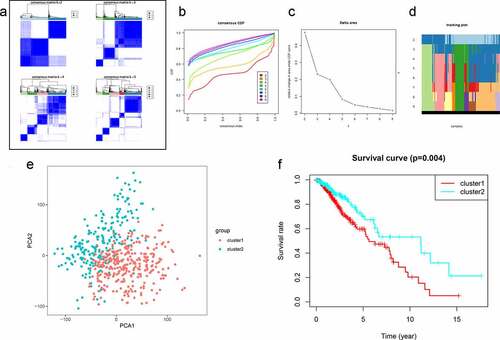
To characterize the association between autophagy and the outcome of patients with LGG, consensus clustering was performed using the expression profiles of 539 ARGs from the TCGA database. Patients could be divided into two robust clusters (Clusters 1 and 2) using k = 2 as the optimal value (), and principal component analysis of the expression profiles of Clusters 1 and 2 revealed distinct distributions (), with patients in Clusters 1 and 2 distributed in two different directors. In addition, the samples in Cluster 1 exhibited a significantly shorter OS than those in Cluster 2 (). Together, these results indicated that patient prognosis is related to autophagy and that autophagy may play a significant role in LGG occurrence and progression.
Figure 1. Clustering analysis of autophagy-related genes (ARGs) in patients with low-grade glioma (LGG). (a) Consensus clustering of LGG samples from The Cancer Genome Atlas (TCGA) dataset for k = 2 to 5. Optimal clustering is represented by k = 2. (b) Consensus clustering cumulative distribution function (CDF) for k = 2 to 9. (c) Relative change in area under CDF curve for k = 2 to 9. (d) Tracking plot for k = 2 to 9. (e) Principal component analysis of ARG mRNA expression profiles from patients with LGG. (f) Survival analysis in Clusters 1 and 2
3.2 Differentially expressed ARGs
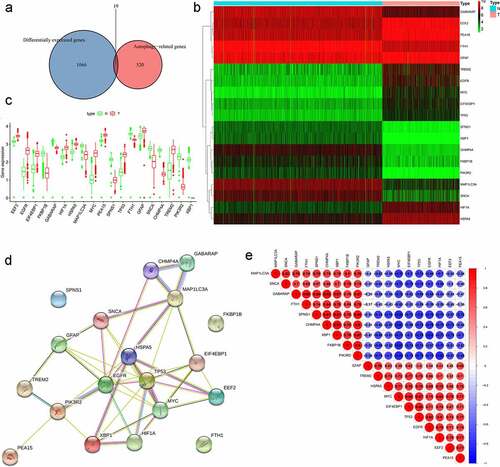
Sequence data from the TCGA and GTEx databases were compared to identify DEGs in tissues from patients with and without LGG. A total of 1085 significantly aberrantly expressed genes (345 upregulated and 740 downregulated in LGG) were identified, and the outcomes were visualized using volcano plots and heatmaps (Supplementary Figure 1). A Venn diagram was then used to determine the intersection of DEGs and ARGs. As a result, 19 differentially expressed ARGs, including 10 upregulated genes (EEF2, EGFR, EIF4EBP1, HIF1A, HSPA5, MYC, PEA15, TP53, GFAP, and TREM2) and nine downregulated genes (FKBP1B, GABARAP, MAP1LC3A, SPNS1, FTH1, SNCA, CHMP4A, PIK3R2, and XBP1) were selected for further analysis (). The expression patterns of the differentially expressed ARGs were visualized intuitively using a box plot (), and the results of the STRING analysis indicated that TP53, EGFR, and HSPA5 were the hub genes (). The correlation between these genes is presented in .
Figure 2. Differentially expressed autophagy-related genes (ARGs) in patients with and without low-grade glioma (LGG). (a) Venn diagram. (b) Heatmap. (c) Expression patterns. (d) Protein-protein interaction network. (e) Correlation
3.3 Functions of differentially expressed ARGs
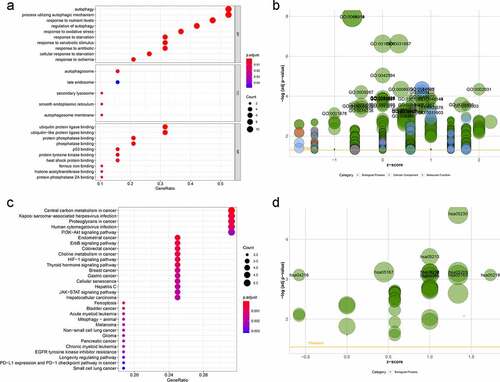
GO enrichment and KEGG pathway analyses were performed to further investigate the potential biological mechanisms and signaling pathways of the nineteen differentially expressed ARGs. As expected, the differentially expressed ARGs were enriched in several autophagy-related biological processes (e.g., autophagy, processes utilizing autophagic mechanisms, and responses to nutrient levels), cellular components (e.g., autophagosomes, late endosomes, and secondary lysosomes), and molecular function (ubiquitin protein ligase binding, ubiquitin-like protein ligase binding, and protein phosphatase binding). Bubble plots of the relationships between ARGs and GO enrichment terms are presented in . KEGG pathway analysis suggested that these differentially expressed ARGs were significantly associated with central carbon metabolism in cancer, Kaposi sarcoma-associated herpesvirus infection, and proteoglycans in cancer. Interestingly, the genes were confirmed to be involved in several cancers, including LGG and a number of cancer-related biological processes, including PI3K-Akt, ErbB, and HIF-1 signaling (). Taken together, these results indicate that the differentially expressed ARGs identified here play a critical role in the regulation of LGG malignancy.
Figure 3.. GO term and KEGG pathway enrichment of differentially expressed autophagy-related genes (ARGs) in patients with and without low-grade glioma (LGG). (a) Enriched GO terms. (b) Enriched GO terms, with the x- and y-axes representing z-score and negative log P-value, respectively. (c) Enriched KEGG terms. (d) Enriched KEGG terms, with the x- and y-axes representing z-score and negative log P-value, respectively
3.4 Construction of LGG prognostic signature
Since autophagy is clearly associated with LGG prognosis and the identified differentially expressed ARGs are likely associated with LGG malignancy, an autophagy-related prognostic signature was constructed in order to establish a more accurate process for evaluating the prognosis of patients with LGG. Univariate Cox regression analysis revealed that nine of the 19 differentially expressed ARGs were significantly associated with OS (P < 0.05; ). Of those nine genes, HSPA5, TP53, GFAP, and TREM2 were recognized as risk genes (hazard ratio, HR > 1), whereas EEF2, GABARAP, MYC, PEA15, and CHMP4A were recognized as protective genes (HR < 1).
Figure 4. Construction of autophagy-related signature for patients with low-grade glioma (LGG). (a) Univariate analysis of differentially expressed autophagy-related genes (ARGs) to identify genes correlated with overall survival. (b) Kaplan-Meier curve for high- and low-risk patients. (c) Time-dependent ROC curve for 1-, 3-, and 5-year survival rates. (d) Distribution of risk scores in patients with LGG. (e) Scatterplots of patients with LGG and different survival statuses. (f) Expression of genes in high- and low-risk patients with LGG. (g) Univariate Cox regression analysis of clinicopathological parameters (including risk score) and patient survival. (h) Multivariate Cox regression analysis of clinicopathological parameters (including risk score) and patient survival
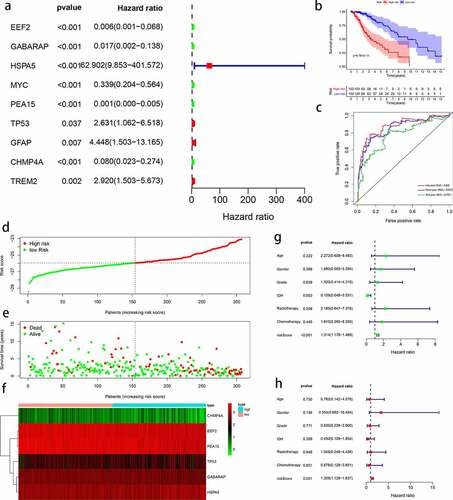
Patients with LGG in the TCGA dataset (n = 508) were randomly assigned to a training group (n = 307) or testing group (n = 201). The nine prognostic ARGs were subjected to the multivariate Cox hazards model, resulting in six target genes (EEF2, GABARAP, HSPA5, PEA15, TP53, and CHMP4A), and the six genes were used to construct a prognostic LGG signature for the TCGA training cohort. The risk score for each patient was calculated as follows: Risk score = (-expression value of EEF2 × 0.758) + (-expression value of GABARAP × 0.649) + (-expression value of HSPA5 × 0.391) + (expression value of PEA15 × 1.039) + (expression value of TP53 × 0.459) + (-expression value of CHMP4A × 1.871).
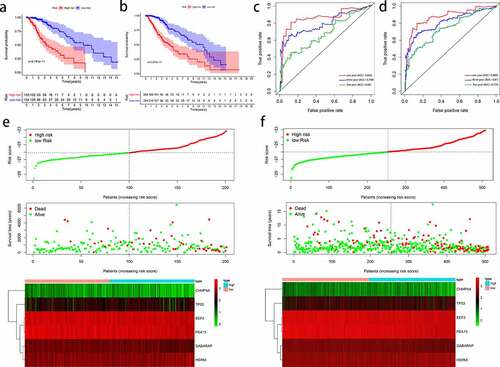
Using the median risk score, patients were stratified into high- and low-risk groups within the TCGA training cohort. The results of Kaplan-Meier analysis suggested that low-risk patients survived significantly longer than high-risk patients (). Indeed, the 1-, 3-, and 5-year OS rates were 98.5, 91.7, and 79.8%, respectively, for the low-risk group and only 89.1, 55.2, and 38.9% for the high-risk group. Moreover, the constructed signature demonstrated better prediction ability with AUC values of 0.870 (1-year), 0.835 (3-year), and 0.781 (5-year), respectively (). Patients were also ranked based on risk scores in order to analyze the survival distribution (), and the vital status of individuals with different risk scores was assessed by scatterplot (). The heatmap illustrates the expression of the six signature-related genes in LGG patients at different risk levels ().
Univariate and multivariate analyses were also conducted to evaluate whether the signature could be used as an independent risk indicator for LGG outcome. Both IDH status (HR = 0.159, P = 0.003) and signature-based risk score (HR = 1.314, P < 0.001) exhibited prognostic value (), and after multivariate analysis, the signature-based risk score (HR = 1.359, P = 0.001) remained a significant prognostic factor. Univariate and multivariate analyses identified the signature-based risk score as an independent predictive factor for patients with LGG ().
3.5 Internal validation of LGG prognostic signature
Two internal validation cohorts (TCGA testing cohort and entire TCGA cohort) were used to confirm the predictive power of the signature. The results of Kaplan-Meier analysis indicated that high-risk patients had poor survival outcomes, regardless of cohort (P < 0.05; ). The 1-, 3-, and 5-year survival rates for the testing cohort were 0.856, 0.787, and 0.67, respectively (), whereas those for the entire TCGA cohort were 0.868, 0.810, and 0.735 (). The distribution of gene risk score and survival status and expression values of the six signature genes in the testing cohort and entire TCGA cohort are shown in ).
Figure 5. Evaluation of autophagy-related prognostic low-grade glioma (LGG) signature. Kaplan–Meier survival curves of autophagy-related signature in the testing cohort (a) and the entire TCGA cohort (b). Time-dependent ROC curve analysis of the testing cohort (c) and the entire TCGA cohort (d). Risk score distribution, survival status, and risk gene expression in the testing cohort (e) and entire TCGA cohort (f)
3.6 External validation of LGG prognostic signature
To confirm that the constructed signature could be applied to different populations, the same formula was applied to 408 LGG records from the CGGA database. The results of Kaplan-Meier analysis indicated that the OS of high-risk patients was significantly lower than that of low-risk patients (Supplementary Figure 2a), and the 1-, 3-, and 5-year survival rates for the independent external validation cohort were 0.748, 0.715, and 0.6464, respectively (Supplementary Figure 2b). As in the TCGA cohort, patient mortality rate increased increasing risk score (Supplementary Figure 2c). Therefore, the risk signature accurately predicted the outcomes of patients with LGG.
3.7 Relationship between prognostic signature and clinical factors
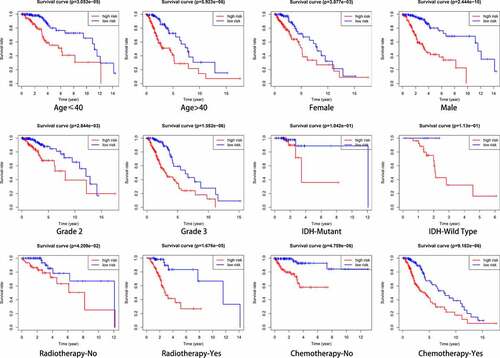
The potential prognostic value of the constructed signature in subgroups stratified by age, sex, grade, IDH status, and radiotherapy and chemotherapy history were investigated. In all cases (except in the IDH subgroups), the results of Kaplan-Meier analysis indicated that the OS of high-risk patients was significantly lower than that of low-risk patients (). However, in the CGGA cohort, this pattern was only observed in a few subgroups, including age > 40 years, females, grade 3, receiving radiotherapy, receiving chemotherapy, and 1p19q non-codel (Supplementary Figure 3).
Figure 6. Outcome prediction of the autophagy-related signature in stratified patients with low-grade glioma (LGG). Survival analysis of prognostic LGG signature in patients stratified by age (≤ 40 and > 40), gender (female and male), grade (G2 and G3), IDH (mutant- and wild-type), radiotherapy (no and yes), and chemotherapy (no and yes)
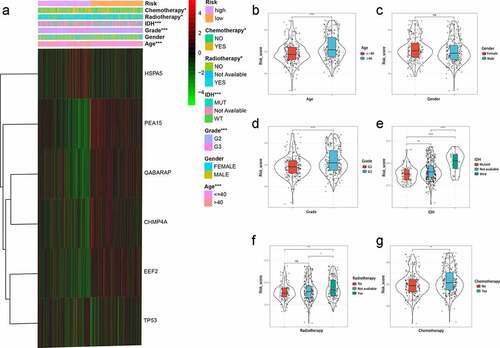
The association between signature and clinical variables was also investigated (). Older, female, grade 3, radiotherapy, and IDH wild-type patients tended to yield higher scores than younger, male, grade 2, non- radiotherapy, and IDH mutant-type patients, respectively, in the TCGA cohort (), and in the CGGA cohort, IDH1 wild-type, 1p19q non-codel, and MGMT unmethylated patients tended to yield higher scores than IDH1 mutant-type, 1p19q codel, and MGMT methylated patients (Supplementary Figure 4).
Figure 7. Relationship between clinical factors and the autophagy-related prognostic signature for low-grade glioma (LGG). (a) Expression of autophagy-related genes (ARGs) and distribution of clinicopathological features in high- and low-risk patients. (b-g) Effects of age, gender, grade, IDH, radiotherapy, and chemotherapy, respectively, on risk score distribution. *P < 0.05, **P < 0.01, ***P < 0.001, ****P < 0.0001, ns: no significant
3.8 Gene set enrichment analysis
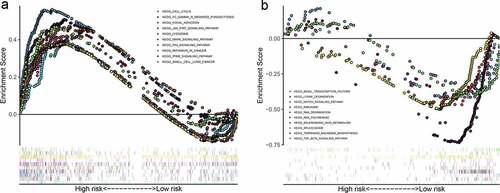
To identify pathways that could play an important role in cancer progression in high-risk patients, GSEA analysis was performed on the basis of risk signature. High-risk patients were significantly involved in multiple autophagy-and cancer-related signaling pathways (). The significantly enriched autophagy-related pathways included Fc gamma R-mediated phagocytosis, the JAK-STAT signaling pathway, and lysosomes, whereas the significantly enriched cancer-related pathways included cancer, small cell lung cancer, P53 signaling pathway, MAPK signaling pathway, PPAR signaling pathway, cell cycle, and focal adhesion. Meanwhile, low-risk patients were associated with nonmalignant pathways ().
Figure 8. Significantly enriched KEGG pathways in The Cancer Genome Atlas (TCGA) cohort. Representative KEGG pathways in the high‐risk patients (a) and low-risk patients (b)
3.9 Evaluation of signature genes
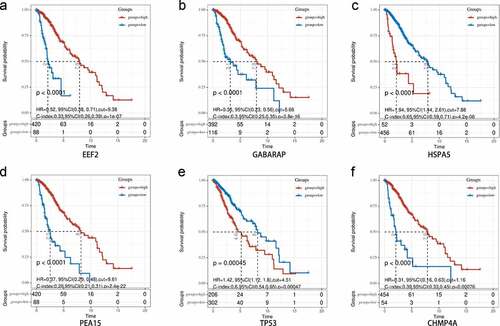
Kaplan-Meier analysis was also used to investigate the prognostic value of each signature gene. Both upregulation of the two risk genes (HSPA5 and TP53) and downregulation of the four protective genes (EEF2, GABARAP, PEA15, and CHMP4A) were strongly correlated with inferior OS in the TCGA-LGG cohort (), as well as in the CGGA cohort (Supplementary Figure 5), which indicated that the genes possessed significant prognostic value.
Figure 9. Overall survival analysis of signature-related autophagy-related genes (ARGs) in patients with and without in low-grade glioma (LGG). (a-f) EEF2, GAGBRAP, HSPA5, PEA15, TP53, and CHMP4A, respectively
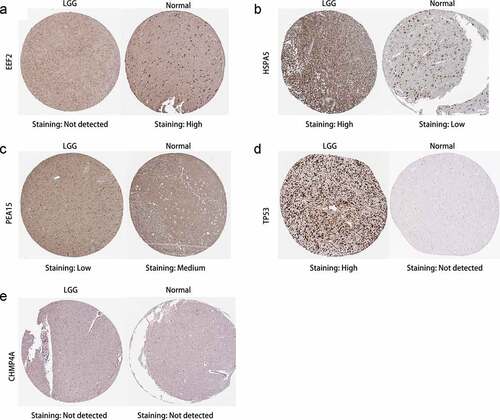
The protein expression levels of the six prognostic ARGs in tissues from patients with and without LGG were measured using clinical specimens from the Human Protein Atlas (HPA) database (). As anticipated, expression of the two high-risk genes (HSPA5 and TP53) was greater in tumor tissues than in normal tissues, whereas the expression of two of the protective genes (EEF2 and PEA15) was lower. These results are compatible with our data. However, neither CHMP4A nor GABARAP were detected in the HPA database for either LGG or control tissues and were not investigated further.
Figure 10. Immunohistochemistry of prognostic signature-related genes in patients with and without in low-grade glioma (LGG). (a-e) EEF2, HSPA5, PEA15, TP53, and CHMP4A, respectively
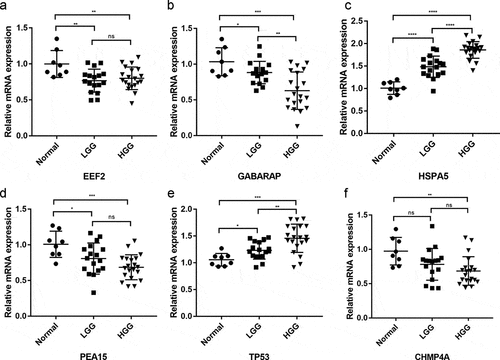
The mRNA expression of the six signature-related genes in 37 LGG and eight normal tissue samples was further validated by qRT-PCR. HSPA5 and TP53 were significantly upregulated in glioma tissues, whereas EEF2, GABARAP, PEA15, and CHMP4A were significantly downregulated (), as described above. In addition, HSPA5, TP53, and GABARAP expression was strongly correlated with tumor progression, with the highest and lowest HSPA5 and TP53 expression observed in HGG tissues and normal tissues, respectively, and the opposite trend observed for GABARAP expression.
Figure 11. Differential expression of signature-related genes in patients with and without primary glioma. (a-f) EEF2, GAGBRAP, HSPA5, PEA15, TP53, and CHMP4A, respectively. *P < 0.05, **P < 0.01, ***P < 0.001, ****P < 0.0001
4. Discussion
Low-grade gliomas (LGGs), which constitute ~29% of all brain and central nervous system tumors [Citation33]. Despite tremendous progress in multimodal treatment, the treatment outcomes of patients with LGG remain unsatisfactory [Citation34]. Increasing evidence suggests that autophagy plays a significant role in the development and progression of a variety of tumors, including gliomas [Citation35,Citation36], and even though autophagy functions as a protective factor, which can suppress tumorigenesis during the early stages of disease, it can provide energy to cells and promote cancer initiation and progression during later stages [Citation16]. Thus, elucidating the role of ARG expression in LGG is of great clinical significance.
The present study identified a group of 19 differentially expressed ARGs that could be used to assign patients with LGG to one of two subgroups, which had significantly different prognoses. Functional analysis suggested that the differentially expressed ARGs were closely related to cancer and revealed that the dysregulation of autophagy is important in cancer initiation and progression. Using the results of multivariate Cox analysis and risk-scoring methods, six autophagy genes (EEF2, GABARAP, HSPA5, PEA15, TP53, and CHMP4A) were retained as components of a prognostic signature that could be used to separate high- and low-risk patients in the TCGA training cohort. Given the possibility of overtraining during construction of the signature, the prognostic value of the signature was validated using two internal validation cohorts (TCGA testing cohort and entire TCGA cohort) and a single external validation cohort (CGGA cohort). The results suggested that the autophagy-related signature was robust and reproducible in patients with LGG, and stratified analyses also demonstrated that the signature was associated with both clinical features and LGG prognosis.
Autophagy is a highly conserved catabolic process that generally occurs in cancer cells [Citation11] and plays a complex role in cancer development, depending on tumor stage, type, and genetic background [Citation37]. In addition, increasing evidence has implicated the prognostic value of autophagy in a variety of cancers. In the present study, six signature-related genes were identified, with two (HSPA5 and TP53) considered risky genes and four (EEF2, GABARAP, PEA15, and CHMP4A) considered protective genes.
HSPA5/GRP78/BiP (heat shock protein 5), which is a master regulator of the unfolded protein response, is upregulated by glucose starvation, and plays a role in tumor cell growth by facilitating proper protein folding [Citation38,Citation39]. The protein is expressed in the ER but is also upregulated in many tumors [Citation40] and, interestingly, has been reported to contribute to survival from head and neck cancer, possibly by preventing non-thermal plasma-treated solution (NTS)-induced lysosome inhibition [Citation41]. However, the protein has also been associated with tumor progression, tumor size, and adverse prognoses in melanoma patients [Citation42], as well as with tumor promotion in gastric cancer, hepatocellular carcinoma, and colon cancer [Citation43–45].
TP53 (tumor protein p53) is a well-known tumor suppressor that plays an essential role in the maintenance of genome stability under a variety of cellular stresses. The protein represents one of the most common alterations found in human cancers, and mutant TP53 proteins can actively contribute to tumorigenesis [Citation46]. Many studies have demonstrated that TP53 plays a role at various levels of the autophagy process (including regulation of the AMPK and Akt/mTOR pathways, ARGs, and hypoxia-inducible factor-1 target genes), thereby exerting oncogenic effects in several human malignancies [Citation47]. Yang et al. reported that autophagy appeared necessary for optimal pancreatic tumor growth and progression in the physiological setting of TP53 loss during tumor progression [Citation48].
EEF2 (Eukaryotic elongation factor 2) is a well-studied gene that plays a key role in protein synthesis by mediating the translocation step in peptide chain elongation [Citation49]. In addition, the associated protein EEF2 is considered a tumor-associated antigen that is upregulated in most types of cancers and that plays a tumorigenic role in the growth of cancer cells [Citation50]. However, some studies have reported that the drug nelfinavir, by inhibiting EEF2, can reduce global protein synthesis ability and affect the translation of specific cancer-promoting mRNAs [Citation51].
GABARAP (gamma-aminobutyric acid receptor-associated protein) has been identified as a potential linker between GABAA receptors and microtubules [Citation52] and is generally localized to the pericentriolar material of the centrosome, where it contributes to the formation of autophagosomes during starvation [Citation53]. However, despite previous reports that the protein plays a role in receptor transport, the biological function of GABARAP remains unclear. For example, Klebig et al. reported that GABARAP mRNA and protein expression were significantly lower in breast tumors and in normal tissues and suggested that GABARAP transfection could actually be used to suppress breast cancer [Citation54].
PEA15 (phosphoprotein enriched in astrocytes 15) is an acidic, serine-phosphorylated, 15-kDa phosphoprotein that plays an important role in intracellular signaling and the regulation of a variety of cellular processes, including apoptosis and proliferation, dependent upon stimulation [Citation55]. Indeed, the protein has been reported to suppress the proliferation and invasion of certain cancerous cells, and the antitumor activity of PEA-15 in ovarian cancer is mediated, at least in part, by the induction of autophagy, which involves activation of the ERK1/2 pathway [Citation56]. However, increasing evidence indicates that PEA-15 plays an oncogenic role in a variety of cancers [Citation55].
CHMP4A (Charged multivesicular body protein 4A) belongs to the chromatin-modifying protein/charged multivesicular body protein family and is a component of endosomal sorting complex required for transport III, which is involved in the formation of endocytic multivesicular bodies [Citation57]. However, few studies have investigated the role of CHMP4A in cancers, and the specific mechanism needs further study.
GSEA revealed that these high-risk groups were mainly enriched in KEGG pathways related to the tumorigenesis and progression of LGG, including cell cycle, JAK/STAT signaling, and MAPK signaling. Autophagy regulates cell cycle progression by removing key cell cycle regulators and other signal transducers [Citation58]. Previous studies have reported that continued activation of the JAK/STAT signal can promote tumor progression [Citation59]. The MAPK pathway regulates the activity and expression of key inflammatory mediators, including cytokines and proteases, which may function as potent cancer promoters [Citation60]. The present study reveals that ARGs are involved in a variety of biological processes and signaling pathways, which suggests their importance in LGG initiation and development.
Although the present study provided a comprehensive analysis of autophagy-related gene expression profiles based on the TCGA and GETx databases, the study was also limited by selection and recall bias, due to the study’s retrospective design, by the need for further verification, and by the need for functional experiments to elucidate the mechanisms underlying the signature-related genes.
5. Conclusion
The present study established a reliable signature of six ARGs (EEF2, GABARAP, HSPA5, PEA15, TP53, and CHMP4A) for the prognosis of patients with LGG. A signature-based risk score was identified as an independent predictor of LGG prognosis, and GSEA revealed that the autophagy- and cancer-related pathways are enriched in high-risk patients. More importantly, the present study might shed new light on the potential association between autophagy and LGG, and the constructed signature can be used in both clinical practice and in the design of individualized therapeutic regimens.
Notes on Contributions
S.F. defined the research theme, discussed analyses, and drafted the manuscript. H.L., X.D. and P.D. performed the literature search and collected data for the manuscript. Q.P. and H.G. were responsible for the integrity of the entire study and manuscript review. All authors read and approved the final manuscript.
Highlights
(1) Autophagy-related genes were screened for association to low-grade glioma prognosis.
(2) A genetic signature was established to predict prognosis from low-grade glioma.
(3) The genetic signature was an independent prognostic factor for lower-grade glioma.
Ethics approval and consent to participate
This study was approved by the Ethics Committee of Shandong Provincial Hospital Affiliated to Shandong University (Jinan, Shandong, China). All participants were informed consent. This study was conducted in accordance with the Declaration of Helsinki.
Supplemental Material
Download MS Word (2 MB)Acknowledgements
We express our gratitude to all of the medical staff who contributed to uploading and organizing the TCGA, GTEx, and CGGA databases.
Availability of data and materials
Data associated with this manuscript can be made available from the corresponding authors on reasonable request.
Disclosure statement
No potential conflict of interest was reported by the author(s).
Supplementary material
Supplemental data for this article can be accessed here.
Additional information
Funding
References
- Lopes MBS. The 2017 World Health Organization classification of tumors of the pituitary gland: a summary. Acta Neuropathol. 2017;134:521–535.
- Brat DJ, Verhaak RG, Aldape KD, et al. Comprehensive, integrative genomic analysis of diffuse lower-grade gliomas. N Engl J Med. 2015;372:2481–2498.
- Ostrom QT, Gittleman H, Xu J, et al. CBTRUS statistical report: primary brain and other central nervous system tumors diagnosed in the United States in 2009–2013. Neuro Oncol. 2016;18(suppl_5):v1–v75.
- Claus EB, Walsh KM, Wiencke JK, et al. Survival and low-grade glioma: the emergence of genetic information. Neurosurg Focus. 2015;38:E6.
- Weller M, van den Bent M, Tonn JC, et al. European Association for Neuro-Oncology (EANO) guideline on the diagnosis and treatment of adult astrocytic and oligodendroglial gliomas. Lancet Oncol. 2017;18:e315–e329.
- Wongsurawat T, Jenjaroenpun P, De Loose A, et al. A novel Cas9-targeted long-read assay for simultaneous detection of IDH1/2 mutations and clinically relevant MGMT methylation in fresh biopsies of diffuse glioma. Acta Neuropathol Commun. 2020;8:87.
- Paech D, Windschuh J, Oberhollenzer J, et al. Assessing the predictability of IDH mutation and MGMT methylation status in glioma patients using relaxation-compensated multipool CEST MRI at 7.0 T. Neuro Oncol. 2018;20:1661–1671.
- Brigliadori G, Foca F, Dall’Agata M, et al. Defining the cutoff value of MGMT gene promoter methylation and its predictive capacity in glioblastoma. J Neurooncol. 2016;128:333–339.
- Ceccarelli M, Barthel FP, Malta TM, et al. Molecular profiling reveals biologically discrete subsets and pathways of progression in diffuse glioma. Cell. 2016;164:550–563.
- Lyamzaev KG, Tokarchuk AV, Panteleeva AA, et al. Induction of autophagy by depolarization of mitochondria. Autophagy. 2018;14:921–924.
- Giampieri F, Afrin S, Forbes-Hernandez TY, et al. Autophagy in human health and disease: novel therapeutic opportunities. Antioxid Redox Signal. 2019;30:577–634.
- Singh SS, Vats S, Chia AY, et al. Dual role of autophagy in hallmarks of cancer. Oncogene. 2018;37:1142–1158.
- Sun Z, Jing C, Xiao C, et al. An autophagy-related long non-coding RNA prognostic signature accurately predicts survival outcomes in bladder urothelial carcinoma patients. Aging (Albany NY). 2020;12:15624–15637.
- Levine B, Kroemer G. Biological functions of autophagy genes: a disease perspective. Cell. 2019;176:11–42.
- Ariosa AR, Lahiri V, Lei Y, et al. A perspective on the role of autophagy in cancer. Biochim Biophys Acta Mol Basis Dis. 2021;166262.
- White E. The role for autophagy in cancer. J Clin Invest. 2015;125:42–46.
- Ulasov IV, Lenz G, Lesniak MS. Autophagy in glioma cells: an identity crisis with a clinical perspective. Cancer Lett. 2018;428:139–146.
- Baumert BG, Hegi ME, van den Bent MJ, et al. Temozolomide chemotherapy versus radiotherapy in high-risk low-grade glioma (EORTC 22033-26033): a randomised, open-label, phase 3 intergroup study. Lancet Oncol. 2016;17:1521–1532.
- How CW, Ong YS, Low SS, et al. How far have we explored fungi to fight cancer? Semin Cancer Biol. 2021. DOI:10.1016/j.semcancer.2021.03.009
- Tomczak K, Czerwińska P, Wiznerowicz M. The Cancer Genome Atlas (TCGA): an immeasurable source of knowledge. Contemp Oncol (Pozn). 2015;19:A68–77.
- GTEx Consortium. The GTEx Consortium atlas of genetic regulatory effects across human tissues. Science. 2020;369:1318–1330.
- Ritchie ME, Phipson B, Wu D, et al. limma powers differential expression analyses for RNA-sequencing and microarray studies. Nucleic Acids Res. 2015;43:e47.
- Tu Z, Wu L, Wang P, et al. N6-methylandenosine-related lncRNAs are potential biomarkers for predicting the overall survival of lower-grade glioma patients. Front Cell Dev Biol. 2020;8:642.
- Galluzzi L, Bravo-San Pedro JM, Levine B, et al. Pharmacological modulation of autophagy: therapeutic potential and persisting obstacles. Nat Rev Drug Discov. 2017;16:487–511.
- Hazlewood JE, Dumenil T, Le TT, et al. Injection site vaccinology of a recombinant vaccinia-based vector reveals diverse innate immune signatures. PLoS Pathog. 2021;17:e1009215–e1009215.
- Seiler M, Huang CC, Szalma S, et al. ConsensusCluster: a software tool for unsupervised cluster discovery in numerical data. Omics. 2010;14:109–113.
- Yang L, Liu L, Gao H, et al. The stem cell factor SALL4 is an essential transcriptional regulator in mixed lineage leukemia-rearranged leukemogenesis. J Hematol Oncol. 2017;10:159.
- Szklarczyk D, Gable AL, Lyon D, et al. STRING v11: protein-protein association networks with increased coverage, supporting functional discovery in genome-wide experimental datasets. Nucleic Acids Res. 2019;47:D607–d613.
- Zhu X, Luo H, Xu Y. Transcriptome analysis reveals an important candidate gene involved in both nodal metastasis and prognosis in lung adenocarcinoma. Cell Biosci. 2019;9:92.
- Best MG, Sol N, Vancura A, et al. Swarm intelligence-enhanced detection of non-small-cell lung cancer using tumor-educated platelets. Cancer Cell. 2017;32:238–252.e239.
- Rybinska I, Sandri M, Bianchi F, et al. Extracellular matrix features discriminate aggressive HER2-positive breast cancer patients who benefit from trastuzumab treatment. Cells. 2020;9:434.
- Pontén F, Jirström K, Uhlen M. The human protein atlas–a tool for pathology. J Pathol. 2008;216:387–393.
- Liu B, Liu J, Liu K, et al. A prognostic signature of five pseudogenes for predicting lower-grade gliomas. Biomed Pharmacother. 2019;117:109116.
- Yu F, Asghar S, Zhang M, et al. Local strategies and delivery systems for the treatment of malignant gliomas. J Drug Target. 2019;27:367–378.
- Amaravadi R, Kimmelman AC, White E. Recent insights into the function of autophagy in cancer. Genes Dev. 2016;30:1913–1930.
- Amaravadi RK, Kimmelman AC, Debnath J. Targeting autophagy in cancer: recent advances and future directions. Cancer Discov. 2019;9:1167–1181.
- Zheng J, Wang B, Zheng R, et al. Linc-RA1 inhibits autophagy and promotes radioresistance by preventing H2Bub1/USP44 combination in glioma cells. Cell Death Dis. 2020;11:758.
- Song S, Long M, Yu G, et al. Urinary exosome miR-30c-5p as a biomarker of clear cell renal cell carcinoma that inhibits progression by targeting HSPA5. J Cell Mol Med. 2019;23:6755–6765.
- Care C, Sornjai W, Jaratsittisin J, et al. Discordant activity of kaempferol towards dengue virus and japanese encephalitis virus. Molecules. 2020;25:1246.
- Jia Z-Y, Shen T-Y, Jiang W, et al. Identification of molecular mechanisms of glutamine in pancreatic cancer. Oncol Lett. 2017;14:6395–6402.
- Kim SY, Kim HJ, Kim HJ, et al. HSPA5 negatively regulates lysosomal activity through ubiquitination of MUL1 in head and neck cancer. Autophagy. 2018;14:385–403.
- Cerezo M, Rocchi S. New anti-cancer molecules targeting HSPA5/BIP to induce endoplasmic reticulum stress, autophagy and apoptosis. Autophagy. 2017;13:216–217.
- Zhang J, Jiang Y, Jia Z, et al. Association of elevated GRP78 expression with increased lymph node metastasis and poor prognosis in patients with gastric cancer. Clin Exp Metastasis. 2006;23:401–410.
- Wei PL, Kuo LJ, Wang W, et al. Silencing of glucose-regulated protein 78 (GRP78) enhances cell migration through the upregulation of vimentin in hepatocellular carcinoma cells. Ann Surg Oncol. 2012;19(Suppl 3):S572–579.
- Raiter A, Vilkin A, Gingold R, et al. The presence of anti-GRP78 antibodies in the serum of patients with colorectal carcinoma: a potential biomarker for early cancer detection. Int J Biol Markers. 2014;29:e431–435.
- Birts CN, Banerjee A, Darley M, et al. p53 is regulated by aerobic glycolysis in cancer cells by the CtBP family of NADH-dependent transcriptional regulators. Sci Signal. 2020;13:eaau9529.
- Cordani M, Butera G, Pacchiana R, et al. Molecular interplay between mutant p53 proteins and autophagy in cancer cells. Biochim Biophys Acta Rev Cancer. 2017;1867:19–28.
- Yang A, Rajeshkumar NV, Wang X, et al. Autophagy is critical for pancreatic tumor growth and progression in tumors with p53 alterations. Cancer Discov. 2014;4:905–913.
- Mori T, Kitani Y, Hatakeyama D, et al. Predation threats for a 24-h period activated the extension of axons in the brains of Xenopus tadpoles. Sci Rep. 2020;10:11737.
- Knight JRP, Garland G, Pöyry T, et al. Control of translation elongation in health and disease. Dis Model Mech. 2020;13.
- De Gassart A, Demaria O, Panes R, et al. Pharmacological eEF2K activation promotes cell death and inhibits cancer progression. EMBO Rep. 2016;17:1471–1484.
- Ye J, Zou G, Zhu R, et al. Structural basis of GABARAP-mediated GABA(A) receptor trafficking and functions on GABAergic synaptic transmission. Nat Commun. 2021;12:297.
- Joachim J, Jefferies HB, Razi M, et al. Activation of ULK kinase and autophagy by GABARAP trafficking from the centrosome is regulated by WAC and GM130. Mol Cell. 2015;60:899–913.
- Klebig C, Seitz S, Arnold W, et al. Characterization of {gamma}-aminobutyric acid type A receptor-associated protein, a novel tumor suppressor, showing reduced expression in breast cancer. Cancer Res. 2005;65:394–400.
- Greig FH, Nixon GF. Phosphoprotein enriched in astrocytes (PEA)-15: a potential therapeutic target in multiple disease states. Pharmacol Ther. 2014;143:265–274.
- Bartholomeusz C, Rosen D, Wei C, et al. PEA-15 induces autophagy in human ovarian cancer cells and is associated with prolonged overall survival. Cancer Res. 2008;68:9302–9310.
- McCullough J, Clippinger AK, Talledge N, et al. Structure and membrane remodeling activity of ESCRT-III helical polymers. Science. 2015;350:1548–1551.
- Zheng K, He Z, Kitazato K, et al. Selective autophagy regulates cell cycle in cancer therapy. Theranostics. 2019;9:104–125.
- Groner B, von Manstein V. Jak Stat signaling and cancer: opportunities, benefits and side effects of targeted inhibition. Mol Cell Endocrinol. 2017;451:1–14.
- Wagner EF, Nebreda AR. Signal integration by JNK and p38 MAPK pathways in cancer development. Nat Rev Cancer. 2009;9:537–549.