
ABSTRACT
Alzheimer’s disease (AD) is acommon neurodegenerative disease in the aged population. Tripterygium glycoside (TG) has been reported to protect the nervous system. However, the effect of TG on AD is still unknown. We aimed to explore the effect of TG on AD. Thirty-two C57BL/6J mice were randomly selected and assigned to the normal control, AD model, AD+donepezil, and AD+TG groups. PC12 cells were assigned to the normal control, AD cell model, and AD+TG groups. The alterations in spatial memory and learning abilities of mice were measured by Morris water maze. Neuronal damage in mice was detected using Nissl staining. The expression levels of Aβ25-35, p-Tau, and CD11b in brain tissues were detected using immunohistochemistry. The expression levels of IL-1β, TNF-α, NO, p-P38, P38, p-IκBα, Caspase1, COX2, and iNOS were measured using ELISAs, qRT–PCR, and western blotting.TG significantly improved the spatial memory and learning abilities of AD mice. Compared toAD model group, significantly lower expression levels of Aβ25-35, p-Tau, and CD11b were observed in AD+TG group (p < 0.05). The neuron density significantly increased in AD+TG group (p < 0.05). Significantly lower expression levels of IL-1β, TNF-α, NO, caspase-1, COX2, iNOS, p-IκBα and p-P38 MAPK were detected in AD+TG group (p < 0.05). In summary, TG may exert aneuroprotective effect by suppressing the release of inflammatory factors and microglial activity and inhibiting the phosphorylation of IκBα and p38 MAPK. These findings may improve our understanding of the mechanism of TG intervention in AD.
Introduction
Alzheimer’s disease (AD) is a progressive degenerative disease of the nervous system in elderly people, especially in elderly people over the age of 65 years, with the clinical features of memory impairment, progressive cognitive decline and behavioral changes [Citation1–5]. The pathogenesis of AD is complex. Neuroinflammation was identified as one of the most important factors contributing to the occurrence and development of AD [Citation6,Citation7]. Neuroinflammation is mainly attributed to the activation of astrocytes and microglia [Citation8,Citation9]. Senile plaques are the main pathological feature of AD [Citation10]. The core of senile plaques is the deposition of Aβ [Citation11]. Activated microglia have been observed around neuroinflammatory plaques in the hippocampus of patients with AD [Citation12]. These cells produce many proinflammatory factors, including interleukin 1 beta (IL-1β), tumor necrosis factor alpha (TNF-α), inducible nitric oxide synthase (iNOS) and cyclooxygenase-2 (Cox-2), which may recruit neutrophils by inducing the expression of adhesion molecules and chemokines in astrocytes and microglia that subsequently play an important role in the initial stages of neuroinflammation [Citation13,Citation14].
Tripterygium glycosides (TGs) are nonsteroidal immunosuppressants. Physiological activities are attributed to diterpene lactone alkaloids and triterpenes that were reported to exert anti-inflammatory, antitumor and immunosuppressive effects [Citation15–18] and were shown to protect the nervous system [Citation19]. Recent researchers have reported that TG ameliorates inflammation in astrocytes induced by lipopolysaccharide (LPS) by decreasing the expression of TNF-α, iNOS and IL6 [Citation20]. Zheng et al. indicated that TG inhibits intestinal inflammatory responses by inhibiting the NOX-ROS-NLRP3 signaling pathway [Citation21]. In addition, Wang et al. showed that TG exerts anti-inflammatory effects by promoting the expression of IL-37 [Citation22]. Moreover, Shan et al. reported that TG inhibits the expression levels of TNF-α and nuclear factor-kappa B (NF-κB), reduces the infection rate of Ureaplasma urealyticum, and treats prostatitis [Citation23].
Therefore, TG may be a promising drug treatment for chronic inflammatory diseases. However, the effect and molecular mechanism of TG on AD remain unknown. In the current study, we attempted to evaluate the alterations in spatial memory, microglial activation, and the expression levels of TNF-α, IL-1β, iNOS, COX-2, p-p38, p-IκBα and an apoptosis-related factor (Caspase1) in AD mouse models treated with TG.
Materials and methods
Grouping and treatment of experimental animals
All animal experiments were performed in the Neuroscience and Behavior Center of Changsha Medical University. Thirty-two C57BL/6 J mice (male, 28 ± 5 g, 6 months old) were purchased from Silaike Jingda Biotechology Co., Ltd. (Changsha, Hunan, China). The mice were housed under controlled conditions (temperature: 23 ± 0.6°C, relative humidity: 55 ± 8%, light:dark cycle = 12 h:12 h).
The mice were randomly divided into four groups:
AD+TG group (0.25 mg/10 g.d TG, 1 mg/ml, n = 8);
AD+donepezil group (0.25 mg/10 g.d donepezil, 1 mg/ml, n = 8);
AD model group (0.5 ml/d (0.9%) NS, n = 8).
Normal control group (0.5 ml/d (0.9%) NS, n = 8)
Mice in the AD+TG, AD+donepezil, and AD model groups were first administered 3 µl of Aβ25-35 (both sides, 1 mg/ml) via a lateral ventricular stereotactic injection on Day 0 [Citation24]. Mice in the normal control group were administered 3 µl of normal saline (NS) (both sides, 0.9%) via a lateral ventricular stereotactic injection on Day 0. The procedures for the lateral ventricular stereotactic injection were described by Choi et al [Citation24]. The entire agent was administered once. Mice in the AD+TG, AD+donepezil, and AD model groups were then treated with 0.25 mg/10 g.d TG, 0.25 mg/10 g.d donepezil, and 0.5 ml/d NS separately on Day 15. Mice in the normal control group were treated with 0.5 ml/d NS on Day 15. Drug treatment was administered by intraperitoneal injection once per day for 28 continuous days. Donepezil (10 mg/tablet) and TG (10 mg/tablet) tablets were purchased from Lianban Pharma Co., Ltd. (Zhuhai, China). The dose and duration of TG were determined using the method described by Wang et al [Citation25].
Grouping and treatment of experimental cells
PC12 cells were cultured in dulbecco’s modified eagle medium (DMEM) containing 10% fetal bovine serum (FBS) and 1% antibiotics (100 U/ml penicillin and 100 mg/ml streptomycin) in a flask at 37°C in a 5% CO2 incubator. After 24 hours, the morphology was observed with an inverted microscope. Cells were digested with trypsin-EDTA upon reaching confluence. The cultured PC12 cells were divided into three groups:
Normal control group ((0.9%) NS)
AD cell model group (Aβ25-35 20umol/L)
AD+TG group (Aβ25-35 20umol/L + 25 µg/L TG)
The normal control cells were treated with NS. AD model cells were treated with 20 µmol/L Aβ25-35 for 24 h. The AD+TG group was treated with 20 µmol/L Aβ25-35 and 25 µg/L TG for 24 h. The dose and duration of Aβ25-35 and TG were determined using the methods reported by Zheng [Citation26] and Wang et al [Citation27].
Morris water maze test
The Morris water maze test was performed on Day 14 after the Aβ25-35 injection and on Day 29 after TG treatment in mice. The procedure for the Morris water maze test was based on the description in the study by Vorhees et al. [Citation28]. The ethology data collection procedure was described in our previous study [Citation29].
Tissue collection
Abdominal anesthesia with pentobarbital sodium (40 mg/kg) was administered prior to decapitation and removing the brain. Samples of the left hemisphere (n = 8) were stored in 4% paraformaldehyde overnight. Samples of the right hemisphere (n = 8) were quickly frozen in liquid nitrogen and stored in a − 80°C freezer until further analysis.
Nissl staining
Nissl staining was used to detect the distribution of neurons in the hippocampus. The density and morphological changes in hippocampal neurons were measured with Image-Pro Plus 5.1 software (Media Cybernetics, Inc., Bethesda, USA).
ELISA
The release of nitric oxide (NO) was measured at 540 nm with an enzyme-labeled instrument and Griess reagent (Abcam, Cambridge, United Kingdom; ab234044). The levels of IL-1β and TNF-α were detected using an enzyme-labeled instrument (Varioskan LUX) (Thermo Scientific, Singapore) and ELISA kits (Sigma, Tokyo, Japan; IL-1β ELISA kit: #E-EL-H0149c; TNF-α ELISA kit: #E-EL-H0109c).
Western blotting
A BCA Protein Assay Kit (Beyotime, Beijing, China, #E-BC-K318-M) was employed to analyze the total protein concentration in the brain tissue samples. Sodium dodecyl sulfate polyacrylamide gel electrophoresis (SDS-PAGE) was conducted at 80 V for 1 hour. Proteins were transferred to the membrane using Trans-Blot®Turbo™ (Bio-Rad, USA). The total protein was incubated with rabbit antibodies against p-P38 (1:1000; 43 KD, AFFINITY, #AF3455, Rabbit), P38 (1:3000; 43 KD, AFFINITY, #AF6456, Rabbit, Jiangsu, China), p-IκBα (1:1000; 39 KD, AFFINITY, #AF2002, Rabbit, Jiangsu, China), Caspase1 (1:1000; 45 KD, AFFINITY, #AF5418, Rabbit, Jiangsu, China), COX2 (1:1000; 72 KD, AFFINITY, #AF7003, Rabbit, Jiangsu, China), iNOS (1:500; 130 KD, AFFINITY, #AF0199, Rabbit, Jiangsu, China) and α-Tubulin (1:5000; ProMab, #PM210797, Rabbit) at 4°C overnight. Then, the blots were incubated with rabbit IgG (1:80000; AFFINITY, #S0001, Rabbit, Jiangsu, China) at room temperature for 2 h. Image-Pro Plus software was used to analyze the positive signals.
Immunohistochemistry
The procedures were performed as described in our recently reported study [Citation30]. The primary antibodies were anti-Aβ25-35 (1:150; AFFINITY, #E-AB-125941, Rabbit, Jiangsu, China), p-Tau (1:200; AFFINITY, #E-AB-312902, Rabbit, Jiangsu, China), CD11b (1:150; AFFINITY, #E-AB-60354, Rabbit, Jiangsu, China), and the secondary antibody was IgG (1:200; AFFINITY, #E-AB-125900, Rabbit, Jiangsu, China).
qRT–PCR
Total RNA was extracted using a TRIzol Reagent (Ambion®) Kit (15596–026, Invitrogen, USA) and purified using DNase. The RNA quantity and integrity were detected using NanoDrop and Agilent spectrophotometer. The cDNA templates were synthesized using the BeyoRT™ First Strand cDNA Synthesis Kit (D7166, Beyotime, Beijing, China). The TB GreenTM Premix Ex TAQ TM II kit (RR820A, TAKARA, Tokyo, Japan) was used for qRT–PCR. The relative expression of mRNAs was calculated with the 2−ΔΔCt method. β-Actin was used as an internal reference.
Statistical analysis
SPSS 22.0 was used for statistical analyses. All data are presented as the means ± standard deviations (means ± SD). One-way ANOVA was used for comparisons among groups. The SNK-q test was used to compare the data between two groups. P < 0.05 indicated a significant difference.
Results
Establishment of Aβ25-35-induced AD mouse models
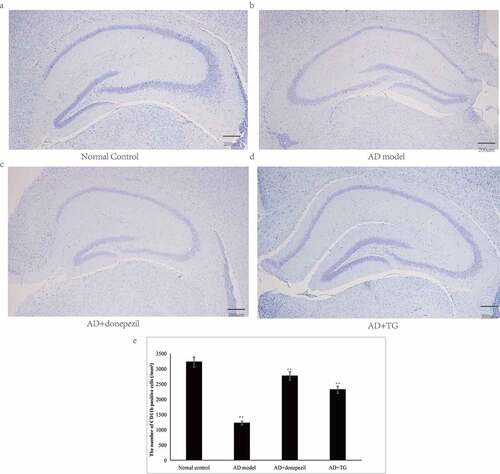
Significantly longer latency (AD: 59.61 ± 3.23 vs. normal control: 21.36 ± 2.62) and decreased frequencies of platform crossings (AD: 1.33 ± 0.02 vs. normal control: 6.28 ± 0.05) were detected in the AD model group compared with the control group (p < 0.05) (). In addition, a significantly greater number of activated microglia was observed in the AD mouse model (5314 ± 147.35) than in the normal control group (1132 ± 107.63) (p < 0.05) (). Significantly higher levels of Aβ25-35 (AD: 2529.26 ± 405.54 vs. normal control: 1324.21 ± 341.26) and integrated optical density (IOD) of p-Tau (AD: 1227.96 ± 76.54 vs. normal control: 197.21 ± 12.47) were detected in the AD model group than in the normal control group (). Furthermore, the neuron density was significantly decreased in the AD model group (1214.74 ± 108.60) compared with that in the normal control group (3245.35 ± 114.92) (p < 0.05) (). Therefore, AD mouse models induced by Aβ25-35 were successfully established.
Figure 1. Testing of spatial learning and memory in the AD+TG, AD+donepezil, AD model and Normal control groups by Morris water maze. (a) The swimming trajectory of mice in the Normal control group; (b) The swimming trajectory of mice in the AD model group; (c) The swimming trajectory of mice in the AD+donepezil group; (d) The swimming trajectory of mice in the AD+TG group; (e) Significant difference of escape latency in the AD+TG group than that in the AD model group was detected (** p < 0.05). (f) Significant more frequency of crossing the target platform in AD+TG group than that in the AD model group was detected (** p < 0.05). Data was expressed as the mean ± standard error of the mean (SEM). (n = 8/group in the AD+TG group; n = 8/group in the AD+donepezil group; n = 8/group in the AD model group; n = 8/group in the Normal control group). ‘**’ indicating significant inter-group difference. TG: Tripterygium glycoside; AD: Alzheimer disease; NS: normal saline
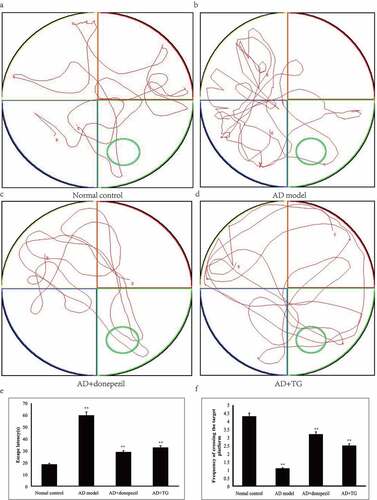
Figure 2. The distribution of Aβ, p-Tau and CD11b immunolabeling across the brains in the AD+TG, AD+donepezil, AD model and Normal control groups. (a–e): The distribution of Aβ immunolabeling in the AD+TG, AD+donepezil, AD model and Normal control groups. (f–j): The distribution of p-Tau immunolabeling in the AD+TG, AD+donepezil, AD model and Normal control groups. (k–o): The distribution of CD11b immunolabeling in the AD+TG, AD+donepezil, AD model and Normal control groups. Data was expressed as the mean ± standard error of the mean (SEM). (n = 8/group in the AD+TG group; n = 8/group in the AD+donepezil group; n = 8/group in the AD model group; n = 8/group in the Normal control group). ‘**’ indicating significant inter-group difference. TG: Tripterygium glycoside; AD: Alzheimer disease; NS: normal saline
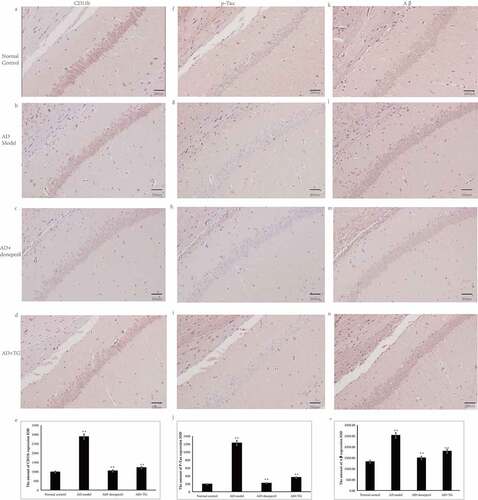
Figure 3. The results of Nissl staining. (a) Nissl staining in the Normal control group. (b) Nissl staining in the AD model group. (c) Nissl staining in the AD+donepezil group. (d) Nissl staining in the AD+TG group. (e) The comparison of the number of pyramidal neurons in the AD+TG, AD+donepezil, AD model and Normal control groups. Data was expressed as the mean ± standard error of the mean (SEM). (n = 8/group in the AD+TG group; n = 8/group in the AD+donepezil group; n = 8/group in the AD model group; n = 8/group in the Normal control group). ‘**’ indicating significant inter-group difference. TG: Tripterygium glycoside; AD: Alzheimer disease; NS: normal saline
The protective effect of TG on AD mouse models and AD cell models
Morris water maze
Compared to the AD model group, a significantly shorter latency (36.24 ± 1.31 vs. 59.62 ± 1.13) was detected in the AD+TG group (p < 0.05) (). In addition, compared to the AD model group, a significantly increased frequency of platform crossings was observed for the AD+TG group (3.41 ± 0.12 vs. 1.01 ± 0.04) (p < 0.05) ().
Expression levels of Aβ25-35 and P-Tau
Compared to the AD model group (2529.26 ± 405.54), a significantly lower integrated optical density (IOD) of p-Tau (363.01 ± 41.73) was detected in the AD+TG group (p < 0.05) (). Compared with that in the AD model group (1802.26 ± 317.45), a significantly lower amount of Aβ25-35 was detected in the AD+TG group (1227.96 ± 52.12) (p < 0.05) ().
Activity of microglia
The microglia in the hippocampus of the AD+TG group were much smaller and presented fewer branches than those in the AD model group. In addition, a significantly decreased IOD of CD11b was observed in the AD+TG group (1216.6 ± 190.86 vs. 2884.07 ± 544.46) compared to the AD model group (p < 0.05) ().
Nissl staining
The neurons were arranged regularly in the AD+TG group but were disordered in the AD model group. The neuron number was significantly increased in the AD+TG group (3872.72 ± 82.14) compared to the AD model group (1634.47 ± 53.25) (p < 0.05) ().
Western blotting
As shown in , the levels of p-IκBα (0.248 ± 0.013 vs. 0.553 ± 0.024), p-P38 (0.258 ± 0.021 vs. 0.666 ± 0.027), and caspase-1 (0.105 ± 0.084 vs. 0.506 ± 0.121) were significantly decreased in the AD+TG group (p < 0.05) compared to the AD model group (. However, the level of p38 in the AD+TG group (0.673 ± 0.031) was not different from that in the AD model group (0.692 ± 0.122) (p > 0.05) ().
Figure 4. The expression levels of p-P38, P38, p-IκBα, Caspase1, COX2, and iNOS proteins between groups. Quantitative summaries of the protein levels relative to α-tubulin as an internal control, expressed as a percentage of α-tubulin optical density (o.d.) for the groups (n = 8/group). Statistical results (Kruskal–Wallis nonparametric test with Dunn’s multiple post hoc comparison) were shown in the bar graphs, with ‘**’ indicating significant inter-group difference. Data was expressed as the mean ± standard error of the mean (SEM)(n = 8/group). (a–g) The expression levels of p-P38, P38, p-IκBα, Caspase1, COX2, and iNOS proteins in AD+TG, AD+donepezil, AD mice model and Normal control groups. (a) p-P38; (b) P38; (c) p-IκBα; (d) Caspase1; (e) COX2; (f) iNOS. (g) The western blotting results of p-P38, P38, p-IκBα, Caspase1, COX2, and iNOS proteins. (h–n) The expression levels of p-P38, P38, p-IκBα, Caspase1, COX2, and iNOS proteins in AD+TG, AD cell model and Normal control groups. (h) p-P38; (i) P38; (j) p-IκBα; (k) Caspase1; (l) COX2; (m) iNOS. (n) The western blotting results of p-P38, P38, p-IκBα, Caspase1, COX2, and iNOS proteins. ‘**’ indicating significant inter-group difference. TG: Tripterygium glycoside; AD: Alzheimer disease; NS: normal saline
In addition, significantly lower numbers of positive puncta for COX2 (0.156 ± 0.022 vs. 0.331 ± 0.012) and iNOS (0.296 ± 0.015 vs. 0.669 ± 0.137) were observed in the AD+TG group compared to the AD model group (p < 0.05) ().
Furthermore, significantly lower levels of p-IκBα (0.125 ± 0.014 vs. 0.443 ± 0.102), p-P38 (0.138 ± 0.012 vs. 0.780 ± 0.114), caspase-1 (0.123 ± 0.019 vs. 0.446 ± 0.107), COX2 (0.116 ± 0.011 vs. 0.327 ± 0.034), and iNOS (0.222 ± 0.015 vs. 0.821 ± 0.117) were detected in the AD cell group treated with TG than in the AD cell group (p < 0.05). The expression level of p38 (0.746 ± 0.054 vs. 0.783 ± 0.067) in the AD cell group was not significantly different from that in the AD cell group treated with TG (p > 0.05) ().
qRT–PCR
The relative mRNA expression levels of IL-1β (0.979 ± 0.122 vs. 2.815 ± 0.143), TNF-α (2.196 ± 0.472 vs. 5.997 ± 0.724), COX2 (2.448 ± 0.137 vs. 3.285 ± 0.145), and iNOS (2.113 ± 0.235 vs. 3.978 ± 0.346) were significantly lower in the AD+TG group than in the AD model group (p < 0.05) ()). In addition, significantly lower expression levels of the IL-1β (1.242 ± 0.152 vs. 3.153 ± 0.161), TNF-α (2.245 ± 0.134 vs. 4.321 ± 0.131), COX2 (1.143 ± 0.072 vs. 3.87 ± 0.103), and iNOS (1.031 ± 0.032 vs. 3.959 ± 0.152) mRNAs were observed in the AD cell group treated with TG than in the AD cell group (p < 0.05) ()).
Figure 5. The expression levels of IL-1β, TNF-α, COX2, and iNOS mRNAs between groups. (a) The expression levels of IL-1β, TNF-α, COX2, and iNOS mRNAs in brain tissues in the AD+TG, AD+donepezil, AD model and Normal control groups. (b) The expression levels of IL-1β, TNF-α, COX2, and iNOS mRNAs in the AD+TG, AD cell model and Normal control groups. Data was expressed as the mean ± standard error of the mean (SEM)(n = 8/group). ‘**’ indicating significant inter-group difference. TG: Tripterygium glycoside; AD: Alzheimer disease; NS: normal saline
ELISA results
As shown in , the expression of IL-1β (170.6 ± 23.29 vs. 505.69 ± 43.33) ()), TNF-α (325.07 ± 55.57 vs. 714.65 ± 23.01) ()) and NO (12.22 ± 2.14 vs. 24.31 ± 1.54) ()) was significantly lower in the AD+TG group than in the AD model group (p < 0.05). In addition, similar results were observed in the AD cell group treated with TG compared to the AD cell group (IL-1β: 201.74 ± 25.14 vs. 597.10 ± 39.21; TNF-α: 402.17 ± 49.52 vs. 876.33 ± 24.14; NO: 11.14 ± 2.21 vs. 24.34 ± 1.47) (p < 0.05) ().
Figure 6. The expression levels of IL-1β, TNF-α and release of NO between groups. A: The expression levels of IL-1β, TNF-α and release of NO in the AD+TG, AD+donepezil, AD model and Normal control groups. (a) IL-1β; (b) TNF-α; (c) Nitrite. B: The expression levels of IL-1β, TNF-α and release of NO in the AD+TG, AD cell model and Normal control groups. (d) IL-1β; (e) TNF-α; (f) Nitrite.Data was expressed as the mean ± standard error of the mean (SEM)(n = 8/group). ‘**’ indicating significant inter-group difference. TG: Tripterygium glycoside; AD: Alzheimer disease; NS: normal saline
Discussion
In the present study, the effect of TG on an Aβ25-35-induced AD mouse model and an AD cell model was evaluated by performing behavioral and biochemical analyses. The results revealed that TG significantly improved spatial memory and learning abilities, reduced the levels of Aβ25-35 and p-Tau, suppressed microglial activity, and decreased the expression of inflammatory factors, including IL-1β, NO, iNOS, COX-2 and TNF-α, and the phosphorylation of IκBα and p38 MAPK in an Aβ25-35-induced AD mouse model.
Neuroinflammation plays an important role in central nervous system diseases such as AD, Parkinson’s disease (PD), and amyotrophic lateral sclerosis (ALS) [Citation31–33]. Microglia are resident immune cells in the central nervous system [Citation34] and have been shown to participate in innate immunity in the brain [Citation35]. Normally, microglia are activated to cause infection, inflammation, and trauma and then release many inflammatory factors and free radicals, including superoxide anion and NO, which induce neuronal injury and apoptosis [Citation36,Citation37]. NO is an important endogenous molecule that is normally synthesized by three nitric oxide synthases (NOSs) [Citation38]. iNOS is produced by macrophages and glial cells in response to infection and inflammatory factors such as TNF-α, IFN-γ, and endotoxin and then produces a large amount of NO [Citation39]. High concentrations of NO exert a cytotoxic effect through the mechanisms of lipid oxidation, mitochondrial damage, activation or inhibition of signaling pathways and DNA damage [Citation40].
Modern pharmacological studies have supported the anti-inflammatory and antitumor effects of TG, which is widely used in the clinical treatment of RA and nephrotic syndrome [Citation15,Citation16]. TG has been reported to exert anti-inflammatory effects [Citation41,Citation42]. The anti-inflammatory mechanism of TG may mainly involve inhibiting the expression of proinflammatory factors, including NF-κB, NO, mitogen-activated protein kinase (MAPK), and COX-2 [Citation43,Citation44].
Initially, we detected that TG significantly reduced the release of NO and the expression of iNOS, TNF-α, COX2 and IL-1β at the mRNA and protein levels in the brain tissues of Aβ25-35-induced AD mice. In the central nervous system, both microglia and astrocytes express TNF-α, which bind to TNF receptors on neurons, leading to the accumulation of glutamate outside the cell, and produce excitotoxicity [Citation45]. In addition, IL-1β was shown to stimulate the synthesis of precursor Aβ and promote the accumulation of Aβ [Citation46]. Moreover, both TNF-α and IL-1β induce paracrine signaling in astrocytes and microglia, activate inflammatory signaling pathways, induce the generation of inflammatory mediators, cause neuroinflammation and the feedback loop of glial cell activation, and thus amplify neuroinflammation and the generation of neurotoxic molecules [Citation47]. Therefore, inhibition of the production or function of proinflammatory factors are potentially some of the important mechanisms to control neurodegenerative diseases. And our results suggested TG may inhibit NO release by suppressing iNOS expression and inhibits neuroinflammation by reducing the expression of TNF-α, COX2 and IL-1β.
The study also found significantly decreased levels of p-IκBα in the AD group treated with TG compared with the AD model group. NF-κB is a transcription regulator that is widely expressed in eukaryotic cells [Citation48]. Inactive NF-κB also exists in glial cells that function as immune cells in the nervous system [Citation49]. NF-κB is the convergence point of various signaling pathways and plays a role in regulating inflammatory responses, especially in LPS-induced microglia [Citation50,Citation51]. Research has identified that NF-κB binds to the inhibitory protein IκB in the cytoplasm in the form of an inactive dimer that does not regulate gene transcription [Citation52]. The target genes of NF-κB, including TNF-α, IL-6, IL-1β, and iNOS, have been identified [Citation53]. Phosphorylation and degradation of IκBα are necessary for NF-κB activation [Citation54]. Overactivation of NF-κB results in the release of a large number of inflammatory cytokines, which in turn aggravate the inflammatory response [Citation55].Thus our results may suggest that TG exerts an anti-inflammatory effect on AD mouse models by suppressing the phosphorylation of the IκBα protein.
Additionally, it was also revealed in our study that P38 MAPK phosphorylation was significantly increased in the hippocampus of the TG+AG group compared with the AD model group. MAPKs are a class of serine/threonine protein kinases that transmit extracellular signals to the nucleus and induce cell proliferation and differentiation [Citation56]. Three subfamilies of MAPK have been identified: p38 MAPK, c-JUN N-terminal kinases (JNK), and extracellular regulated protein kinases (ERK) 1/2 [Citation57]. Under normal conditions, MAPK is not phosphorylated in cells. Upon stimulation, Ras, MAPKKK, MAPKK, and MAPK are sequentially activated and then cause the phosphorylation and activation of MAPK, transcription factor 2 (TF2), activator protein 1 (AP-1), and NF-κB, which initiate the expression of related cytokines and inflammatory mediators [Citation58]. Among the three subfamilies of MAPK, p38 MAPK was identified as the kinase most related to the inflammatory response. The phosphorylation of p38 MAPK and the expression of TNF-α, IL-1β and iNOS are significantly increased in response to LPS [Citation59]. Furthermore, the production of inflammatory mediators is reduced after p38 MAPK is inhibited [Citation60]. Dan et al [Citation61]. and Gan et al [Citation62]. reported that lycopene or glaucocalyxin B significantly inhibits the LPS-induced phosphorylation or activation of ERK1/2 and p38 MAPK, with the total protein levels of MAPK remaining unchanged, indicating that lycopene or glaucocalyxin B blocks the activation but not the biosynthesis of MAPKs. According to our results, P38 MAPK phosphorylation was significantly increased in the hippocampus of the TG+AG group compared with the AD model group, but total p38 expression was not significantly changed, consistent with previous reports.
Furthermore, this study discovered that the expression level of caspase-1 in the AD+TG group was at significantly lower levels than the AD model group. As a member of the Caspase family, Caspase-1 has been reported to play important roles in regulating cell death and inflammatory reactions [Citation63]. In recent years, Caspase-1 has been shown to play an important role in bacterial meningitis, traumatic brain injury and neurological disorders [Citation64]. Activated caspase-1 cleaves IL-1 and IL-18 precursors, participates in inflammatory reactions, and leads to cell injury and even death. Inhibition of caspase-1 activation reduces the release of inflammatory factors and exerts a neuroprotective effect [Citation65]. Thus our results may suggest that TG exerts a protective effect on AD by inhibiting the expression of caspase-1 and reducing neuronal damage.
Notably, many reports have documented TG-induced liver injury in animal models. For example, at a dose of 15 mg/kg, TG increases the serum levels of alanine transaminase (ALT) and aspartate aminotransferase (AST), hepatic steatosis and hepatocyte necrosis in rats [Citation66]. At a dose of 54.6 mg/kg, TG increases serum ALT and AST levels, edema of liver cells and infiltration of inflammatory cells, and decreases prostaglandin 2 (PGE2), IL-2 and TNF-α levels in inflammatory model mice [Citation67]. The liver toxicity of TG is mainly caused by lipid peroxidation reactions, excessive apoptosis of liver cells, immune injury, changes in liver enzyme activity and abnormal metabolism of fat and glucose [Citation68,Citation69]. However, the manifestations of liver toxicity of TG were similar to those of acute hepatitis, and the incidence of liver injury was not significantly different in groups stratified by sex and age and was closely related to the time and dose. In the present study, we used TG at a dose of 25 mg/kg and found that TG exerted a significant anti-inflammatory effect on the brain of an AD mouse model. The dose of TG is tolerated by mice. In addition, the detoxification effect of Lysimachia christinae Hance [Citation70], Cynanchum otophyllum Schneid [Citation71], and Tribulus terrestris L [Citation72]. on the liver toxicity of TG has widely reported. Thus, the effective dose of TG and the compatibility with traditional Chinese medicine for detoxification must be investigated in the future.
Although we have investigated the effects of TG on the release of inflammatory factors and its molecular mechanism in AD mouse models and AD cell models, the precise molecular mechanism should be confirmed in cell-based experiments. The effective dose of TG and the compatibility with traditional Chinese medicine for detoxification must be investigated in the future.
Conclusions
TG exerts anti-inflammatory and neuroprotective effects by suppressing the activity of microglia, reducing neuronal apoptosis and death, and inhibiting the production of Aβ25-35, p-Tau, IL-1β, NO, iNOS, COX-2 and TNF-α and the phosphorylation of IκBα and p38 MAPK in mouse models of Aβ25-35-induced AD.
Authors’ contributions
Data curation, Methodology, Software, Validation: Xiang Q and Xiang J
Project administration, Funding acquisition: Li JM.
Writing original draft: Tang L
Writing, review & editing: Tang L and Zhang Y.
Ethics approval
This experiment followed the ethical standards and the Declaration of Helsinki, as well as the national and international guidelines. The protocols of these animals followed the National Institutes of Health Guide for the Care and Use of Laboratory Animals. And the research procedures were approved by the Ethics Committee of the Changsha Medical University, China (EC20190114).
Availability of data and material
All data, models, and code generated or used during the study appear in the submitted article.
Disclosure statement
The authors declare that he has no conflict of interest.
Additional information
Funding
References
- Frisoni GB, Boccardi M, Barkhof F, et al. Strategic roadmap for an early diagnosis of Alzheimer’s disease based on biomarkers. Lancet Neurol. 2017;16(8):661–676.
- Chambers DJ, Sebastian J, Ahearn DJ. Parkinson’s disease. BJA Educ. 2017;17(4):145–149.
- Snowden JS. The Neuropsychology of Huntington’s Disease. Arch Clin Neuropsychol. 2017;32(7):876–887.
- Falk I, Jacobson S. Multiple sclerosis. Neuroimmune Pharmacol. 2017;355–364. DOI:10.1056/NEJM200.j009283431307
- Niu H, Álvarez-Álvarez I, Guillén-Grima F, et al. Prevalence and incidence of Alzheimer’s disease in Europe: a meta-analysis. Neurologia. 2017;32(8):523–532.
- Bagyinszky E, Giau VV, Shim K, et al. Role of inflammatory molecules in the Alzheimer’s disease progression and diagnosis. J Neurol Sci. 2017;376:242–254.
- Kliushnik TP, Androsova LV, Mikhaylova NM, et al. Systemic inflammatory markers in age-associated cognitive impairment and Alzheimer’s disease. Neurosci Behav Physiol. 2019;49(3):352–356.
- Kim MS, Kim Y, Choi H. Transfer of a healthy microbiota reduces amyloid and tau pathology in an Alzheimer’s disease animal model. Gut. 2019;69(2):gutjnl-2018-317431.
- Raikwar SP, Thangavel R, Dubova I, et al. Targeted gene editing of Glia maturation factor in Microglia: a novel Alzheimer’s disease therapeutic target. Mol Neurobiol. 2019;56(1):378–393.
- Nesi G, Sestito S, Digiacomo M, et al. Oxidative stress, mitochondrial abnormalities and proteins deposition: multitarget approaches in Alzheimer’s disease. Curr Top Med Chem. 2017;17(27):3062–3079.
- Flemmig J, Zámocký M, Alia A. Amyloid β and free heme: bloody new insights into the pathogenesis of Alzheimer’s disease. Neural Regen Res. 2018;13(7):1170.
- Kamphuis W, Kooijman L, Schetters S. Transcriptional profiling of CD11c-positive microglia accumulating around amyloid plaques in a mouse model for Alzheimer’ s disease. Biochim Biophys Acta (BBA) - Mol Basis Dis. 2016;1862(10):1847–1860.
- Wang LJ, Qiao ZD, Liang DL, et al. Gx-50 reduces β-amyloid-induced TNF-α, IL-1β, NO and PGE2 expression and inhibits NF- κB signaling in a mouse model of Alzheimer’s disease. Eur J Immunol. 2016;197(2):665–676.
- Liu N, Zhuang Y, Zhou Z, et al. NF-κB dependent up-regulation of TRPC6 by Aβ in BV-2 microglia cells increases COX-2 expression and contributes to hippocampus neuron damage. Neurosci Lett. 2017;651:1–8.
- Bu X, Fan J, Hu X, et al. Norwegian scabies in a patient treated with Tripterygium glycoside for rheumatoid arthritis. An.bras.dermatol. 2017;92(4):556–558.
- Lian F, Wang Y, Xu H, et al. Chinese experience with tripterygium wilfordii multiglycoside as long-term maintenance therapy in lupus nephritis. Ann Rheum Dis. 2013;71(Suppl3):675.2–675.
- Liu JH, Li Y, Huang LY, et al. Effects of insulin on intervention therapy of Tripterygium Polyglycoside combine with Nicotinamide in LADA patients. Chin J Mod Med. 2005;15:145–147.
- Zhang X, Xia J, Ye H. Effect of Tripterygium polyglycoside on interleukin-6 in patients with Guillain-Barre syndrome. Zhongguo Zhong XI Yi Jie He Za Zhi. 2000;20(5):332–334.
- Jiang Q, Tang XP, Chen XC. Will Chinese externaltherapy with compound Tripterygium wilfordii hook F gel safely con-trol disease activity in patients with rheumatoidarthritis: design of adouble-blinded randomized controlled trial. BMC Complement Altern Med. 2017;17(1):444.
- Wang M, Chen TG, Yang XL. Effect of tripterygium glycosides on inflammatory factors induced by lipopolysaccharide in rat astrocytes. Chinese J Clin Pharmacol. 2019;35(2):154–158.
- Zheng JH, Zhong JH, Cao HJ, et al. Tripterygium glycosides suppress colitis via NOXs-ROS-NLRP3 inflammatory signaling pathways. Chinese J Pathophysiol. 2016;32(9):1653–1659.
- Wang S, Li R, He S. Tripterygii Radix et Rhizoma glycosides upregulate the new anti-inflammatory cytokine IL-37 through ERK1/2 and p38 MAPK signal pathways. Evid Based Complement Alternat Med. 2017;5:9148523. DOI:10.1155/2017/9148523
- Shan P, Lu Z, Ye L. Effect of Tripterygii Radix et Rhizoma polyglycoside on experimental prostatitis caused byureaplasma urealyticum in rats. Med Sci Monit. 2016;22:3722–3726.
- Choi SY, Lee J, Lee DG. Sanghyun Lee. Acer okamotoanumimproves cognition and memory function in Aβ25-35-induced Alzheimer’ s mice model. Appl Biol Chem. 2017;60(1):1–9.
- Nie Q. Effects of triptolide on the BF-KB expression of the microglial cells and the apoptosis of Hippocampal neurons in the cellular model of AD. Nanchang Uni. 2010;1:1–156.
- Zheng WG, Zhou F, Gao L, et al. Baicalein reduces Aβ-induced PC12 cell damage by inhibiting the JAK2/STAT1 pathway. Acta Pharma Sin. 2021;56(3):771–777.
- Wang M, Chen TG, Yang LX, et al. Effect of tripterygium glycosides on inflammatory factors induced by lipopolysaccharide in rat astrocytes. Chin J Clin Pharmacol. 2019;35(2):154–156.
- Vorhees CV, Williams MT. Morris water maze: procedures for assessing spatial and related forms of learning and memory. Nature Protocol. 2006;1(2):848–858.
- Tang L, Liu L, Li GY, et al. Expression Profiles of Long non-coding RNAs in Intranasal LPS-mediated Alzheimer’s disease model in mice. Biomed Res Int. 2019;9642589. DOI:10.1155/2019/9642589.
- Liu L, Zhang Y, Tang L, et al. The neuroprotective effect of Byu d Mar 25 in LPS-Induced Alzheimer’s disease mice model. Evid Based Complement Alternat Med. 2021;(2021)(5):1–12.
- Stephenson J, Nutma E, Valk PVD, et al. Inflammation in CNS neurodegenerative diseases. Immunology. 2018;154(2):204–219.
- Ju Hwang C, Choi DY, Park MH, et al. NF-kB as a mediator of brain inflammation in AD. CNS Neurol Disord Drug Targets. 2019;18(1):3–10.
- Kllstig E, Mccabe BD, Schneider BL. The links between als and nf-κb. Int J Mol Sci. 2021;22(8):3875.
- Liu X, Zhang L, Yu X. The role of microglia in Alzheimer’s disease. Guocheng Gongcheng Xuebao/Chin J Process Eng. 2018;18(5):900–907.
- Prins JR, Eskandar S, Bjl E, et al. Microglia, the missing link in maternal immune activation and fetal neurodevelopment; and a possible link in preeclampsia and disturbed neurodevelopment? J Reprod Immunol. 2018;126:18.
- Li JJ, Liu SJ, Liu XY, et al. Herbal compounds with special reference to gastrodin as potential therapeutic agents for microglia mediated neuroinflammation. Curr Med Chem. 2018;25(42):5958–5974.
- Wang JY, Lee CT, Wang JY. Nitric oxide plays a dual role in the oxidative injury of cultured rat microglia but not astroglia. Neuroscience. 2014;281(281):164–177.
- Costas-Insua C, Merino-Gracia J, Aicart-Ramos C, et al. Subcellular targeting of nitric oxide synthases mediated by their N-Terminal Motifs. Adv Protein Chem Struct Biol. 2018;111:165–195.
- Chen H, Xu Y, Wang J, et al. Baicalin ameliorates isoproterenol-induced acute myocardial infarction through iNOS, inflammation and oxidative stress in rat. Int J Clin Exp Pathol. 2015;8(9):10139–10147.
- Ding X, Wang D, Li L, et al. Dehydroepiandrosterone ameliorates H2O2-induced Leydig cells oxidation damage and apoptosis through inhibition of ROS production and activation of PI3K/Akt pathways. Int J Biochem Biotechnol. 2016;70:126–139.
- Ji W, Li H, Gao F, et al. Effects of Tripterygium glycosides on interleukin-17 and CD4+CD25+CD127low regulatory T-cell expression in the peripheral blood of patients with ankylosing spondylitis. Biomed Rep. 2014;2(4):517–520.
- Ren J, Wu X, Liao N, et al. Prevention of postoperative recurrence of Crohn’s disease: Tripterygii Radix et Rhizoma polyglycoside versus mesalazine. J Int Med Res. 2013;41(1):176–187.
- Matta R, Wang X, Ge H, et al. Triptolide induces anti-inflammatory cellular responses. Am J Transl Res. 2009;1(3):267–282.
- Ma ZJ, Zhang XN, Li L, et al. Tripterygium glycosides tablet ameliorates renal tubulointerstitial fibrosis via the toll-like receptor 4/nuclear factor Kappa B signaling pathway in high-fat diet fed and streptozotocin-induced diabetic rats. J Diabetes Res. 2015;(2015):1–10.
- Facci L, Barbierato M, Skaper SD. Astrocyte/microglia cocultures as a model to study neuroinflammation. Methods Mol Biol. 2018;1727:127.
- Li L, Xu S, Liu L, et al. Multifunctional compound AD-35 improves cognitive impairment and attenuates the production of TNF-α and IL-1β in an Aβ25–35-induced Rat Model of Alzheimer’s disease. J Alzheimers Dis. 2017;56(4):1403.
- McFarland AJ, Davey AK, McDermott CM, et al. Differences in statin associated neuroprotection corresponds with either decreased production of IL-1β or TNF-α in an, in vitro, model of neuroinflammation-induced neurodegeneration. Toxicol Appl Pharmacol. 2018;344:56–73.
- Liu M, Li Y, Liang B, et al. Hydrogen sulfide attenuates myocardial fibrosis in diabetic rats through the JAK/STAT signaling pathway. Int J Mol Med. 2018;41(4):1867–1876.
- Matsumoto J, Dohgu S, Takata F, et al. TNF-α-sensitive brain pericytes activate microglia by releasing IL-6 through cooperation between IκB-NFκB and JAK-STAT3 pathways. Brain Res. 2018;1692:34–44.
- Jian M, Kwan J, Bunting M, et al. Adiponectin suppresses amyloid-β oligomer (AβO)-induced inflammatory response of microglia via AdipoR1-AMPK-NF-kB signaling pathway. J Neuroinflammation. 2019;16(1):110.
- Park J, Min JS, Kim B, et al. Mitochondrial ROS govern the LPS-induced pro-inflammatory response in microglia cells by regulating MAPK and NF-κB pathways. Neurosci Lett. 2015;584:191–196.
- Priyadarshini L, Aggarwal A. Astaxanthin inhibits cytokines production and inflammatory gene expression by suppressing IκB kinase-dependent nuclear factor κB activation in pre and postpartum Murrah buffaloes during different seasons. Vet World. 2018;11(6):782–788.
- Rhodus NL, Cheng B, Myers S, et al. The feasibility of monitoring NF‐κB associated cytokines: TNF‐α, IL‐1α, IL‐6, and IL‐8 in whole saliva for the malignant transformation of oral lichen planus. Mol Carcinog. 2005;44(2):77–82.
- Lujan DA, Ochoa JL, Hartley RS. Cold-inducible RNA binding protein in cancer and inflammation. Wiley Interdiscip Rev RNA. 2018;9(2):e1462.
- Kim KN, Heo SJ, Yoon WJ, et al. Fucoxanthin inhibits the inflammatory response by suppressing the activation of NF-κB and MAPKs in lipopolysaccharide-induced RAW 264.7 macrophages. Eur J Pharmacol. 2010;649(1–3):369–375.
- Chen S, Ren Z, Yu D, et al. DNA damage‐induced apoptosis and mitogen‐activated protein kinase pathway contribute to the toxicity of dronedarone in hepatic cells. Environ Mol Mutagen. 2018;59(4):278–289.
- Win S, Than TA, Zhang J, et al. New insights into the role and mechanism of c-Jun-N-terminal kinase signaling in the pathobiology of liver diseases. Hepatology. 2018;67(5):2013–2024.
- Pyo H, Jou I, Jung S, et al. Mitogen-activated protein kinases activated by lipopolysaccharide and β-amyloid in cultured rat microglia. NeuroReport. 1998;9(5):871–874.
- Lim JY, Won TJ, Hwang BY, et al. The new diterpene isodojaponin D inhibited LPS-induced microglial activation through NF-kappaB and MAPK signaling pathways. Eur J Pharmacol. 2010;642(1–3):10–18.
- Svensson C, Part K, Künnis-Beres K, et al. Pro-survival effects of JNK and p38 MAPK pathways in LPS-induced activation of BV-2 cells. Biochem Biophys Res Commun. 2011;406(3):488–492.
- Dan F, Ling W-H, Duan R-D. Lycopene suppresses LPS-induced NO and IL-6 production by inhibiting the activation of ERK, p38MAPK, and NF-κB in macrophages. Inflammation Res. 2010;59(2):115–121.
- Gan P, Zhang L, Chen Y, et al. Anti-inflammatory effects of glaucocalyxin B in microglia cells. J Pharmacol Sci. 2015;128(1):35–46.
- Fouad AA, Abdel-Aziz AM, Hamouda A. Diacerein downregulates NLRP3/Caspase-1/IL-1βand IL-6/STAT3 pathways of inflammation and apoptosis in a Rat Model of Cadmium Testicular Toxicity. Biol Trace Elem Res. 2020;195(2):499–505.
- Dieteren S, Franz N, Khler K, et al. Ethyl pyruvate reduces systemic leukocyte activation via caspase-1 and NF-κB after blunt chest trauma and haemorrhagic shock. Front Med (Lausanne). 2020;7:562904.
- Baroja-Mazo A, Compan V, Martín-Sánchez F, et al. Early endosome autoantigen 1 regulates IL-1βrelease upon caspase-1 activation independently of gasdermin D membrane permeabilization[J]. Sci Rep. 2019;9(1):5788.
- Wang XD, Ye T, Jin C, et al. Preliminary study on serum pharmacochemistry of tripterygium glycosides heptotoxicity. Mod Chin Med. 2017;19(3):362–371.
- Feng Q, Luan YF, Sun R. Research development on toxicity of Tripterygium wilfordii related to efficacy and chemical material basis. Chin J Pharmacovigilance. 2013;10(2):88–92.
- Wang J, Miao M, Qu L, et al. Protective effects of geniposide against Tripterygium glycosides (TG)-induced liver injury and its mechanisms. J Toxicol Sci. 2016;41(1):165–173.
- Wang J, Miao M, Zhang Y, et al. Quercetin ameliorates liver injury induced with Tripterygium glycosides by reducing oxidative stress and inflammation. Can J Physiol Pharmacol. 2015;93(6):427–433.
- Wang J, Liu J, Cui Y, et al. Hepatoprotective effects of Lysimachia christinae hance extracts on acute liver injury induced by Tripterygium glycosides in mice. Chin Pharm J. 2013;1:30–34.
- Zhou YL, Zhang L, Liu X. Protective effect of total glucosides of paeony against acute hepatic injury induced by tripterygium glycosides tablet in mice. Tianjin J Traditional Chin Med. 2007;24(1):61–62.
- Cao S, Lu BP, Hu DH. Effect of total Saponins from Tribulus Terrestris on caspase-3 expression of liver tissues in mice with acute liver injury induced by tripterygium glycosides. China J Chin Med. 2011;26(8):951–953.