
 ?Mathematical formulae have been encoded as MathML and are displayed in this HTML version using MathJax in order to improve their display. Uncheck the box to turn MathJax off. This feature requires Javascript. Click on a formula to zoom.
ABSTRACT
Our study aimed to explore potential new diagnostic biomarkers in patients with oral squamous cell carcinoma (OSCC) to find new target molecules involved in the progression of OSCC. Potential novel biomarkers of OSCC were identified using a protein microarray assay. Compared with the healthy control group, there were five proteins (I309, GDF15, AXL, MMP3, and CTACK) in the serum of in situ oral cancer group. However, there were four differentially expressed proteins (MCSF, I309, MMP3, and CTACK) in the serum of the OSCC group. Receiver operating characteristic (ROC) curve analysis results suggested that these six proteins (I309, GDF15, AXL, MMP3, CTACK, and MCSF) had diagnostic value for OSCC. Based on The Cancer Genome Atlas (TCGA) database, we found that only GDF15 expression was associated with the prognosis of OSCC. Subsequently, we verified the expression levels of six proteins in HSC-3 and HaCaT cells, and the results showed that the level of these six proteins was significantly higher in HSC-3 cells than in normal HaCaT cells. Similarly, in the OSCC nude mouse model, the expression levels of these proteins were significantly upregulated in OSCC tumor tissue compared to the normal tissue. GDF15, MMP3, AXL, MCSF, I309, and CTACK may be used as biomarkers for OSCC diagnosis and provide a novel study direction for the treatment of OSCC.
Introduction
Oral squamous cell carcinoma (OSCC) is the sixth most common malignant tumor in the oral cavity, and is a great threat to human health. Approximately 500,000 new cases of oral cancer are diagnosed worldwide each year, most of which are in developing countries [Citation1]. Despite great advances in treatment in the past few decades, the five-year survival rate of OSCC remains only 20–60% due to its recurrence and distant metastasis [Citation2–4]. Since most patients with OSCC are already at an advanced stage at the time of diagnosis, early detection and diagnosis of OSCC is essential for improveing the survival of patients with OSCC [Citation5]. Therefore, it is necessary to clarify the molecular mechanisms related to the carcinogenesis and development of OSCC and define novel biomarkers for predicting OSCC diagnosis, which may help improve treatment outcome.
In recent years, researchers have used genomics, proteomics, metabolomics, and transcriptomics to uncover OSCC biomarkers and obtain a large number of biomarkers [Citation5–8]. Growth differentiation factor 15 (GDF15) is significantly elevated in the serum of OSCC patients, regulates the apoptosis of OSCC cells, is associated with a low survival rate and weakened induced chemotherapy response in OSCC patients, and is considered a potential indicator for the diagnosis of OSCC [Citation9–11]. However, the current understanding of OSCC diagnostic biomarkers is not very clear, and it is still necessary to further systematically study more valuable potential diagnostic biomarkers.
Cytokines can be secreted by various types of cells, such as normal epithelial cells or tumor cells, and are considered essential for the development of the pathophysiology of OSCC [Citation12]. High-throughput protein microarray technology provides a new platform for the discovery of OSCC biomarkers, which are mostly studied in plasma and saliva [Citation13–15]. Recently, the serum proteome has attracted wide attention from researchers, and has been used for screening tumor-related biomarkers in a variety of tumors [Citation16–18]. However, few studies have been conducted on the diagnosis and screening of the serum of patients with OSCC. Therefore, it is of great significance to use protein microarrays to identify potential biomarkers in the serum of patients with OSCC.
This study aimed to explore potential new diagnostic biomarkers for patients with OSCC and to find new target molecules involved in the progression of OSCC. Herein, a protein microarray assay was used to analyze the serum samples of oral carcinoma in situ, oral squamous cell carcinoma patients and healthy controls, and bioinformatics methods were used to determine potential serum diagnostic biomarkers for OSCC. In addition, the key proteins were further verified in OSCC cells and in an OSCC nude mouse model. This study may provide a new theoretical basis for uncovering the potential molecular mechanisms and developing novel diagnostic and therapeutic biomarkers for OSCC.
Materials and methods
Subject enrollment and sample collection
The serum of 50 subjects was collected from 34 patients with OSCC, six patients with oral carcinoma in situ and 10 healthy subjects. The inclusion criteria were as follows: all patients with OSCC and oral carcinoma in situ did not receive chemotherapy or radiotherapy before surgery, and did not take any hormone drugs or immunosuppressive drugs within six months. Patients with other malignant tumors, oral mucosal lesions, or severe systemic diseases were excluded. There was no statistically significant difference in age and sex distribution between patients with OSCC and oral carcinoma in situ patients and healthy controls. Three serum samples were randomly selected from each group of 34 patients with OSCC, 6 patients with oral carcinoma in situ and 10 healthy subjects for the protein microarray assay. All subjects’ clinical characteristics is displayed in . All participants in the experiment carefully read the informed consent and signed the informed consent. The study was approved by the Human Ethics Committee of the Affiliated Stomatological Hospital of Southwest Medical University (approval number: 20180510001).
Table 1. Clinical information of patients was included in this study
Protein microarray assay
For RayBiotech assay (RayBiotech, Norcross, GA, USA), the instructions of the manufacturer’s instructions were strictly followed. In brief, the vitreous chip was equilibrated at room temperature for 20–30 min, then the package was opened and dried for 1–2 h. A sample diluent (100 μL) was added to each well and, incubated in a shaker at room temperature for 1 h, and the antibody chip was sealed and quantified. The diluent was removed from each well, after which, 70 μL serum samples were added to each well, and incubated at 4°C overnight. A plate washer (Thermo Scientific Wellwash Versa) was used to clean the vitreous chip in two steps. Centrifugation was used to detecte the antibody mixture tubule, then added 1.4 ml of sample diluent, mixed evenly, and centrifuged again. Detection antibodies (80 μL) were added to each well and incubated in a shaker for 2 h. After the chip was cleaned, the cy3-streptomyces avidin tubule was centrifuged, and 1.4 mL of sample diluent was added, which was evenly mixed and centrifuged again. Then, 80 µL of Cy3-streptavidin was added to each well and incubated for 1 h on a shaker in the dark. After the chip was cleaned, the signal was detected using aI nnoScan 300 Microarray Scanner (Innopsys, Carbonne, France), and the data analysis software GSH-CAA-440 was used for data analysis. A t-test was used for the difference analysis, and fold changes≥5 times were considered statistically significant.
Correlation analysis
Spearman correlation coefficient analysis [Citation19] was applied to analyze the correlation between GDF15 and significantly different proteins. Correlation coefficients greater than 0.5 were considered as medium correlations, and greater than 0.6 are considered as strong correlations.
Receiver operating characteristic (ROC) curve analyses
To reveal the diagnostic value of significantly different proteins, the ‘pROC’ package was performed to generate ROC [Citation20], and where the area under the ROC curve (AUC) represented the diagnostic value. When AUC value was greater than 0.7 and P < 0.05, the significantly different proteins were considered to be able to distinguish between cases of OSCC and normal controls with good specificity and sensitivity.
Kaplan-Meier analysis and correlation analysis in The Cancer Genome Atlas (TCGA) dataset
The raw data and corresponding clinical information of the RNA-seq sequencing data of 501 OSCC samples were obtained from TCGA dataset. The Kaplan-Meier method was used to illustrate the relationship between the overall survival and gene expression levels of GDF15, MMP3, AXL, MCSF (CSF), I309 (C-C motif chemokine ligand 1; CCL1) and CTACK (C-C motif chemokine ligand 27; CCL27). According to the median expression value, all OSCC samples were divided into two groups: high expression group and low expression group. The Kaplan–Meier survival curve combined with a log-rank test was used to compare the survival difference of these genes in high expression group and low expression group using the R package v4.0.3. The survival diagram, risk heat diagram, P value and risk ratio (HR) with 95% confidence interval (CI) between the high expression group and low expression group were obtained by log rank test and univariate Cox proportional hazard regression, and P < 0.05 was statistically significant. The Spearman correlation analysis between MMP3, AXL, MCSF (CSF), I309 (CCL1) and CTACK (CCL27) and GDF15 was performed using the ggstatsplot package in R software [Citation21], and P < 0.05 was statistically significant.
Cell culture
Human OSCC cells HSC-3 and human immortalized keratinocytes HaCaT were purchased from Otwo Biotech Inc. (Shenzhen, China) and Zhongqiaoxinzhou Biotech (Shanghai, China), respectively. These cells were cultured in Dulbecco’s Modified Eagle’s Medium (DMEM) (# SH30021.01, HyClone, Logan, UT, USA) containing 10% fetal bovine serum (# 11,011–8611, Tianhang, Hangzhou, China) and 1% penicillin/streptomycinin a sterile atmosphere at 37°C with humidified 5% CO2 [Citation22].
Immunofluorescence staining
HSC-3 and HaCaT cells were cultured on sterilized round glass coverslips. Cells were fixed with 10% paraformaldehyde for 10 min, washed with PBS, and then incubated with deionized hydrogen peroxide to block endogenous peroxidase for 10 min. Subsequently, the cells incubated with antibodies against GDF15 (# bs-3818 R, Bioss, Woburn, Massachusetts, USA), MMP3 (# bs-0413 R, Bioss), AXL (# bs-5180 R, Bioss), MCSF, I309 (# bs-10,710 R, Bioss) and CTACK (#bs-20,466 R, Bioss) overnight at 4°C. After being washed, the HSC-3 cells were then incubated with FITC-conjugated secondary antibodies for 30 min at room temperature. At the same time, HaCaT cells were incubated with Rhodamine-conjugated secondary antibodies (# bs-40,295 G-HRP, Bioss). After washing with PBS, Cell nuclei were counterstained with DAPI (# C0060, Solarbio, Beijing, China) at room temperature for 10 min in the dark. Following the final washing step, the fluorescence signals were visualized using a laser scanning confocal microscope (Olympus, Tokyo, Japan).
In vivo tumorigenesis assay
Twelve male BALB/c nude mouse (12 g, aged 3 weeks; License No.: SCXK (Sichuan) 2015–030) were obtained from Chengdu Dossy Experimental Animals Co., Ltd. (Chengdu, China) and maintained at the Animal Experiment Center, School of Pharmacy, Southwest Medical University. All procedures carried out in this animal study were approved by the Ethics Committee of Experimental Animals of Southwest Medical University. HSC-3 cells (1 × 10⁷) in 200 mL of DMED were injected subcutaneously into the flanks of mouse (n = 6). The nude mouse in the control group (n = 6) were injected with the same amount of sterile normal saline. The size of the tumor was calculated using a Vernier caliper every 3 days. After 8 weeks, the mouse were sacrificed, and tumors specimens were isolated for histological and immunohistochemical staining, as well as for western blot analysis.
Histological evaluation
The harvested tumor tissues were immersed in a 4% buffered paraformaldehyde solution, dehydrated, embedded in paraffin, and then cut into 4 μm thick sections. The sections were subjected to hematoxylin and eosin (HE) staining. Then, the sections were dehydrated and the film was sealed with neutral gum. Finally, the results were visualized and photographed using a light microscope (Olympus, Tokyo, Japan).
Immunohistochemical staining
The tissues were dewaxed and boiled in citric acid. Then, the activity of endogenous peroxidases was blocked using 3% hydrogen peroxide for 10 min. Subsequently, the sections were incubated with antibodies against GDF15, MMP3, AXL, MCSF, I309 and CTACK overnight at 4°C. The next day, the slides were washed with PBS and incubated with secondary antibodies that had been labeled with biotin for 15 min at 37°C. After washing, the sections were incubated with the HRP complex for 15 min at 37°C and visualized using diaminobenzidine (DAB) (# D10294, Bioss). The nuclei were then stained with hematoxylin and differentiated with 0.5% alcohol hydrochloride. After that, the slides were placed in a gradient of ethanol and xylene for dehydration. Finally, the slides were sealed, dried, and visualized under a light microscope.
For immunohistochemical staining, HSC-3 and HaCaT cells were cultured on sterilized round glass cover slips. Cells were fixed with 10% paraformaldehyde for 10 min, washed with PBS, and then incubated with deionized hydrogen peroxide to block endogenous peroxidase activity for 10 min. The rest of the steps were the same as those performed for the immunohistochemical staining of tissue.
Western blotting
Total proteins from tumor tissues and cells were extracted using RIPA lysis buffer (# R0020, Solarbio, Beijing, China), and protein concentrations were evaluated using BCA protein assay kit (# PC0020, Solarbio, Beijing, China). In total, proteins were separated by SDS-PAGE and then transferred onto PVDF membranes (# IPFL00010, Millipore, Billerica, MA, USA). The membranes were blocked with 5% nonfat milk for 1 h and incubated with primary antibodies at 4°C overnight. After washing with TBST, secondary antibody incubations were performed at room temperature for 2 h. The bands were detected by chemiluminescence using ECL Plus (# PE0010, Solarbio, Beijing, China) according to the manufacturer’s instructions.
Statistical analysis
Data are exhibited as mean± standard deviation and analyzed using the t-test. Statistical analysis was performed with SPSS version 20.0 and GraphPad Prism version 8.0.2. Statistical significance was set at P < 0.05.
Results
In this study, potential biomarkers of OSCC were identified using a protein microarray assay. Serum levels of six proteins (I309, GDF15, AXL, MMP3, MCSF and CTACK) in the oral cancer group were higher than those in the normal group. These six proteins have diagnostic value for OSCC. Based on TCGA database, we found that only GDF15 expression was associated with the prognosis of OSCC. Subsequent cellular level verification showed that these six proteins were significantly higher in HSC-3 cells than in normal HaCaT cells. In a nude mouse model of OSCC, the results showed that the expression levels of these proteins were significantly upregulated in OSCC tumor tissues compared to normal tissues. These biomarkers could thus serve as novel prognostic biomarkers and potential therapeutic targets for OSCC.
Protein microarray assay
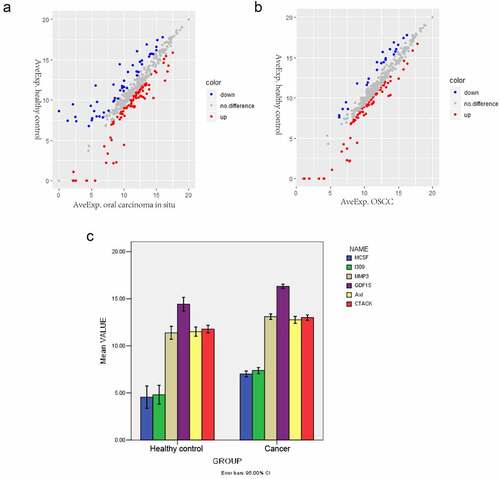
Differentially expressed proteins were screened with an expression fold change≥5 and P < 0.05. The scatter plot of all differentially expressed proteins in oral carcinoma in situ and OSCC groups is shown on ), respectively. A total of five proteins were elevated in the serum of oral carcinoma in situ group compared with the healthy controls group, including I309, GDF15, AXL, MMP3 and CTACK (). Compared with the healthy control group, four differentially expressed proteins were upregulated in the serum of the OSCC group, including MCSF, I309, MMP3 and CTACK ().
Table 2. Differentially expressed proteins between oral carcinoma in situ and healthy control
Table 3. Differentially expressed proteins between OSCC and healthy control
Figure 1. Differentially expressed proteins in oral carcinoma in situ and OSCC. (a) Scatter plots of differentially expressed proteins between the oral carcinoma in situ group and the healthy control group. Red and Blue color indicated up- and down-regulation, respectively. (b) Scatter plots of differentially expressed proteins between the OSCC and the healthy control group. Red and Blue color indicated up- and down-regulation, respectively. (c) Comparison of the mean values of the significantly changed proteins between the cancer group and control normal group. The x-axis shows healthy control and cancer groups and y-axis shows mean values
Correlation analysis
Next, we analyzed the association between GDF15 and five other significantly differentially expression proteins (MCSF, I309, MMP3, AXL and CTACK), and the results indicated that the above five proteins were positively correlated with GDF15 (P < 0.005), among which MCSF, I309 and MMP3 were strongly correlated with GDF15, AXL and CTACK were moderately correlated with GDF15 (). A comparison of the mean values of the significantly changed proteins between the cancer and control groups is shown in .
Table 4. Correlation analysis between GDF15 and differentially expressed proteins
ROC curve analyses
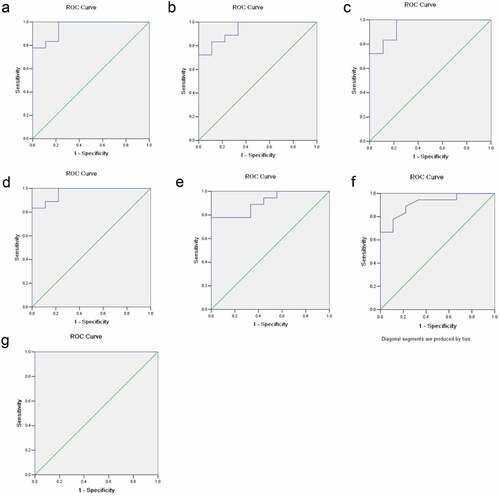
The ROC curve analysis further evaluated the diagnostic value of serum GDF15, MCSF, I309, MMP3, CTACK and AXL for OSCC. The results showed that the expression levels of GDF15, MCSF, I309, MMP3, CTACK and AXL in serum could effectively distinguish OSCC patients from the control group (). The AUC of the combination of these six proteins was >1, which indicated that the combination of these six proteins was associated with OSCC and served a potential role in predicting the occurrence of OSCC. As shown in , the AUC of the GDF15, MCSF, I309, MMP3, CTACK and AXL were 0.957, 0.938, 0.951, 0.969, 0.914 and 0.907, respectively.
Table 5. The results of diagnostic efficiency analysis
Figure 2. ROC curve analyses. The x-axis indicated specificity and y-axis indicated sensitivity. (a) GDF15. (b) MCSF. (c) I309. (d) MMP3. (f) CTACK. (e) AXL. (g) The combination of these six proteins
Kaplan-Meier analysis and correlation analysis in TCGA dataset
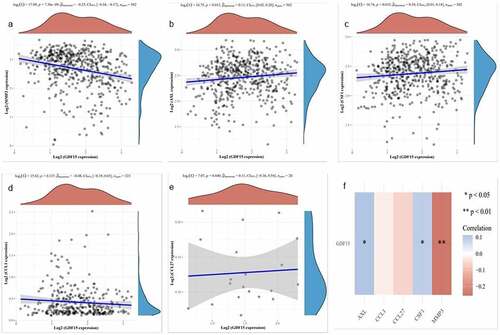
Based on TCGA data, we evaluated the prognostic value of these six genes in OSCC and found that only GDF15 expression was associated with the prognosis of OSCC (). The risk score distribution, survival status, and cluster analysis of GDF15 are presented in . As shown in , there was a significant difference (P = 0.04; HR = 1.324) in survival rate between the GDF15 high expression and low expression groups, indicating that GDF15 was a risk factor for OSCC, and the number of deaths in patients with OSCC increased with an increase in GDF15 expression. Subsequently, the spearman correlation analysis between these five genes and GDF15 was performed, and it was found that except for I309 and CTACK, the expression of other genes was correlated with the expression of GDF15, among which AXL and MCSF were positively correlated with GDF15, while MMP3 was negatively correlated with GDF15 ().
Figure 3. Kaplan-Meier analysis in TCGA dataset. (a) Risk score distribution, survival overview, and hierarchical clustering for OSCC patients in TCGA cohort. (b) The overall survival curves of the GDF15 high expression and low expression groups in TCGA cohort
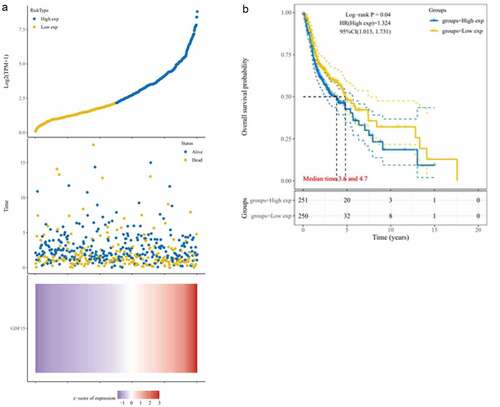
Figure 4. Correlation analysis in TCGA dataset. (a) MMP3. (b) AXL. (c) MCSF. (d) I309. (e) CTACK. The X axis represents the expression distribution of GDF15, and the Y axis ordinate represents the expression distribution of MMP3, AXL, MCSF (CSF), I309 and CTACK, respectively. The density curve on the upper side is the distribution trend of GDF15, and the density curve on the right represents the distribution trend of MMP3, AXL, MCSF (CSF), I309 (CCL1) and CTACK (CCL27), respectively. (f) Correlation analysis between each gene and GDF15. Red represents a positive correlation, blue represents a negative correlation, the darker the color is, the stronger the correlation between the two, *P < 0.05, **P < 0.01
Verification of the expression of key proteins in OSCC cells
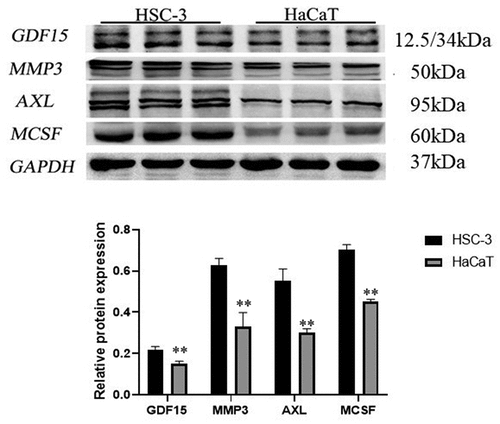
In order to uncover the expression of GDF15, MMP3, AXL, MCSF, I309 and CTACK in HSC-3 and HaCaT cells, we performed immunofluorescence staining and immunohistochemical analysis. The results showed that these six proteins were significantly higher in HSC-3 cells than in normal HaCaT cells (). The average optical densities (AOD) in immunohistochemical analysis of GDF15, MMP3, AXL, MCSF, I309 and CTACK in HSC-3 cells were 0.4696 ± 0.0519, 0.3911 ± 0.0385, 0.5154 ± 0.0818, 0.4603 ± 0.1116, 0.2910 ± 0.04578, and 0.4391 ± 0.0348, respectively (). The AOD of GDF15, MMP3, AXL, MCSF, I309 and CTACK in HaCaT cells were 0.3345 ± 0.0454, 0.2980 ± 0.0138, 0.2762 ± 0.0102, 0.3245 ± 0.04049, 0.2910 ± 0.04578, and 0.3247 ± 0.0490, respectively (). Moreover, western blotting was used to further detect the expression levels of these six proteins, and the results showed that the expression levels of these six proteins were significantly upregulated in HSC-3 cells compared with normal HaCaT cells (). Taken together, the results indicated that the expression levels of these six proteins were consistent with those of the protein microarray analysis, which increased the reliability of our protein microarray.
Table 6. The mean optical density of the immunohistochemical staining of cells
Figure 5. Immunofluorescence staining of key proteins in HSC-3 and HaCaT cells. The cytoplasm of HSC-3 cells was stained with green fluorescence, and the cytoplasm of HaCaT cells was stained with red fluorescence. The nuclei were stained blue with DAPI
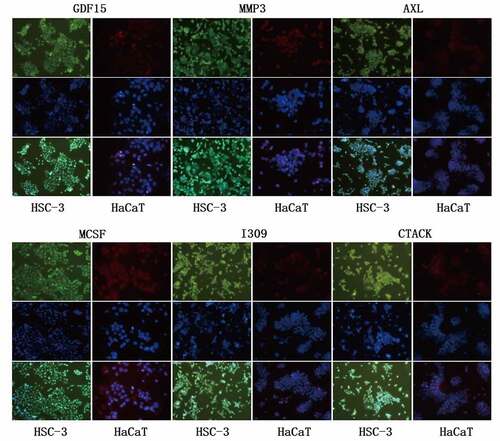
Figure 6. Immunohistochemical analysis of key proteins in HSC-3 and HaCaT cells
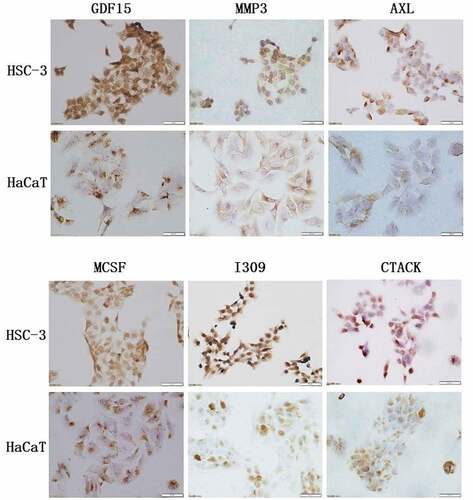
Figure 7. Western blot of key proteins in HSC-3 and HaCaT cells. The expression level of GDF15, MCSF, I309, MMP3, CTACK and AXL was detected by western blotting and its quantification in HSC-3 and HaCaT cells
Verification of the expression of key proteins in nude mouse
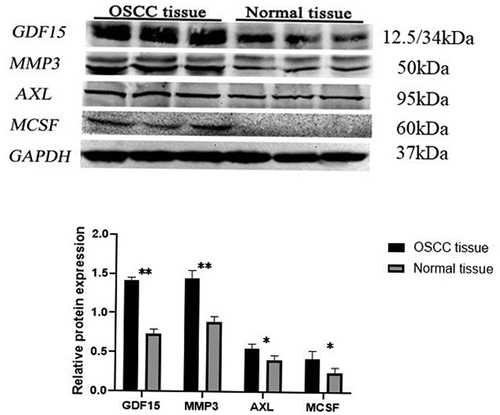
We built an OSCC nude mouse model to further verify the expression of GDF15, MMP3, AXL, MCSF, I309 and CTACK. As shown in , we successfully constructed a model of OSCC in nude mouse, and the tumors in the experimental group were significantly larger than those in the control group. The results of HE staining are displayed in the . The results of immunohistochemical analysis showed that these six proteins were significantly higher in the experimental group than in normal group (). AOD of GDF15, MMP3, AXL, MCSF, I309 and CTACK in tumor tissue of nude mouse were 0.4657 ± 0.0291, 0.3661 ± 0.1076, 0.4190 ± 0.0669, 0.6044 ± 0.0526, 0.4656 ± 0.0634, and 0.3641 ± 0.0225, respectively (). AOD of GDF15, MMP3, AXL, MCSF, I309 and CTACK in normal tissue were 0.3381 ± 0.0130, 0.2845 ± 0.0334, 0.3523 ± 0.0254, 0.3522 ± 0.0255, 0.3459 ± 0.0282, and 0.3035 ± 0.0273, respectively (). Finally, western blotting was used to further verify the expression levels of these six proteins, and the results indicated that the expression levels of these six proteins were significantly upregulated in tumor tissue compared with normal tissue ().
Table 7. The mean optical density of the immunohistochemical staining of tissues
Figure 8. In vivo tumorigenesis assay and histological evaluation. (a) In vivo tumorigenesis assay: (a) Tumor formation of nude mouse in experimental group. (b) The general view of tissue sampling in nude mouse. (c) The general view of tissue sampling in control group. (B) Histological evaluation: (a) HE staining of OSCC tumor tissues in nude mouse. (b) HE staining of normal tissues in control group. (n = 6)
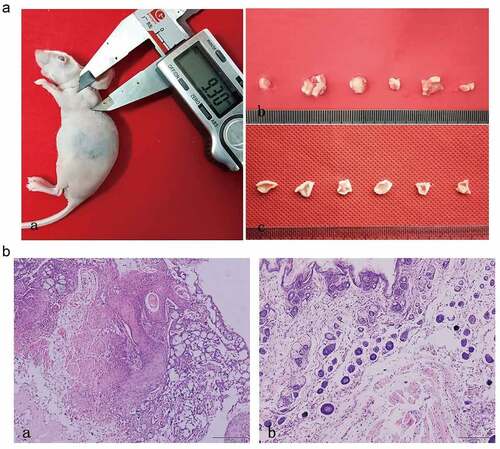
Figure 9. Immunohistochemical analysis of key proteins in OSCC nude mouse
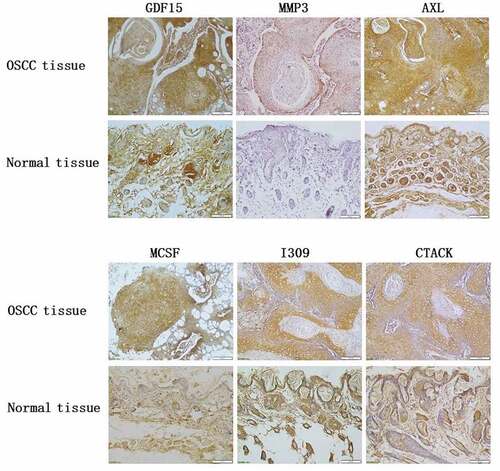
Figure 10. Western blot of key proteins in OSCC nude mouse. The expression level of GDF15, MCSF, I309, MMP3, CTACK and AXL was detected by western blotting and its quantification in OSCC nude mouse tumor tissue and normal tissue
Discussion
Traditional tumor diagnosis methods require pathological biopsy for confirmation, which is time-consuming and physically invasive, causing great pain to the patient, resulting in poor patient compliance and failure to receive effective treatment in a timely manner, ultimately leading to poor prognosis and low survival rate. Peripheral blood could be used as a source of specific biomarkers, providing key clues for the screening and diagnosis of malignant tumor [Citation23]. Serum is the most commonly used biological sample in this type of study because it is easily available, noninvasive, and generally acceptable [Citation14,Citation16,Citation17]. Early diagnosis of OSCC requires the development of cancer diagnostic markers with sufficiently high sensitivity and specificity [Citation24]. Therefore, it is imperative to diagnose and screen OSCC serum samples. In this study, the Ray Biotech protein microarray assay was used to screen the biological markers in the serum of patients with OSCC, and the results showed that the levels of GDF15, MCSF, I309, MMP3, CTACK, and AXL in the serum were significantly increased. GDF15 is a member of the TGF-β superfamily, which plays an important role in many diseases, including cancer. GDF15 is significantly elevated in the serum of OSCC, regulates the apoptosis of OSCC cells, and is considered a potential indicator for the diagnosis of OSCC [Citation9–11]. GDF15 has been reported to be a prognostic and predictive marker of 5-fluorouracil-induced chemotherapy for locally advanced OSCC, and GDF15 can also promote the development of OSCC through phosphorylation of AKT and ERK1/2 [Citation25].
Next, we studied the correlation between the above proteins and GDF15. Among them, MCSF, I309, MMP3, CTACK, and AXL were moderately correlated with GDF15. Using the TCGA dataset, Spearman correlation analysis was used to detect the association among the protein markers. Interestingly, except for I309 and CTACK, the expression of other genes was correlated with the expression of GDF15, among which AXL and MCSF were positively correlated with GDF15, while MMP3 was negatively correlated with GDF15. This difference in protein microarray analysis and TCGA data can be partly explained by the different study levels and the different number of study samples used. Ultimately, the expression of GDF15, MCSF, I309, MMP3, CTACK, and AXL was also successfully confirmed in OSCC cells and the OSCC nude mouse model.
Matrix metalloproteinase 3 (MMP3), a member of the matrix metalloproteinase family, promotes angiogenesis, invasion and metastasis of cancer cells by degrading the extracellular matrix [Citation26,Citation27]. MMP3 is significantly elevated in the serum and saliva of patients with oral lichen planus and OSCC [Citation28]. MiR-519d, as a tumor suppressor gene of OSCC, can directly target and regulate MMP3, which is negatively correlated with the expression of miR-519d, while the high expression of MMP3 is correlated with metastasis and poor prognosis of patients with OSCC [Citation27]. The serum MMP3 level in OSCC patients was higher than that in healthy controls, and MMP3 may have a potential role in the pathogenesis of OSCC [Citation26]. MMP3 is significantly expressed in human OSCC, and its expression is related to poor clinical prognostic factors and decreased survival rate [Citation29]. Our protein microarray assay results indicated that MMP3 was significantly upregulated in the serum of the cancer group, and had a good diagnostic value. Based on the validation results, MMP3 was also significantly upregulated in OSCC cells and in OSCC nude mouse tumor tissue, indicating that MMP3 was of great significance for the early diagnosis of OSCC and clinical prognosis analysis.
AXL, a member of the TAM family of receptor tyrosine kinases, is highly expressed in various cancers and regulates the growth, proliferation, metastasis, invasion and anti-apoptosis of tumor cells in a variety of ways, and mediates epithelial mesenchymal transformation to promote the generation of tumor blood vessels [Citation30]. The combination of AXL and growth arrest-specific protein 6 can promote the expression of anti-apoptotic proteins by activating the downstream PI3K/protein kinase B pathway [Citation31]. AXL is persistently overexpressed in OSCC cell lines and human tumor samples, and knockdown of AXL suppresses cell survival, proliferation, migration, and invasion in vitro, as well as esophageal tumor growth in vivo [Citation32]. AXL expression is related to the lymph node status and clinical stage of OSCC, and patients with high AXL expression have a poorer prognosis than patients with low AXL expression [Citation33]. Protein S regulates the proliferation, survival and migration of oral OSCC cells by regulating AXL, and AXL may be a potential novel anti-cancer therapeutic target [Citation34]. MiR-34a-5p regulates OSCC cell migration by regulating AXL via the AKT/GSK-3β/β-catenin/Snail signaling cascade [Citation35]. In our study, AXL level was markedly increased in the serum of the cancer group, and had a good diagnostic value. Our validation results found that AXL was significantly increased in OSCC cells and in OSCC nude mouse tumor tissue, indicating that AXL may be used as a reliable indicator for the early diagnosis of OSCC and provide direction for research on OSCC targeted therapy and anti-tumor drug resistance.
Macrophage colony stimulating factor (MCSF), a homodimer hydrolyzed by precursor protein, plays an important role in immune regulation, regulates macrophage proliferation and differentiation, and can initiate and enhance macrophage killing [Citation36,Citation37]. MCSF can induce the aggregation of M2 tumor-associated macrophages with CD68+ and CD163+ as the characteristic phenotype, and recruit infiltrating immune cells to promote the proliferation, invasion and metastasis of cancer cells [Citation38]. Granulocyte macrophage colony stimulating factor (GMCSF) is a cytokine that activates both granulocyte and macrophage lineages and has been reported to be involved in cell cycle regulation [Citation39,Citation40]. Unc-93 homolog B1 has been reported to promote OSCC tumor growth by regulating the secretion of GMCSF [Citation41]. Human chemokine I309 belongs to the CC chemokine family, is secreted by activated T cells, can chemoattract monocytes and T cells, and participate in T cell proliferation, asthma and other pathological reactions [Citation42,Citation43]. Cutaneous T cell attracting chemokine (CTACK) is produced by epidermal keratinocytes and is considered an important factors regulating skin development and keratinocyte differentiation [Citation44]. CTACK was upregulated in the serum of patients with non-small-cell lung cancer and is considered to be a new auxiliary biomarker for the diagnosis and prognosis of non-small-cell lung cancer [Citation45]. It is reported that CTACK and its homologous CCL28 can affect the remodeling of tumor lymphatic vessels and play an important role in the metastasis of tumor [Citation46]. To the best of our knowledge, this is the first report of MCSF, I309, and CTACK in OSCC and their biological functions remain unclear. In this study, MCSF, I309, and CTACK levels were significantly increased in the serum of the cancer group, and had a good diagnostic value. According to the validation results, MCSF, I309 and CTACK were also significantly upregulated in OSCC cells and in OSCC nude mouse tumor tissue, suggesting that MCSF, CTACK, and I390 may be potentially new diagnostic markers in the serum of OSCC.
In this study, six significantly different proteins (GDF15, MCSF, I309, MMP3, CTACK, and AXL) were screened from the serum of oral cancer group and normal groups using a protein microarray assay. Among these, GDF15, MMP3, and AXL have been widely studied in OSCC and may be important diagnostic biomarkers for OSCC. Our study showed that MCSF, I309 and CTACK had important potential in the early diagnosis of OSCC, but the specific mechanisms need to be further studied. We also found that the combined value of the six proteins was higher in the diagnosis of OSCC than in a single protein. We found that only GDF15 was associated with the prognosis of OSCC, and there was a significant difference in survival rate between GDF15 high expression and low expression groups. Spearman correlation analysis uncovered that the expression of AXL, MCSF, and MMP3 was correlated with the expression of GDF15. The expression of GDF15, MCSF, I309, MMP3, CTACK, and AXL was also confirmed in OSCC cells and the OSCC nude mouse model. However, whether the combination of the above six proteins can be used to diagnose OSCC is unknown, and a large amount of experimental evidence is needed. Our study aims to systematically screen out potential biomarkers in OSCC serum, provide novel ideas for clinical assistance in early diagnosis and prognosis analysis of clinical treatment, and further provide new targets for the treatment of OSCC.
Conclusion
In this study, we identified six biomarkers (GDF15, MCSF, I309, MMP3, CTACK, and AXL) that were associated with the diagnosis of patients with OSCC. These biomarkers are novel prognostic biomarkers and potential therapeutic targets for OSCC.
Limitation
The current study has some limitations. First, this study lacks clinical sample validation. A large clinical sample size is required to determine the expression and clinicopathological significance of GDF15, MCSF, I309, MMP3, CTACK and AXL in OSCC. Second, the roles and mechanisms of GDF15, MCSF, I309, MMP3, CTACK and AXL in OSCC are still unclear. Therefore, a large number of in vivo and in vitro experiments are needed to demonstrate the function and mechanism of these proteins.
Future direction
In the future, we plan to first validate the expression of GDF15, MCSF, I309, MMP3, CTACK and AXL in a large number of OSCC patient samples, and further study the biological significance of GDF15, MCSF, I309, MMP3, CTACK and AXL in animal models or cell lines. We are collecting OSCC samples to verify the expression of GDF15, MCSF, I309, MMP3, CTACK and AXL in subsequent studies and their clinicopathological significance in OSCC. Then, the roles and mechanisms of GDF15, MCSF, I309, MMP3, CTACK and AXL are revealed in animal models or cell lines. These studies may help to understand the pathogenesis of OSCC and identify potential targets for treating OSCC.
Highlights
The study aimed to find novel biomarkers of oral squamous cell carcinoma (OSCC).
Six proteins showed diagnostic value in OSCC.
GDF15 was associated with the prognosis of OSCC.
The six proteins were significantly upregulated in HSC-3 compared to HaCaT cells.
Their levels were elevated in OSCC mouse tumor tissues compared to normal tissues.
Author contributions
Xuqian Liu and Minhai Nie contributed to the conception of the study. Mengxue Zhang, Xiao Chen, He Chen and Minyue Zhou contributed the materials and performed the experiment. Yaoqiang Liu and Yali Hou performed the data analyses. Xuqian Liu, Minhai Nie, Mengxue Zhang and Xiao Chen contributed significantly in writing the manuscript. All authors read and approved the final manuscript.
Disclosure statement
No potential conflict of interest was reported by the author(s).
Data availability statement
The data used and analyzed during the current study available from the corresponding author on reasonable request.
Additional information
Funding
References
- Sathiyasekar AC, Chandrasekar P, Pakash A, et al. Overview of immunology of oral squamous cell carcinoma. J Pharm Bioallied Sci. 2016;8:S8–s12.
- Huang GZ, Wu QQ, Zheng ZN, et al. Identification of candidate biomarkers and analysis of prognostic values in oral squamous cell carcinoma. Front Oncol. 2019;9:1054.
- Cao R, Wu Q, Li Q, et al. A 3-mRNA-based prognostic signature of survival in oral squamous cell carcinoma. PeerJ. 2019;7:e7360.
- Feng X, Luo Q, Wang H, et al. MicroRNA-22 suppresses cell proliferation, migration and invasion in oral squamous cell carcinoma by targeting NLRP3. J Cell Physiol. 2018;233(9):6705–6713.
- Zhao X, Sun S, Zeng X, et al. Expression profiles analysis identifies a novel three-mRNA signature to predict overall survival in oral squamous cell carcinoma. Am J Cancer Res. 2018;8:450–461.
- Dickinson A, Saraswat M, Mäkitie A, et al. Label-free tissue proteomics can classify oral squamous cell carcinoma from healthy tissue in a stage-specific manner. Oral Oncol. 2018;86:206–215.
- Sridharan G, Ramani P, Patankar S. Serum metabolomics in oral leukoplakia and oral squamous cell carcinoma. J Cancer Res Ther. 2017;13:556–561.
- Xu C, Wang P, Liu Y, et al. Integrative genomics in combination with RNA interference identifies prognostic and functionally relevant gene targets for oral squamous cell carcinoma. PLoS Genet. 2013;9(1):e1003169.
- Schiegnitz E, Kämmerer PW, Koch FP, et al. GDF 15 as an anti-apoptotic, diagnostic and prognostic marker in oral squamous cell carcinoma. Oral Oncol. 2012;48(7):608–614.
- Ma J, Tang X, Sun WW, et al. Mutant GDF15 presents a poor prognostic outcome for patients with oral squamous cell carcinoma. Oncotarget. 2016;7(2):2113–2122.
- Tang X, Hu YJ, Ju WT, et al. Elevated growth differentiating factor 15 expression predicts long-term benefit of docetaxel, cisplatin and 5-fluorouracil induction chemotherapy in patients with oral cancer. Oncol Lett. 2018;15:8118–8124.
- Schiegnitz E, Kämmerer PW, Schön H, et al. Proinflammatory cytokines as serum biomarker in oral carcinoma-A prospective multi-biomarker approach. J Oral Pathol Med. 2018;47(3):268–274.
- Ni YH, Ding L, Hu QG, et al. Potential biomarkers for oral squamous cell carcinoma: proteomics discovery and clinical validation. Proteomics Clin Appl. 2015;9(1–2):86–97.
- Chu HW, Chang KP, Hsu CW, et al. Identification of salivary biomarkers for oral cancer detection with untargeted and targeted quantitative proteomics approaches. Mol Cell Proteomics. 2019;18(9):1796–1806.
- Tung CL, Lin ST, Chou HC, et al. Proteomics-based identification of plasma biomarkers in oral squamous cell carcinoma. J Pharm Biomed Anal. 2013;75:7–17.
- Boccellino M, Pinto F, Ieluzzi V, et al. Proteomics analysis of human serum of patients with non-small-cell lung cancer reveals proteins as diagnostic biomarker candidates. J Cell Physiol. 2019;234(12):23798–23806.
- Kohli M, Oberg AL, Mahoney DW, et al. Serum proteomics on the basis of discovery of predictive biomarkers of response to androgen deprivation therapy in advanced prostate cancer. Clin Genitourin Cancer. 2019;17(4):e7.
- Ahn SB, Sharma S, Mohamedali A, et al. Potential early clinical stage colorectal cancer diagnosis using a proteomics blood test panel. Clin Proteomics. 2019;16(1):34.
- Guo Y, Sheng Q, Li J, et al.Samuels DC, Shyr Y. Large scale comparison of gene expression levels by microarrays and RNAseq using TCGA data. PLoS One. 2013;8(8):e71462.
- (2010) pROC-package.
- Patil I (2018) ‘ggplot2ʹ based plots with statistical details [R package ggstatsplot version 0.0.1].
- Han HY, Kim HJ, Jeong SH, et al. The flavonoid jaceosidin from artemisia princeps induces apoptotic cell death and inhibits the akt pathway in oral cancer cells. Evid Based Complement Alternat Med. 2018;2018:5765047.
- Necula L, Matei L, Dragu D, et al. Recent advances in gastric cancer early diagnosis. World J Gastroenterol. 2019;25(17):2029–2044.
- Santosh AB, Jones T, Harvey J. A review on oral cancer biomarkers: understanding the past and learning from the present. J Cancer Res Ther. 2016;12(2):486–492.
- Yang CZ, Ma J, Zhu DW, et al. GDF15 is a potential predictive biomarker for TPF induction chemotherapy and promotes tumorigenesis and progression in oral squamous cell carcinoma. Ann Oncol. 2014;25(6):1215–1222.
- Andisheh-Tadbir A, Khademi B, Kamali F, et al. Upregulation of serum vascular endothelial growth factor and matrix metalloproteinase-3 in patients with oral squamous cell carcinoma. Tumor Biol. 2014;35(6):5689–5693.
- Jin Y, Li Y, Wang X, et al. Dysregulation of MiR-519d affects oral squamous cell carcinoma invasion and metastasis by targeting MMP3. J Cancer. 2019;10(12):2720–2734.
- Mirzaii-Dizgah I, Mirzaii-Dizgah I, Mahboobi N, et al. Serum and Saliva MMP-3 in patients with OLP and oral SCC. J Contemp Dent Pract. 2015;16(2):107–111.
- Li HX, Zheng JH, Fan HX, et al. Expression of αvβ6 integrin and collagen fibre in oral squamous cell carcinoma: association with clinical outcomes and prognostic implications. J Oral Pathol Med. 2013;42(7):547–556.
- Gay CM, Balaji K, Byers LA. Giving AXL the axe: targeting AXL in human malignancy. Br J Cancer. 2017;116(4):415–423.
- Chiu KC, Lee CH, Liu SY, et al. Polarization of tumor-associated macrophages and Gas6/Axl signaling in oral squamous cell carcinoma. Oral Oncol. 2015;51(7):683–689.
- Paccez JD, Duncan K, Vava A, et al. Inactivation of GSK3β and activation of NF-κB pathway via Axl represents an important mediator of tumorigenesis in esophageal squamous cell carcinoma. Mol Biol Cell. 2015;26(5):821–831.
- Lee CH, Yen CY, Liu SY, et al. Axl is a prognostic marker in oral squamous cell carcinoma. Ann Surg Oncol. 2012;19(Suppl S3):S500–8.
- Abboud-Jarrous G, Priya S, Maimon A, et al. Protein S drives oral squamous cell carcinoma tumorigenicity through regulation of AXL. Oncotarget. 2017;8(8):13986–14002.
- Li YY, Tao YW, Gao S, et al. Cancer-associated fibroblasts contribute to oral cancer cells proliferation and metastasis via exosome-mediated paracrine miR-34a-5p. EBioMedicine. 2018;36:209–220.
- Rojo R, Pridans C, Langlais D, et al. Transcriptional mechanisms that control expression of the macrophage colony-stimulating factor receptor locus. Clin Sci. 2017;131(16):2161–2182.
- Bonelli S, Geeraerts X, Bolli E, et al. Beyond the M-CSF receptor - novel therapeutic targets in tumor-associated macrophages. FEBS J. 2018;285(4):777–787.
- Chen XJ, Han LF, Wu XG, et al. Clinical Significance of CD163+ and CD68+ tumor-associated macrophages in high-risk HPV-related cervical cancer. J Cancer. 2017;8(18):3868–3875.
- Qiu C, Xie Q, Zhang D, et al. GM-CSF induces cyclin D1 expression and proliferation of endothelial progenitor cells via PI3K and MAPK signaling. Cell Physiol Biochem. 2014;33(3):784–795.
- Hercus TR, Broughton SE, Ekert PG, et al. The GM-CSF receptor family: mechanism of activation and implications for disease. Growth Factors. 2012;30(2):63–75.
- Wagai S, Kasamatsu A, Iyoda M, et al. UNC93B1 promotes tumoral growth by controlling the secretion level of granulocyte macrophage colony-stimulating factor in human oral cancer. Biochem Biophys Res Commun. 2019;513(1):81–87.
- Haque NS, Zhang X, French DL, et al. CC chemokine I-309 is the principal monocyte chemoattractant induced by apolipoprotein(a) in human vascular endothelial cells. Circulation. 2000;102(7):786–792.
- Haque NS, Fallon JT, Taubman MB, et al. The chemokine receptor CCR8 mediates human endothelial cell chemotaxis induced by I-309 and Kaposi sarcoma herpesvirus-encoded vMIP-I and by lipoprotein(a)-stimulated endothelial cell conditioned medium. Blood. 2001;97(1):39–45.
- Mildner M, Prior M, Gschwandtner M, et al. Epidermal CCL27 expression is regulated during skin development and keratinocyte differentiation. J Invest Dermatol. 2014;134(3):855–858.
- Cai D, Xu Y, Ding R, et al. Extensive serum biomarker analysis in patients with non-small-cell lung carcinoma. Cytokine. 2020;126:154868.
- Karnezis T, Farnsworth RH, Harris NC, et al. CCL27/CCL28-CCR10 chemokine signaling mediates migration of lymphatic endothelial cells. Cancer Res. 2019;79(7):1558–1572.