
ABSTRACT
Over the years, molecular subtypes based on estrogen receptor (ER), progesterone receptor (PR), and human epidermal growth factor receptor-2 (HER-2) status have been observed to effectively guide decision-making for the optimal treatment of patients with breast carcinoma (BRCA). However, despite this progress, there are still more than 41,000 BRCA-related fatalities each year in the United States. Moreover, effective drug targets for triple-negative breast carcinoma (TNBC) are still lacking. Given its high mortality rate, it is necessary to investigate more biomarkers with prognostic and pathological relevance in BRCA. In our study, we examined the expression patterns and prognostic implications of transmembrane P24 trafficking protein 9 (TMED9) in BRCA using multiple public cohorts and BRCA specimens collected from Shanghai General Hospital. In addition to this, in vitro experiments were also performed to evaluate the effects of TMED9 expression in BRCA cell proliferation and migration. Our results have demonstrated that a high expression of TMED9 promoted BRCA cell proliferation and migration and predicted poor prognosis in patients with BRCA. In conclusion, TMED9 is a potential prognostic indicator and a possible drug target of BRCA.
Introduction
Breast carcinoma (BRCA) is the most common type of cancer in females, accounting for 30% of total cases in females, with approximately 49,000 new cases every year in the United States [Citation1]. Although most patients with BRCA have a good prognostic performance, more than 41,000 patients die from BRCA each year in the United States [Citation1,Citation2]. Globally, BRCA is still considered a huge burden with almost two million cases and approximately 612,000 deaths every year, and is ranked as the fifth leading cause of cancer-related deaths in 2017 [Citation3].
The treatment response and prognosis of BRCA rely on molecular characteristics that have been well established, and molecular subtypes based on ER, PR, and HER-2 status have been shown to effectively guide clinicians in selecting the optimal treatment for BRCA [Citation4,Citation5]. With the development of modern genomic and transcriptomic technologies, numerous gene markers are being identified to predict the treatment response and prognosis of many different types of cancer [Citation6,Citation7]. Feng and his colleagues detailed the risk factors and signaling pathways that were correlated with the progression and prognosis of BRCA, including molecular subtypes, mutation status of BRCA1 and BRCA2, and WNT/β-catenin signaling pathway [Citation8]. Recently, researchers suggested that tumor-infiltrating lymphocytes (TIL) in BRCA such as cytotoxic T cells, B cells, macrophages, and dendritic cells may predict the prognosis and response to chemotherapy [Citation9]. In addition, adipocytes in BRCA may also drive tumor progression and metastasis via their secreted factors [Citation10,Citation11]. In this study, we propose that TMED9 may have prognostic implications in BRCA.
TMED9 belongs to the transmembrane emp24 domain-containing protein (TMED)/p24 family that is involved in the innate immune and protein transport via the ER-Golgi cargo pathway [Citation12,Citation13]. Previous studies have reported that high TMED9 expression promoted hepatocellular carcinoma (HCC) cell proliferation, migration, and invasion. Similarly, it predicted poor prognosis in patients with HCC by enhancing the expression of β-Catenin, GLI1 [Citation14]. In a study by Algera et al., it was proposed that TMED9 may be a possible target of miR-802 and that overexpression of TMED9 increased β-Catenin expression and TCF/LEF activity in human intestinal epithelial cells [Citation15]. In contrast, Sonakshi et al. demonstrated that TMED9 promoted colon cancer metastasis by driving the CNIH4/TGFα/GLI signaling pathway while opposing the TMED3-WNT-TCF pathway [Citation16]. At present, there is little evidence supporting the correlation between TMED9 and cancers, including BRCA.
In this study, we aimed to evaluate the expression patterns and prognostic implications of TMED9 in BRCA using multiple public cohorts, both at the transcriptional and protein levels. Additionally, we aimed to validate these results through immunohistochemistry (IHC) staining for TMED9 in 78 BRCA samples, along with 63 paired adjacent normal breast specimens collected from the Shanghai General Hospital. Lastly, we aimed to evaluate and validate the functional status such as proliferation, migration and drug resistance of TMED9 in BRCA cell lines.
Methods and materials
Data acquisition
4 BRCA related Gene Expression Omnibus (GEO) cohorts [GSE15852 [Citation17], GSE24124 [Citation18], GSE33447 [Citation19], GSE53752 [Citation20]] were downloaded from GEO website (https://www.ncbi.nlm.nih.gov/geo) for validating the mRNA expression of TMED9 between BRCA and normal breast tissues.
Gene Expression Profiling Interactive Analysis (GEPIA) 2.0 database
GEPIA 2.0 (http://gepia2.cancer-pku.cn/#index) database [Citation21] was utilized to evaluate the mRNA expression of TMED9 between tumor tissues and normal tissues based on their respective transcriptional profiles from the cancer genome atlas (TCGA). Besides, GEPIA 2.0 was also utilized to evaluate the prognostic implications of TMED9 in various tumors.
Human protein atlas (HPA) database
HPA (https://www.proteinatlas.org/) database [Citation22,Citation23] was utilized to validate the protein expression of TMED9 between BRCA and normal breast tissues, assessed through immunohistochemistry (IHC) staining.
UALCAN database
UALCAN (http://ualcan.path.uab.edu/) database [Citation24] was also utilized to validate the protein expression of TMED9 in tissue samples using the data from Clinical Proteomic Tumor Analysis Consortium (CPTAC). A list of genes that are positively correlated (Pearson-CC ≥ 0.3) with TMED9 in BRCA was generated from the database using the TCGA data and GEPIA 2.0 was used to evaluate the prognostic implications of TMED9 in various tumors.
PrognoScan database
PrognoScan (http://dna00.bio.kyutech.ac.jp/PrognoScan/index.html) database [Citation25] was utilized to validate the prognostic implication of TMED9 in BRCA.
Construction of a TMED protein-protein interaction (PPI) network
Genes that are positively correlated with TMED9 in BRCA, referred to as TMED9 co-expressed genes, were determined to construct a PPI network using the STRING database (https://www.string-db.org/) [Citation26] and Cytoscape 3.8.2 software [Citation27].
Gene ontology (GO) and Kyoto Encyclopedia of Genes and Genomes (KEGG) analysis of TMED9 co-expressed genes
Aside from the construction of a PPI network, co-expressed genes were also utilized for the GO and KEGG analysis in R software, specifically using its ‘clusterProfiler’ package [Citation28]. Terms with a false discovery rate (FDR) < 0.05 were illustrated.
Analysis of TMED9 and co-expressed genes in BRCA tumor tissues
The Gene Set Cancer Analysis (GSCA) database (http://bioinfo.life.hust.edu.cn/GSCA/#/drug) [Citation29] was utilized to evaluate the Pearson correlation between gene expression and drug sensitivity using the data from the Genomics of Drug Sensitivity in Cancer (GDSC) and Genomics of Therapeutics Response Portal (CTRP). In this study, the mRNA expression of TMED9 and some of its co-expressed genes were analyzed in relation to drug sensitivity. A positive correlation coefficient (r > 0) implies high drug resistance in a cell line with high gene expression. Drugs were ranked based on the integrated levels of the correlation coefficients and the FDRs of the searched genes. The top 30 ranked drugs were plotted.
The dependency map portal database
The Dependency Map Portal database (https://depmap.org/portal/) [Citation30] was utilized to evaluate the probabilities of dependency of TMED9 in 38 BRCA cell lines using CERES scores from the CRISPR cohort (DepMap 21Q2 Public, CERES).
Collection of human BRCA specimens
Seventy-eight (78) BRCA samples, along with 63 paired adjacent normal breast specimens, were collected from the Shanghai General Hospital. All experimental protocols were approved by the Ethics Committee of Shanghai General Hospital, Shanghai Jiaotong University School of Medicine. All participants provided written informed consent prior to harvesting tissue samples.
Cell culture maintenance
T47D, BT474, MCF-7, BT549, and MDA-MB-231 cells were cultivated in Dulbecco’s Modified Eagle Medium (DMEM) (Gibco) with 10% fetal bovine serum (Gibco) and 1% penicillin-streptomycin (Gibco) in a 37°C incubator with 5% CO2.
Western blotting
Cellular proteins were extracted using RIPA buffer (Beyotime) containing 1X protease inhibitor mixture (Millipore) at 4°C for 30 minutes and were quantified through a PierceTM BCA protein assay (Thermo Scientific). The separation of the protein lysate was performed through SDS-PAGE. Afterward, the lysate was transferred onto a nitrocellulose filter membrane (Millipore), blocked, and incubated with primary antibodies specific to TMED9 (Proteintech, 21,620-1-AP, 1:2000). This is followed by incubation with an HRP-conjugated secondary antibody (Sigma). Lastly, the setup was exposed with enhanced chemiluminescence for visualization. β-Actin (Proteintech, 20,536-1-AP, 1:5000) was used as an internal control.
TMED9 knockdown by lentivirus infection
TMED9-knockdown shRNAs were inserted into a pLKO.1 plasmid. The shTMED9 expression plasmids were then transfected into HEK293T cells together with the psPAX and pMD2.0 G vectors. Next, the lentiviruses were collected and used to infect MDA-MB-231 and BT549 cells. The primer sequences used are shown in .
Table 1. The sequence of primer using in the study
Immunohistochemistry staining for TMED9
IHC staining (Proteintech, 21,620-1-AP, 1:200) was performed following a standard IHC protocol as described previously [Citation31]. The staining index (0–12) was determined by multiplying the staining intensity score with the score for positive cell frequency. The staining intensity scores were defined as: 0 = negative; 1 = weak; 2 = moderate; and 3 = strong. On the other hand, frequency of positive cells was defined as: <5% = 0; 5%-25% = 1; 26%-50% = 2; 51%-75% = 3; >75% = 4 [Citation32].
Cell proliferation and cytotoxicity assay
Cells were seeded into 96-well plates and cultured in DMEM with 10% fetal bovine serum (2000 cells per well, 3 parallel wells). Then, the cells were collected at different points in time, and cell counting was done using the Counting Kit-8 (CCK-8) reagent. For the cytotoxicity assay, the cells were treated with different concentrations of gemcitabine, ranging between 0 and 2.5 μmol, 24 hours after the plating of cells. Treatment was performed for 48 hours, and the number of viable cells was quantified through absorbance measurements at 450 nm.
Colony-forming assay
Cells were seeded in triplicates at a density of 100 cells per well in a 6-well plate, followed by three weeks of cell cultivation in DMEM with 10% fetal bovine serum. Afterward, the resulting colonies were fixed using 10% formalin and stained with 0.1% crystal violet.
Transwell assay
Cells were seeded in the upper chamber of a Transwell chamber (24-well, 8 μm pore, Corning) in 200 μL of serum-free DMEM (1 x 10⁵ cells per well, 3 parallel wells). The lower chamber was added with 500 μL of DMEM with 10% fetal bovine serum, and the Transwell was incubated at 37°C for 24 hours. The cells were then harvested and filtered from the upper surface of the membrane and were consequently fixed with 4% paraformaldehyde, followed by staining with 0.1% crystal violet solution. The cells were visualized using an inverted optics microscope.
Wound healing assay
Cells were seeded in triplicates using 6-well plates and were incubated for 24 hours to reach approximately 80% confluency. The cell monolayers were scratched using a sterile 100-μL pipette tip. Afterward, the cells were treated with serum-free medium. Photographs of the cell cultures were taken before and after 36 hours of incubation, and the cell migration distance was calculated using ImageJ software. The migratory ratio was expressed as the ratio of the width of the wound after 36 hours divided by the width of the wound before incubation.
Statistical analysis
Student’s t-test was performed to analyze differences between two groups. P-values of < 0.05 are considered statistically significant.
Results
It has been established that TMED9 affected the progression and prognosis of HCC and colon cancer. Similarly, TMED9 may also served as a biomarker of BRCA. Through the analysis of multiple public datasets and in vitro experiments, we found that TMED9 played a critical role in the progression and prognosis of BRCA. With this, we proposed that TMED9 might serve as a prognostic predictor and drug target for BRCA.
TMED9 expression is higher in BRCA compared to normal breast tissues
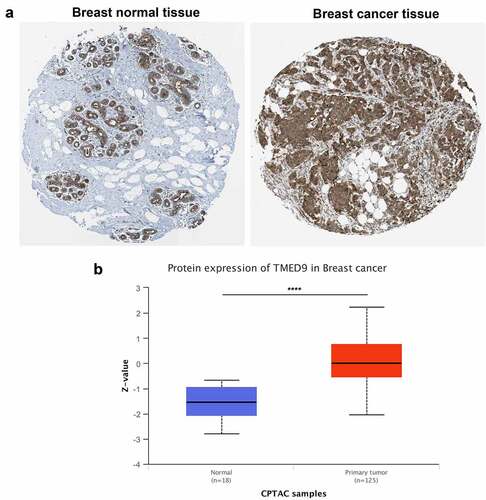
Evaluating TMED9 mRNA expression in different cancer tissues revealed that, compared with paired normal samples, the mRNA expression of TMED9 was higher in most types of cancer, including BRCA, colon adenocarcinoma, lymphoid neoplasms, diffuse large B-cell lymphoma, glioblastoma multiforme, brain lower grade glioma, liver hepatocellular carcinoma, prostate adenocarcinoma, rectum adenocarcinoma, skin cutaneous melanoma, testicular germ cell tumors, thymoma, uterine corpus endometrial carcinoma, and uterine carcinosarcoma (). Using data from four publicly available GEO cohorts confirmed that the mRNA expression of TMED9 was indeed higher in BRCA tissues than in normal breast samples (). All tumor samples in the GSE53752 cohort belonged to TNBC, while tumor samples in the GSE24124 cohort belonged to ER+ BRCA. These samples indicated that TMED9 expression might be higher in breast tumor samples regardless of their molecular subtype. Additionally, the protein expression of TMED9 was also found to be higher in BRCA tissues than in normal breast tissues (, 2B). With these findings, we proposed that TMED9 was a potential diagnostic biomarker in BRCA.
Figure 1. Transcriptional profiles of TMED9 in BRCA and normal breast samples. (a) List of 33 cancer types (TCGA). Transcriptional patterns based on the (b) GSE15852, (c) GSE24124, (d) GSE33447, and (e) GSE53752 cohort. TCGA, the cancer genome atlas. *P < 0.05, **P < 0.01, ***P < 0.001
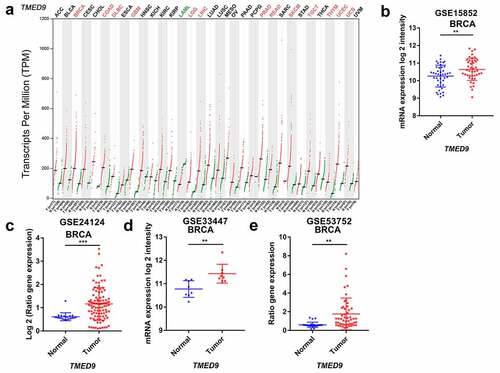
Figure 2. TMED9 protein expression profiles in BRCA and normal breast samples. Expression profiles based on the (a) HPA database and (b) CPTAC cohort. HPA, human protein atlas; CPTAC, Clinical proteomic tumor analysis consortium. ****P < 0.0001
TMED9 is a prognostic indicator of BRCA
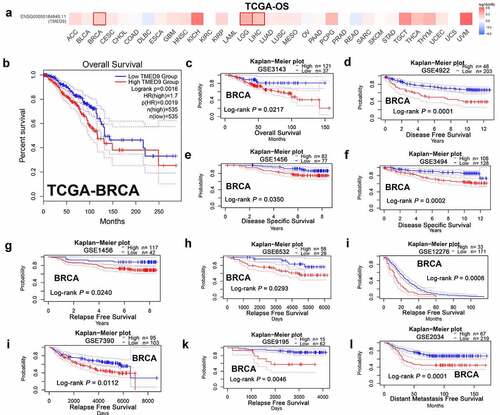
In evaluating the prognostic implications of TMED9 in various cancer types, it was demonstrated that TMED9 was a significant risk factor in the prognosis of BRCA, brain lower grade glioma, and liver hepatocellular carcinoma (, 3B). Furthermore, our findings also revealed that a high expression of TMED9 predicted poor overall survival (), disease-free survival (), disease-specific survival (, 3F), relapse-free survival (), and distant-metastasis-free survival () in BRCA. Hence, we infered that TMED9 might serve as a potential prognostic biomarker in BRCA.
Figure 3. High TMED9 expression predicts poor prognosis in BRCA. (a) High expression of TMED9 predicted poor prognosis in BRCA, LGG, and LIHC as per the GEPIA database. (b-l) The correlations between the TMED9 expression and the survival of patients with BRCA were evaluated using data from different cohorts. The given Kaplan-Meier curves illustrate the probability of (b-c) overall survival (OS), using data from the (b) TCGA-BRCA and (c) GSE3143 cohort; (d) disease-free survival (DFS), based on data from the GSE4922 cohort; (e-f) disease-specific survival (DSS) based on the (e) GSE1456 cohort and the (f) GSE3494 cohort; (g-k) relapse-free survival (RFS) based on the (g) GSE1456, (h) GSE6532, (i) GSE12276, (j) GSE7390, and (k) GSE9195 cohorts; and (l) distant metastasis-free survival (DMFS) based on data from the GSE2034 cohort
IHC staining validates the expression patterns and prognostic implications in BRCA
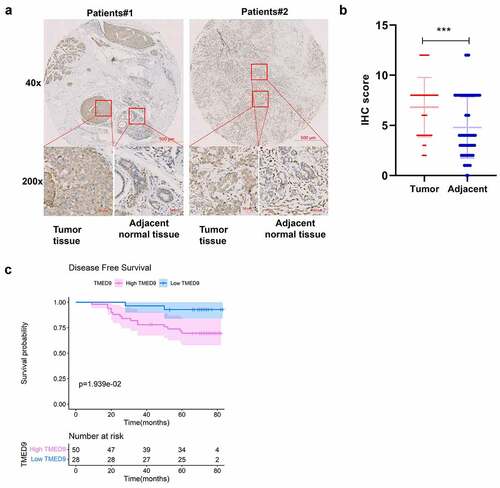
To validate the link between TMED9 and clinical character in BRCA patients, IHC assay was conducted in BRCA tissue microarray. The results have shown that TMED9 protein expression level was higher in BRCA samples than in normal breast samples dramatically (, 4B) and that high TMED9 expression predicted poor prognosis in BRCA (). These results generated were consistent with that in public databases.
Figure 4. Validation of the expression patterns and prognostic implications of TMED9 in BRCA. (a) IHC staining for TMED9 in two representative BRCA cases. (b) Scatter plot of TMED IHC scores between BRCA and adjacent breast samples. (c) Kaplan-Meier analysis was utilized to compare the disease-free survival between BRCA patients with a high and low expression of TMED9. IHC, immunohistochemistry; ***P < 0.001
TMED9 and its co-expressed genes may be involved in cancer development and progression
Through the construction of a PPI network combining TMED9 and its co-expressed genes, it was suggested that TMED9 might be capable of directly interacting with COPI coat complex subunit epsilon (COPE), transmembrane p24 trafficking protein 1 (TMED1), BCL2 interacting protein 1 (BNIP1), peptidylprolyl isomerase B (PPIB), prolyl 4-hydroxylase subunit beta (P4HB), myeloid derived growth factor (MYDGF), and beta-1,4-galactosyltransferase 7 (B4GALT7) (). Results of the functional enrichment analysis implied that TMED9 and its co-expressed genes, particularly those involved in biological processes, might play critical roles in cancer development and progression, such as retrograde vesicle-mediated transport, Golgi to ER, endoplasmic reticulum lumen, coated vesicle, and protein processing in the endoplasmic reticulum (, 5C).
Figure 5. PPI network and functional annotation of TMED9 and its co-expressed genes. (a) PPI network combining TMED9 and its co-expressed genes. (b) GO and (c) KEGG analysis of the co-expressed genes. PPI, protein-protein network; GO, gene ontology; KEGG, Kyoto Encyclopedia of Genes and Genomes
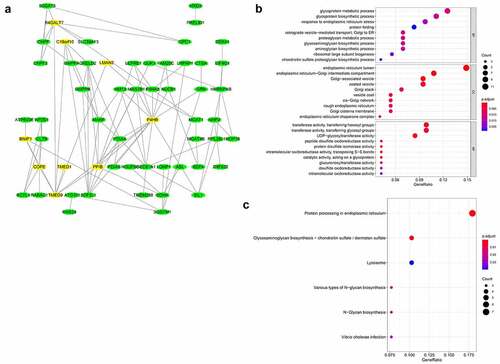
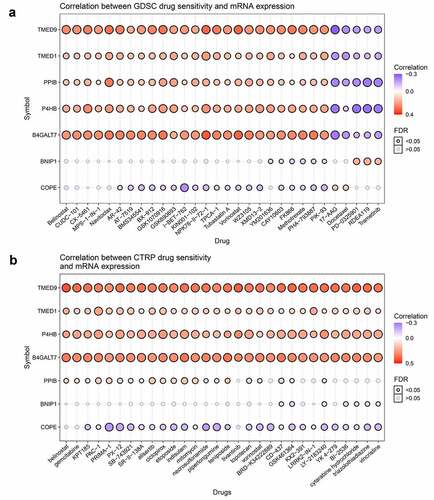
Pan-cancer analysis has shown that the correlations between TMED9, TMED1, PPIB, P4HB, and B4GALT7 mRNA expression and the top 30 drugs were consistent, both in the GDSC platform and the CTRP platform (, 6B). With these findings, we proposed that these five genes might be critical players in the occurrence and development of BRCA.
Figure 6. Correlations between TMED9 mRNA expression and drug sensitivity. (a) GDSC and (b) CTRP data for pan-cancer analysis. GDSC, genomics of drug sensitivity; CTRP, Genomics of therapeutics response portal; FDR, false discovery rate
The TMED9 gene is essential in BRCA cell lines
The CERES scores of the given cell lines ranged from −0.09 to −0.52 (from MFM223 to HCC1954), with a mean value of −0.32 (). As a consensus, a low score implied that a gene was more likely to be essential in a given cell line, and a negative score implied that the downregulation of a gene might inhibit the proliferation of a given cell line. Since the CERES scores generally had negative values, it was inferred that TMED9 might be essential in these BRCA cell lines.
Figure 7. Probability of TMED9 dependency in BRCA cell lines
TMED9 knockdown suppresses the proliferative, drug resistant and migratory capacities of BT549 and MDA-MB-231 cells
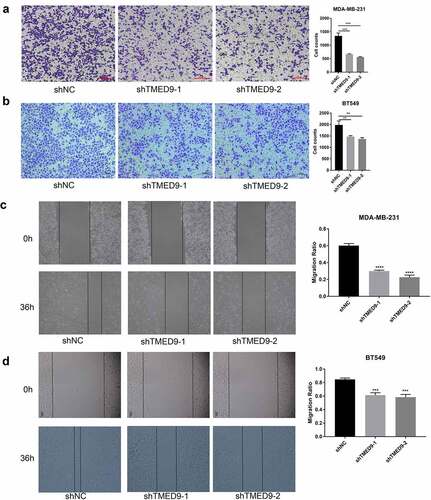
In evaluating the expression of TMED9 in five BRCA cell lines, we found that TMED9 expression was higher in both the BT549 and MDA-MB-231 cell lines than that in the T47D, BT474, and MCF-7 cell lines (). ShRNAs specifically targeting TMED9 was used to constructed the TMED9-knockdown MDA-MB-231 and BT549 stable expression cell lines (). Moreover, it was observed that TMED9 knockdown effectively suppressed the proliferative () and colony-forming () capacities of BRCA cells, and that TMED9-knockdown BT549 and MDA-MB-231 cells were more sensitive to gemcitabine (). Lastly, TMED9 knockdown was also observed to suppress the migratory ability of BT549 and MDA-MB-231 cells, as shown in the transwell assay (, 9B) and wound healing assay (, 9D). With these results, it was therefore suggested that TMED9 affected the proliferative, drug resistant and migratory capacities of BRCA cell lines.
Figure 8. TMED9 knockdown suppresses BRCA cell proliferation. (a) Expression patterns of TMED9 protein in T47D, BT474, MCF-7, BT549, and MDA-MB-231 cells. (b) Knockdown efficiency of TMED9 in BT549 and MDA-MB-231 cells. (c) TMED9 knockdown decreased the viability of BT549 and MDA-MB-231 cells. (d) TMED9 knockdown suppressed the colony-forming abilities of MDA-MB-231 cells. (e) TMED9 knockdown increased the susceptibility of BT549 and MDA-MB-231 cells to gemcitabine. *P < 0.05, **P < 0.01, ***P < 0.001
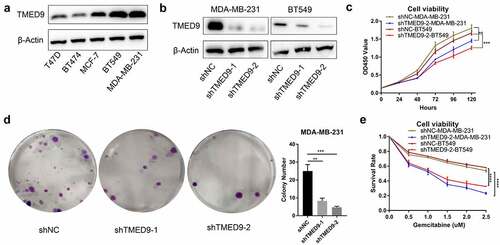
Figure 9. TMED9 knockdown suppresses BRCA cell migration. The transwell assay demonstrated that TMED9 knockdown suppressed the migration of (a) MDA-MB-231 and (b) BT549 cells. The wound healing assay showed that TMED9-knockdown (c) MDA-MB-231 and (d) BT549 cells suppressed migratory abilities. **P < 0.01, ***P < 0.001, ****P < 0.0001
Discussion
Endocrine therapy based on ER, PR, and targeting therapy based on HER2 status (tamoxifen treatment and trastuzumab treatment) [Citation33,Citation34] has exhibited a high performance as BRCA treatments, although they are quite ineffective for triple-negative breast cancer (TNBC). Numerous molecular markers are being utilized for the clinical diagnosis and treatment of BRCA. These markers include BRCA1 and BRCA2 for examining BRCA genetic susceptibility [Citation35], and PAI-1, Ki67, cyclin D, cyclin E, p27, p21 for the assessment of BRCA prognosis [Citation36]. Moreover, several multi-gene signatures that could predict BRCA prognosis were approved by the US Food and Drug Administration. These include Oncotype DX, MammaPrint, and Rotterdam Signature, among many others [Citation37]. Currently, molecular markers that guide immune therapies (e.g., tumor-associated antigen [Citation38,Citation39] and the immune checkpoint molecule PD-L1) are attracting more attention [Citation40].
It has been reported that TMED9 promoted metastasis and predicted poor prognosis in HCC and colon cancer [Citation14,Citation16]. However, the correlation between TMED9 and BRCA is still unclear. Previous studies have shown that TMED9 interacted with ARFGAP1 and BPIFB3 and downregulated the degradation of cytoplasmic proteins or organelles in the non-canonical autophagy pathway by promoting lysosomal degradation [Citation41]. This evidence suggested that the high expression of TMED9 may promote the proliferation of cancer cells by inhibiting autophagy.
In our study, we examined the expression patterns and prognostic implications of TMED9 in BRCA using data from multiple public cohorts and BRCA specimens. Our results demonstrated that knockdown of TMED9 suppressed the proliferative, drug resistant and migratory abilities of BRCA cell lines. We also found that TMED9 directly interacted with the COPE, TMED1, BNIP1, PPIB, P4HB, MYDGF, and B4GALT7 genes. Previous studies have reported that TMED1 participated in interleukin-13 signaling [Citation42,Citation43] and in the RNF26-related complex, which modulated innate immune signaling [Citation44]. Hence, the involvement of TMED9 in anti-tumor immunity needs further investigation. Numerous studies have reported that BNIP1, a pro-apoptotic protein in the Bcl-2 family [Citation45], promoted the apoptosis of cancer cells [Citation46,Citation47], including cervical cancer cells [Citation48]. On the other hand, PPIB, a peptidylpropyl isomerase, participated in colorectal cancer progression and chemoresistance [Citation49]. Studies have also suggested that P4HB may extensively regulate tumor progression and prognosis of patients with cancer [Citation50–54], including BRCA [Citation55,Citation56]. In BRCA, TMED9 may affect cancer progression and prognosis by interacting with these proteins.
Despite being an extensive analysis, there are still several limitations in our study. Firstly, this study does not cover the elucidation of molecular mechanisms on how TMED9 specifically affects the proliferation, drug resistance and migration of BRCA cells. Secondly, in vivo experiments are not conducted to consolidate the results generated. Despite these limitations, our study is still the first to report that TMED9 may predict BRCA prognosis and serves as a drug target for treating BRCA.
Conclusion
TMED9 is a potential prognostic indicator and drug target for BRCA treatment.
Research highlights
TMED9 expression was higher in BRCA samples than in normal breast samples.
High TMED9 expression predicted poor prognosis in patients with BRCA.
TMED9 knockdown suppressed MDA-MB-231 and BT549 cells proliferation and migration in vitro.
Abbreviations
TMED9, transmembrane P24 trafficking protein 9; TCGA, the cancer genome atlas; GEO, Gene Expression Omnibus; BRCA, breast carcinoma; ER, estrogen receptor; PR, progesterone receptor; HER-2, human epidermal growth factor receptor-2; TNBC, triple negative breast carcinoma; IHC, immunohistochemistry; GEPIA, Gene Expression Profiling Interactive Analysis; HPA, human protein atlas; CPTAC, Clinical Proteomic Tumor Analysis Consortium; PPI, protein-protein interaction; GO, gene ontology; KEGG, Kyoto Encyclopedia of Genes and Genomes; FDR, false discovery rate; GSCA, Gene Set Cancer Aanlysis; GDSC, Genomics of Drug Sensitivity in Cancer; CTRP, Genomics of Therapeutics Response Portal; DMEM, Dulbecco’s modified eagle medium; COPE, COPI coat complex subunit epsilon; TMED1, transmembrane p24 trafficking protein 1; BNIP1, BCL2 interacting protein 1; PPIB, peptidylprolyl isomerase B; P4HB, prolyl 4-hydroxylase subunit beta; MYDGF, myeloid derived growth factor; B4GALT7, beta-1,4-galactosyltransferase 7.
Acknowledgements
The results of this study were based on the data obtained in these cohorts: TCGA-BRCA, GSE15852, GSE24124, GSE3344, and GSE53752. Online tools (GEPIA 2.0, HPA, UALCAN, PrognoScan, GSCA, and DepMap Portal) were used to simplify the methods of data analysis. We thank the contributors of data and tools in our study.
Disclosure statement
No potential conflict of interest was reported by the author(s).
Additional information
Funding
References
- Siegel RL, Miller KD, Jemal A. Cancer statistics, 2020. CA Cancer J Clin. 2020;70(1). DOI:10.3322/caac.21590
- Waks AG, Winer EP. Breast Cancer Treatment. JAMA. 2019;321(3):316.
- Fitzmaurice C, Abate D, Abbasi N, et al. Global, regional, and national cancer incidence, mortality, years of life lost, years lived with disability, and disability-adjusted life-years for 29 cancer groups, 1990 to 2017: a systematic analysis for the global burden of disease study. JAMA Oncol. 2019;5(12):1749–1768.
- Prat A, Pineda E, Adamo B, et al. Clinical implications of the intrinsic molecular subtypes of breast cancer. Breast. 2015;24(Suppl 2):S26–S35.
- Huo D, Hu H, Rhie SK, et al. Comparison of breast cancer molecular features and survival by african and European ancestry in the cancer genome atlas. JAMA Oncol. 2017;3(12):1654–1662.
- Provenzano E, Ulaner GA, Chin S-F. Molecular classification of breast cancer. PET Clin. 2018;13(3):325–338.
- Hammerl D, Smid M, Timmermans AM, et al. Breast cancer genomics and immuno-oncological markers to guide immune therapies. Semin Cancer Biol. 2018;52(Pt 2):178–188.
- Feng Y, Spezia M, Huang S, et al. Breast cancer development and progression: risk factors, cancer stem cells, signaling pathways, genomics, and molecular pathogenesis. Genes Dis. 2018;5(2). DOI:10.1016/j.gendis.2018.05.001
- Goff SL, Danforth DN. The role of immune cells in breast tissue and immunotherapy for the treatment of breast cancer. Clin Breast Cancer. 2021;21(1):e63–e73.
- Rajarajan D, Selvarajan S, Charan Raja MR, et al. Genome-wide analysis reveals miR-3184-5p and miR-181c-3p as a critical regulator for adipocytes-associated breast cancer. J Cell Physiol. 2019;234(10):17959–17974.
- Chu D-T, Phuong TNT, Tien NLB, et al. The effects of adipocytes on the regulation of breast cancer in the tumor microenvironment: an update. Cells. 2019;8(8):857.
- Strating JRPM, Martens GJM. The p24 family and selective transport processes at the ER-Golgi interface. Biol Cell. 2009;101(9):495–509.
- Aber R, Chan W, Mugisha S, et al. Transmembrane emp24 domain proteins in development and disease. Genet Res (Camb). 2019;101:e14.
- Yang Y-C, Chien M-H, Lai T-C, et al. Proteomics-based identification of TMED9 is linked to vascular invasion and poor prognoses in patients with hepatocellular carcinoma. J Biomed Sci. 2021;28(1):29.
- Goga A, Yagabasan B, Herrmanns K, et al. miR-802 regulates Paneth cell function and enterocyte differentiation in the mouse small intestine. Nat Commun. 2021;12(1):3339.
- Mishra S, Bernal C, Silvano M, et al. The protein secretion modulator TMED9 drives CNIH4/TGFα/GLI signaling opposing TMED3-WNT-TCF to promote colon cancer metastases. Oncogene. 2019;38(29):5817–5837.
- Pau NIB, Zakaria Z, Muhammad R, et al. Gene expression patterns distinguish breast carcinomas from normal breast tissues: the Malaysian context. Pathol Res Pract. 2010;206(4):223–228.
- Chang L-Y, Liu L-YD, Roth DA, et al. The major prognostic features of nuclear receptor NR5A2 in infiltrating ductal breast carcinomas. Int J Genomics. 2015;2015:403576.
- Lian Z-Q, Wang Q, Li W-P, et al. Screening of significantly hypermethylated genes in breast cancer using microarray-based methylated-CpG island recovery assay and identification of their expression levels. Int J Oncol. 2012;41(2):629–638.
- Kuo W-H, Chang -Y-Y, Lai L-C, et al. Molecular characteristics and metastasis predictor genes of triple-negative breast cancer: a clinical study of triple-negative breast carcinomas. PLoSOne. 2012;7(9):e45831.
- Tang Z, Kang B, Li C, et al. GEPIA2: an enhanced web server for large-scale expression profiling and interactive analysis. Nucleic Acids Res. 2019;47(W1):W556–W60.
- Uhlen M, Zhang C, Lee S, et al. A pathology atlas of the human cancer transcriptome. Science. 2017;357(6352):eaan2507.
- Uhlén M, Fagerberg L, Hallström BM, et al. Proteomics. Tissue-based map of the human proteome. Science. 2015;347(6220):1260419.
- Chandrashekar DS, Bashel B, Balasubramanya SAH, et al. UALCAN: a portal for facilitating tumor subgroup gene expression and survival analyses. Neoplasia. 2017;19(8):649–658.
- Mizuno H, Kitada K, Nakai K, et al. PrognoScan: a new database for meta-analysis of the prognostic value of genes. BMC Med Genomics. 2009;2(1):18.
- Szklarczyk D, Gable AL, Lyon D, et al. STRING v11: protein-protein association networks with increased coverage, supporting functional discovery in genome-wide experimental datasets. Nucleic Acids Res. 2019;47(D1):D607–D13.
- Shannon P, Markiel A, Ozier O, et al. Cytoscape: a software environment for integrated models of biomolecular interaction networks. Genome Res. 2003;13(11):2498–2504.
- Yu G, Wang L-G, Han Y, et al. clusterProfiler: an R package for comparing biological themes among gene clusters. OMICS. 2012;16(5):284–287.
- Liu J-Y, Jiang L, Liu -J-J, et al. AEBP1 promotes epithelial-mesenchymal transition of gastric cancer cells by activating the NF-κB pathway and predicts poor outcome of the patients. Sci Rep. 2018;8(1):11955.
- Tsherniak A, Vazquez F, Montgomery PG, et al. Defining a cancer dependency map. Cell. 2017;170(3):564–576.e16.
- Kaemmerer D, Peter L, Lupp A, et al. Comparing of IRS and Her2 as immunohistochemical scoring schemes in gastroenteropancreatic neuroendocrine tumors. Int J Clin Exp Pathol. 2012;5(3):187–194.
- Min K-W, Chae SW, Kim D-H, et al. Fascin expression predicts an aggressive clinical course in patients with advanced breast cancer. Oncol Lett. 2015;10(1):121–130.
- Davies C, Pan H, Godwin J, et al. Long-term effects of continuing adjuvant tamoxifen to 10 years versus stopping at 5 years after diagnosis of oestrogen receptor-positive breast cancer: ATLAS, a randomised trial. Lancet. 2013;381(9869):805–816.
- Perez EA, Romond EH, Suman VJ, et al. Trastuzumab plus adjuvant chemotherapy for human epidermal growth factor receptor 2-positive breast cancer: planned joint analysis of overall survival from NSABP B-31 and NCCTG N9831. J Clin Oncol. 2014;32(33):3744–3752.
- Hall JM, Lee MK, Newman B, et al. Linkage of early-onset familial breast cancer to chromosome 17q21. Science. 1990;250(4988):1684–1689.
- Harris L, Fritsche H, Mennel R, et al. American society of clinical Oncology 2007 update of recommendations for the use of tumor markers in breast cancer. J Clin Oncol. 2007;25(33):5287–5312.
- Kyle RA, Yee GC, Somerfield MR, et al. American society of clinical Oncology 2007 clinical practice guideline update on the role of bisphosphonates in multiple myeloma. J Clin Oncol. 2007;25(17):2464–2472.
- Criscitiello C. Tumor-associated antigens in breast cancer. Breast Care (Basel). 2012;7(4):262–266.
- Melero I, Gaudernack G, Gerritsen W, et al. Therapeutic vaccines for cancer: an overview of clinical trials. Nat Rev Clin Oncol. 2014;11(9):509–524.
- Muenst S, Schaerli AR, Gao F, et al. Expression of programmed death ligand 1 (PD-L1) is associated with poor prognosis in human breast cancer. Breast Cancer Res Treat. 2014;146(1):15–24.
- Evans AS, Lennemann NJ, Coyne CB. BPIFB3 interacts with ARFGAP1 and TMED9 to regulate non-canonical autophagy and RNA virus infection. J Cell Sci. 2021;134(5). DOI:10.1242/jcs.251835
- Dvela-Levitt M, Kost-Alimova M, Emani M, et al. Small molecule targets tmed9 and promotes lysosomal degradation to reverse proteinopathy. Cell. 2019;178(3):521–535.e23.
- Connolly DJ, O’Neill LAJ, McGettrick AF. The GOLD domain-containing protein TMED1 is involved in interleukin-33 signaling. J Biol Chem. 2013;288(8):5616–5623.
- Fenech EJ, Lari F, Charles PD, et al. Interaction mapping of endoplasmic reticulum ubiquitin ligases identifies modulators of innate immune signalling. Elife. 2020;9. DOI:10.7554/eLife.57306.
- Zhang HM, Cheung P, Yanagawa B, et al. BNips: a group of pro-apoptotic proteins in the Bcl-2 family. Apoptosis. 2003;8(3):229–236.
- Nishiwaki Y, Yoshizawa A, Kojima Y, et al. The BH3-only SNARE BNip1 mediates photoreceptor apoptosis in response to vesicular fusion defects. Dev Cell. 2013;25(4):374–387.
- Nakajima K-I, Hirose H, Taniguchi M, et al. Involvement of BNIP1 in apoptosis and endoplasmic reticulum membrane fusion. EMBO J. 2004;23(16):3216–3226.
- Li FH, Xiang L, Ran L, et al. BNIP1 inhibits cell proliferation, migration and invasion, and promotes apoptosis by mTOR in cervical cancer cells. Eur Rev Med Pharmacol Sci. 2019;23(4):1397–1407.
- Choi TG, Nguyen MN, Kim J, et al. Cyclophilin B induces chemoresistance by degrading wild-type p53 via interaction with MDM2 in colorectal cancer. J Pathol. 2018;246(1):115–126.
- Xie L, Li H, Zhang L, et al. Autophagy-related gene: a novel diagnosis and prognosis marker for kidney renal clear cell carcinoma. Aging (Albany NY). 2020;12(2):1828–1842.
- Ma X, Wang J, Zhuang J, et al. P4HB modulates epithelial-mesenchymal transition and the β-catenin/Snail pathway influencing chemoresistance in liver cancer cells. Oncol Lett. 2020;20(1):257–265.
- Zhang J, Guo S, Wu Y, et al. a novel hypoxia target gene related to gastric cancer invasion and metastasis. Biomed Res Int. 2019;2019:9749751.
- Wu Y, Peng Y, Guan B, et al. P4HB: a novel diagnostic and prognostic biomarker for bladder carcinoma. Oncol Lett. 2021;21(2):95.
- Zhou Y, Yang J, Zhang Q, et al. P4HB knockdown induces human HT29 colon cancer cell apoptosis through the generation of reactive oxygen species and inactivation of STAT3 signaling. Mol Med Rep. 2019;19(1):231–237.
- Yang W, Wu X, Zhou F. Collagen Type X Alpha 1 (COL10A1) contributes to cell proliferation, Migration, and Invasion by Targeting Prolyl 4-Hydroxylase Beta Polypeptide (P4HB) in breast cancer. Med Sci Monit. 2021;27:e928919.
- Levy AS, Bernstein JL, Xia JJ, et al. Poly-4-Hydroxybutyric acid mesh compares favorably with acellular dermal matrix in tissue expander-based breast reconstruction. Ann Plast Surg. 2020;85(S1 Suppl 1):S2–S7.