
ABSTRACT
Obesity significantly impacts living a normal life by increasing morbidity. Additionally, obesity has been shown to be closely associated with severe inflammation in adipocytes. It is widely reported that berberine (BBR) has an anti-inflammatory effect and can reduce glucose and lipid accumulation, whereas ginsenoside Rb1 (Rb1) has been shown to have a significant inhibitory effect on insulin resistance and lipid peroxidation. In this study, we aimed to explore the synergetic effect of BBR and Rb1 on tumor necrosis factor alpha (TNF-α)-treated adipocytes and the mechanisms underlying it. We found that TNF-α reduced cell viability, facilitated the production of inflammatory factors, induced adipogenesis, activated the nuclear factor kappa B (NF-κB) pathway, and increased the expression of peroxisome proliferator-activated receptor gamma, CCAAT enhancer-binding protein alpha, and sterol regulatory element-binding protein-1 c in adipocytes. However, these effects were significantly alleviated by BBR or Rb1. Additionally, a synergetic effect was observed when BBR and Rb1 were used in combination. The effects of BBR in combination with Rb1 on cell proliferation, inflammation, adipogenesis, and the NF-κB pathway in TNF-α-treated adipocytes were significantly abolished by receptor activator of nuclear factor kappa-Β ligand, which is an activator of the NF-κB pathway. Collectively, the results revealed that BBR and Rb1 have a synergetic protective effect against TNF-α-induced inflammation in adipocytes. The mechanism underlying this synergetic effect was found to be inhibition of the NF-κB signaling pathway.
Introduction
Obesity is a disease that requires more research attention, as it is associated with significant morbidity. Early in 2003, the number of people who were overweight and obese worldwide were 0.2–0.3 billion and 30–40 million, respectively [Citation1]. The definition of metabolic syndrome was first proposed in 1988 to explain the pathogenesis of related metabolic diseases such as obesity [Citation2]. Metabolic syndrome has been shown to be a chronic inflammatory syndrome, whereas obesity is defined as a mild inflammatory state characterized by upregulation of inflammatory biomarkers. In 1993, an animal experiment showed that tumor necrosis factor alpha (TNF-α) is an important pro-inflammatory factor that is expressed in adipocytes. The expression level of TNF-α was found to be significantly increased in adipocytes isolated from obese animals. Additionally, insulin resistance was considerably blocked by soluble TNF-α receptor immunoglobulin. Furthermore, the expression of plasminogen activation inhibitor-1 is significantly upregulated in adipocytes extracted from obese patients, and this is accompanied by increases in leukocyte count and interleukin (IL)-6 concentration in peripheral blood. It has been shown that TNF-α expression is positively correlated with the body mass index (BMI) of obese patients [Citation3]. An investigation of the relationship between lipid level and inflammation using the Mendelian randomization method revealed that obesity is closely related to fat uptake and the expression of susceptible genes [Citation4]. In addition, it has been indicated that the levels of inflammatory factors such as C-reactive protein are high in obese patients. Therefore, it is important to suppress inflammation in the treatment of obesity and metabolic syndrome.
Berberine (BBR) is an isoquinoline alkaloid that is extracted mainly from Coptis chinensis and Phellodendron chinense. It is reported that BBR has an anti-inflammatory effect [Citation5] and can suppress glucose and lipid accumulation [Citation6]. The protective effect of BBR against inflammation in adipocytes has been reported previously [Citation7]. BBR has been shown to be a promising anti-obesity agent in multiple clinical studies [Citation8]. Ginsenoside Rb1 (Rb1) is a monomer of ginseng diol saponin that has a significant protective effect on the cardiovascular system and the function of vascular endothelial cells [Citation9]. It is reported that Rb1 can improve insulin resistance, induce hemangiectasis, and suppress lipid peroxidation [Citation10,Citation11]. In addition, it was found in previous studies that the development of steatohepatitis in obese mice is repressed by Rb1 through the regulation of glucolipid metabolism [Citation12,Citation13].
In the present study, we investigated the effects of BBR and Rb1 on TNF-α-induced inflammation in adipocytes to explore the potential synergetic effect of the two drugs on obesity and metabolic syndrome.
Materials and methods
Agents, cell culture, and induction of differentiation
BBR and Rb1 were obtained from Sigma-Aldrich (St. Louis, MO, USA). Receptor activator of nuclear factor kappa-Β ligand (RANKL) was purchased from MedChemExpress (Monmouth Junction, NJ, USA). 3T3-L1 preadipocytes were purchased from the American Type Culture Collection (Manassas, VA, USA) and cultured in high-glucose Dulbecco’s Modified Eagle Medium (DMEM) supplemented with 10% fetal bovine serum (FBS) and 1% antibiotics at 37°C in a 5% CO2 atmosphere. After incubation for two days, differentiation medium (high-glucose DMEM, 10% FBS, 0.5 mΜ methylisobutylxanthine, 1 μΜ dexamethasone, and 5 μg/mL insulin) was added to the cells, followed by incubation for three days. Subsequently, the medium was replaced with high-glucose DMEM containing 10% FBS and 5 μg/mL insulin. The medium was changed every two days until the preadipocytes differentiated into white adipocytes, which were used in subsequent experiments.
Establishment of insulin resistance model
The differentiated adipocytes were incubated in serum-free, high-glucose DMEM containing 10 ng/mL TNF-α and 0.2% bovine serum albumin (BSA) to induce insulin resistance [Citation14].
3-(4,5-Dimethylthiazol-2-yl)-2,5-diphenyltetrazolium bromide (MTT) assay
Cell viability was determined by performing an MTT assay. Briefly, the cells were seeded in 96-well plates at 2 × 10⁴ cells/well, followed by incubation for 24 h. Next, 20 μL of MTT solution (5 mg/mL) was added to the cells, after which the mixture was incubated for another 4 h. The supernatant was replaced with dimethyl sulfoxide to lyse the cells. The absorbance of MTT was measured at 570 nm [Citation15].
Oil red O staining assay
Adipogenesis was determined in an oil red O staining assay as previously described [Citation16]. The cells were washed with phosphate-buffered saline (PBS) three times and fixed in 10% formaldehyde for 30 min, after which they were washed again and dyed with oil red O solution for 30 min. After removing the remaining dye with 60% isopropanol, images were captured under an inverted microscope (Olympus, Tokyo, Japan).
Enzyme-linked immunosorbent assay (ELISA)
IL-6, TNF-α, and IL-1β levels were measured by performing ELISA [Citation17] (Elabscience, Wuhan, China). 3T3-L1 preadipocytes were centrifugated at 300 × g for 5 min, after which the supernatant was collected, loaded into 96-well plates, and incubated at 37°C for 1 h. Similar treatments were performed on five gradient concentrations of the standard. Subsequently, the medium was removed and horseradish peroxidase−conjugated secondary antibodies were added to the contents of the plates. The plates were incubated at 37°C for 30 min, after which 3,3′,5,5′-tetramethylbenzidine solution was added to their contents for 15 min. Lastly, the stop solution was added to terminate the reaction. A microplate reader (BioTek, Winooski, VT, USA) was used to measure absorbance at 450 nm, after which concentrations were calculated based on standard curves.
Reverse transcription-polymerase chain reaction (RT-PCR) assay
TRIzol reagent was used to extract total RNA from adipocytes. RNA concentration was determined by measuring the optical density at 260 nm, followed by transcription into cDNA using PrimeScript RT Master Mix Kit (Takara Bio, Tokyo, Japan). SYBR Premix Ex Taq Kit (Takara Bio) was used to perform RT-PCR. The relative expression of target genes was calculated using the 2−ΔΔCT method after normalization to glyceraldehyde 3-phosphate dehydrogenase (GAPDH) expression [Citation18].
Luciferase activity of the nuclear factor kappa B (NF-κB) promoter
Cells were transfected with pNF-κB Luc reporter plasmid (Beyotime, Shanghai, China) and Lipofectamine 3000 (Thermo Fisher Scientific, Waltham, MA, USA), followed by incubation for 48 h. Reporter activity was determined using a luciferase reporter assay kit (BioVision Inc., Los Angeles, CA, USA) by measuring fluorescence intensity using a synergy microplate reader (Bio-Rad, Hercules, CA, USA) [Citation19].
Immunofluorescence assay
Adipocytes were washed with PBS three times and fixed in 4% paraformaldehyde for 15 min. The cells were then mixed with 0.5% Triton X-100 in PBS for 20 min at room temperature and incubated with 5% BSA to be blocked for 30 min. The primary antibody against NF-κB p65 (1:200, ab201340, Abcam, Cambridge, UK) was added to the cells, after which the mixture was incubated at 37°C for 3 h. Subsequently, the cells were incubated with secondary antibody (1:200; Lot01321; CWBio, Beijing, China) at 37°C for 45 min. After three washes with PBS, 4′,6-diamidino-2-phenylindole was added to the samples, followed by incubation in the dark for 5 min and blocking with 50% glycerin. Lastly, images were captured under a fluorescence microscope (CKX53, OLYMPUS, Tokyo, Japan) [Citation20].
Western blotting
Western blotting was performed as previously described [Citation21]. Following the extraction of total proteins from adipocytes using lysis buffer, a bicinchoninic acid kit (Cwbiotech, Beijing, China) was used to quantify the isolated proteins. Approximately 40 μg of protein was loaded and separated by 12% sodium dodecyl sulfate–polyacrylamide gel electrophoresis and then transferred onto polyvinylidene difluoride membrane (Millipore, Billerica, MA, USA). The membrane was incubated with 5% BSA (Solarbio, Beijing, China) followed by incubation with primary antibodies against inhibitor of nuclear factor kappa-B kinase (IKK) subunit beta, p-IKK, p-p65, p65, peroxisome proliferator-activated receptor gamma (PPAR-γ), CCAAT enhancer-binding protein alpha (C/EBPα), sterol regulatory element-binding protein (SREBP)-1 c, cleaved caspase-3, insulin receptor substrate 1 (IRS-1), glucose transporter type 4 (GLUT4), and GAPDH (1:1000 in each instance; Abcam, Cambridge, UK). Subsequently, the membrane was incubated with a secondary antibody (1:2000, Abcam) at room temperature for 1.5 h. Lastly, the bands were visualized with electrochemiluminescence solution and the relative expression level of each target protein was quantified using ImageJ software.
Statistical analysis
Data were analyzed using the GraphPad Prism software (GraphPad Software Inc., San Diego, CA, USA) and have been presented as mean ± standard deviation. One-way analysis of variance was used to compare data among groups, whereas t-test was used to compare two independent data. P values <0.05 were considered statistically significant.
Results
We hypothesized that BBR and Rb1 would have a synergetic inhibitory effect on TNF-α-induced inflammation in adipocytes. We first achieved the optimized incubation concentrations of BBR and Rb1 in adipocytes using the MTT assay. Afterward, we investigated the effects of BBR combined with Rb1 on cell proliferation, inflammation state, adipogenesis, and insulin resistance in TNF-α-treated adipocytes. Additionally, we evaluated the inhibitory effects of BBR combined with Rb1 on the NF-κB pathway in TNF-α-treated adipocytes. Lastly, the regulatory mechanisms underlying the effects of BBR+Rb1 on cell proliferation, inflammation, adipogenesis, and insulin resistance in the TNF-α-treated adipocytes were studied by introducing RANKL, which is an agonist of the NF-κB pathway.
Determination of the optimum concentrations of BBR and Rb1
To obtain the optimized concentrations of BBR and Rb1 in adipocytes, the cells were incubated with different concentrations of BBR (0, 1, 2.5, 5, 10, 20, and 40 μM) and Rb1 (0, 1, 2.5, 5, 10, 20, and 40 μM), followed by the assessment of cell viability using the MTT assay. As shown in ), BBR did not significantly affect cell viability over a concentration range of 0–10 μM. However, cell viability declined significantly when the concentration exceeded 20 μM. Similar results were obtained for Rb1 ()). Therefore, BBR and Rb1 were used at a concentration of 10 μM each in the subsequent in vitro experiments.
Figure 1. Viability of adipocytes treated with different concentrations of (a) BBR and (b) Rb1. Cell viability was determined by performing MTT assays. * indicates p < 0.05 and ** indicates p < 0.01 when data are compared to those obtained at 0 μM
Proliferation and inflammation of TNF-α-treated adipocytes were synergistically decreased by BBR and Rb1
To explore the synergistic protective effect of BBR and Rb1 on TNF-α-treated adipocytes, differentiated adipocytes were incubated with blank medium (Control group), 10 ng/mL TNF-α (TNF-α group), 10 ng/mL TNF-α and 10 μM BBR (BBR group), 10 ng/mL TNF-α and 10 μM Rb1 (Rb1 group), or 10 ng/mL TNF-α, 5 μM BBR, and 5 μM Rb1 (BBR+Rb1 group). As shown in ), the viability of cells in the TNF-α group was significantly low compared to that of cells in the Control group. However, cell viability was considerably increased by BBR, Rb1, and BBR+Rb1. Additionally, the viability of cells in the BBR+Rb1 group was higher than that in the BBR group or Rb1 group.
Figure 2. Synergistic effects of BBR and Rb1 on inflammation and the proliferation of TNF-α-treated adipocytes. (a) Cell viability was determined via MTT assay (**, p < 0.01, compared to Control; ##, p < 0.01, compared to TNF-α; &, p < 0.05, compared to BBR or Rb1). (b) IL-6, IL-1β, and TNF-α levels were measured by performing ELISA (**, p < 0.01, compared to Control; ##, p < 0.01, compared to TNF-α; &, p < 0.05, compared to BBR or Rb1; &&, p < 0.01, compared to BBR or Rb1). (c) The expression levels of Bcl-2 and cleaved caspase-3 were determined in western blot assays (**, p < 0.01, compared to Control; #, p < 0.05, compared to TNF-α; ##, p < 0.01, compared to TNF-α; &, p < 0.05, compared to BBR or Rb1; &&, p < 0.01, compared to BBR or Rb1)
ELISA was performed to assess the production of inflammatory factors. As shown in ), IL-6 concentration significantly increased from 105.29 pg/mL in the Control group to 481.78 pg/mL in the TNF-α group; however, it was considerably decreased afterward to 264.05 pg/mL and 254.99 pg/mL by BBR and Rb1, respectively, and to 150.06 pg/mL by BBR and Rb1 together. IL-1β concentration was found to be 16.52, 114.29, 73.78, 77.20, and 42.59 pg/mL in the Control, TNF-α, BBR, Rb1, and BBR+Rb1 groups, respectively. In addition, TNF-α concentration was increased from 132.83 pg/mL in the Control group to 543.03 pg/mL in the TNF-α group but was significantly decreased afterward to 282.50 pg/mL and 275.65 pg/mL by BBR and Rb1, respectively, and to 193.09 pg/mL by BBR+Rb1.
In the next experiment, we evaluated the expression levels of proteins involved in apoptosis in the treated adipocytes. As shown in ), TNF-α significantly downregulated the expression of B-cell lymphoma 2 (Bcl-2) but significantly upregulated that of cleaved caspase-3. These changes were considerably reversed by BBR, Rb1, and BBR+Rb1; however, the effects of BBR+Rb1 were higher than those of BBR or Rb1 alone.
Adipogenesis and insulin resistance in TNF-α-treated adipocytes were synergistically suppressed by BBR and Rb1
The results of the oil red O staining assay shown in ) indicate that the sum of area was significantly increased after the cells were stimulated with TNF-α but was substantially decreased in the BBR and Rb1 groups. Additionally, the sum of area was lower in the BBR+Rb1 group than in the BBR group or Rb1 group. In the next experiment, we assessed the expression levels of adipogenesis-related genes and proteins. As shown in ), the expression levels of PPAR-γ, C/EBPα, and SREBP-1 c were significantly higher in the TNF-α group than in the Control group but were drastically decreased by BBR and Rb1. Furthermore, the expression levels of PPAR-γ, C/EBPα, and SREBP-1 c were lower in the BBR+Rb1 group than in the BBR group or Rb1 group.
Figure 3. BBR and Rb1 synergistically suppressed adipogenesis and insulin resistance in TNF-α-treated adipocytes. (a) Adipogenesis was evaluated via oil red O staining assay (**, p < 0.01, compared to Control; ##, p < 0.01, compared to TNF-α; &, p < 0.05, compared to BBR or Rb1). (b) The gene and protein expression levels of PPAR-γ, C/EBPα, and SREBP-1 c were measured by performing RT-PCR and western blot assays, respectively (**, p < 0.01, compared to Control; ##, p < 0.01, compared to TNF-α; &&, p < 0.01, compared to BBR or Rb1). (c) The gene and protein expression levels of IRS-1 and GLUT4 were measured via RT-PCR and western blot assays, respectively (**, p < 0.01, compared to Control; ##, p < 0.01, compared to TNF-α; &, p < 0.05, compared to BBR or Rb1; &&, p < 0.01, compared to BBR or Rb1)
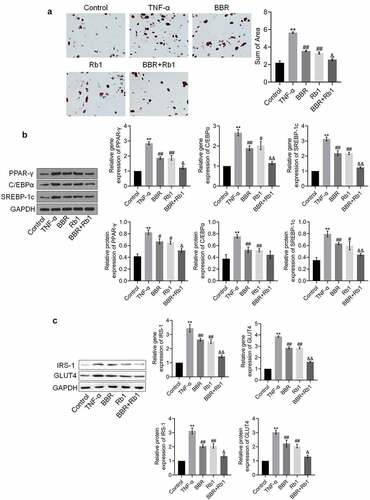
The expression levels of IRS-1 and GLUT4 are indicative of the state of insulin resistance. As shown in ), the expression levels of IRS-1 and GLUT4 were considerably increased by TNF-α but greatly decreased by BBR, Rb1, and BBR+Rb1; however, the effects of BBR+Rb1 were higher than those of BBR or RB1.
BBR and Rb1 synergistically inhibit the NF-κB pathway in TNF-α-treated adipocytes
To explore the mechanism underlying the anti-inflammatory effect of BBR+Rb1, NF-κB activity was evaluated in each group. As shown in , relative luciferase activity and the relative fluorescence intensity of NF-κB p65 were significantly increased by TNF-α but greatly decreased by BBR, Rb1, and BBR+Rb1. However, the effects of BBR+Rb1 were considerably higher than those of BBR or Rb1.
Figure 4. BBR and Rb1 synergistically inhibited the NF-κB pathway in TNF-α-treated adipocytes. (a) The transcriptional activity of NF-κB was evaluated by determining the luciferase activity of NF-κB promoter (**, p < 0.01, compared to Control; ## p < 0.01, compared to TNF-α; &&, p < 0.01, BBR or Rb1). (b) The expression level of NF-κB p65 was evaluated in an immunofluorescence assay (**, p < 0.01, compared to Control; ##, p < 0.01, compared to TNF-α; &&, p < 0.01, compared to BBR or Rb1). (c) The expression levels of p-IKK, IKK-β, p-p65, and p65 were measured in western blot assays (**, p < 0.01, compared to Control; #, p < 0.05, compared to TNF-α; ##, p < 0.01, compared to TNF-α; &, p < 0.05, compared to BBR or Rb1)
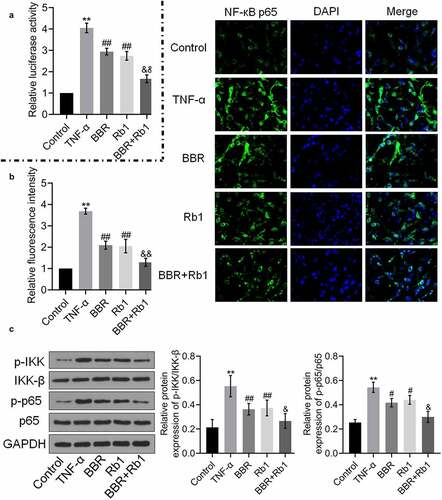
Additionally, as shown in ), the relative expression levels of p-IKK/IKK-β and p-p65/p65 were markedly higher in the TNF-α group than in the control group but were reduced by BBR, Rb1, and BBR+Rb1, with the effect of BBR+Rb1 being higher than that of BBR or Rb1.
RANKL inhibited the effects of BBR+Rb1 on the proliferation and inflammation of TNF-α-treated adipocytes
We investigated whether the anti-inflammatory effect of BBR+Rb1 was mediated via the NF-κB pathway by co-incubating the cells with RANKL (a natural agonist of the NF-κB pathway) and BBR+Rb1. In the experiment, adipocytes were incubated with blank medium (Control group); 10 ng/mL TNF-α (TNF-α group); 10 ng/mL TNF-α, 5 μM BBR, and 5 μM Rb1 (BBR+Rb1 group); or 10 ng/mL TNF-α, 5 μM BBR, 5 μM Rb1, and 100 ng/mL RANKL [Citation22] (BBR+Rb1+ RANKL group). As shown in ), cell viability was significantly lower in the TNF-α group than in the Control group but was greatly increased after co-incubation with BBR and Rb1. Moreover, cell viability was decreased more by RANKL than by BBR+Rb1.
Figure 5. RANKL inhibited the effects of BBR+Rb1 on inflammation and the proliferation of TNF-α-treated adipocytes. (a) Cell viability was determined via an MTT assay (**, p < 0.01, compared to Control; ##, p < 0.01, compared to TNF-α; &&, p < 0.01, compared to BBR+Rb1). (b) IL-6, IL-1β, and TNF-α levels in the different groups were measured be performing ELISA (**, p < 0.01, compared to Control; ##, p < 0.01, compared to TNF-α; &&, p < 0.01, compared to BBR+Rb1). (c) The expression levels of Bcl-2 and cleaved caspase-3 were determined in western blot assays (**, p < 0.01, compared to Control; ##, p < 0.01, compared to TNF-α; &&, p < 0.01, compared to BBR+Rb1)
As shown in ), IL-6 concentration was significantly increased from 102.90 pg/mL to 490.66 pg/mL by TNF-α but was substantially decreased to 142.98 pg/mL after the cells were co-treated with BBR and Rb1. Furthermore, compared to BBR+Rb1, RANKL markedly reversed the effect of TNF-α on IL-6 secretion. Specifically, RANKL increased IL-6 concentration to 389.11 pg/mL. IL-1β concentration was found to be 13.39, 121.90, 39.17, and 83.07 pg/mL in the Control, TNF-α, BBR+Rb1, and BBR+Rb1+ RANKL groups, respectively. In addition, TNF-α concentration was considerably increased from 129.31 pg/mL to 535.42 pg/mL after the cells were stimulated with TNF-α but was significantly suppressed to 188.59 pg/mL by BBR+Rb1. TNF-α concentration was drastically increased to 482.91 pg/mL in the BBR+Rb1+ RANKL group.
The expression levels of apoptosis-related proteins in the treated adipocytes were also evaluated in the study. As shown in ), Bcl-2 expression was significantly downregulated, whereas the expression of cleaved caspase-3 was significantly upregulated in the TNF-α group. However, these effects were reversed after the co-treatment with BBR and Rb1. The results showed that the addition of RANKL resulted in a higher suppression of Bcl-2 expression and a higher increase in the expression of cleaved caspase-3 compared to the effects of only BBR+Rb1.
RANKL inhibited the effects of BBR+Rb1 on adipogenesis and insulin resistance in TNF-α-treated adipocytes
We evaluated the state of adipogenesis after the cells were treated with RANKL. As shown in ), the sum of area significantly increased after the treatment with TNF-α; however, it was considerably decreased in the BBR+Rb1 group. Moreover, the sum of area was higher in the BBR+Rb1+ RANKL group than in the BBR+Rb1 group.
Figure 6. RANKL inhibited the effects of BBR+Rb1 on adipogenesis and insulin resistance in TNF-α-treated adipocytes. (a) Adipogenesis was evaluated by performing oil red O staining assay (**, p < 0.01, compared to Control; ##, p < 0.01, compared to TNF-α; &&, p < 0.05, compared to BBR+Rb1). (b) The gene and protein expression levels of PPAR-γ, C/EBPα, and SREBP-1 c were measured in RT-PCR and western blot assays, respectively (**, p < 0.01, compared to Control; ##, p < 0.01, compared to TNF-α; &&, p < 0.05, compared to BBR+Rb1). (c) The gene and protein expression levels of IRS-1 and GLUT4 were measured in RT-PCR and western blot assays, respectively (**, p < 0.01, compared to Control; ##, p < 0.01, compared to TNF-α; &&, p < 0.01, compared to BBR+Rb1)
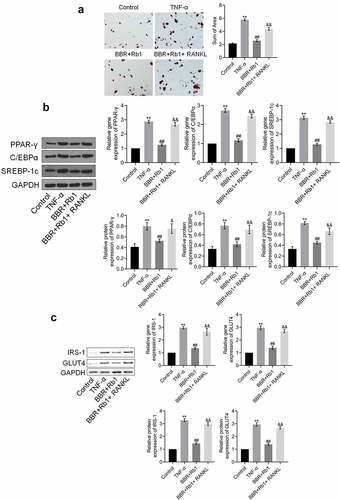
The results also showed that the expression levels of PPAR-γ, C/EBPα, and SREBP-1 c were significantly increased by TNF-α but were decreased after the co-treatment with BBR and Rb1. Additionally, the expression levels of PPAR-γ, C/EBPα, and SREBP-1 c were markedly increased by RANKL ()).
We further evaluated the expression of proteins involved in insulin resistance to assess the effects of the various agents. As shown in ), the expression levels of IRS-1 and GLUT4 were markedly higher in the TNF-α group than in the Control group; however, they were considerably decreased after the co-treatment with BBR and Rb1. Additionally, compared to the BBR+Rb1 group, the group treated with RANKL showed a markedly higher upregulation of IRS-1 and GLUT4 expression.
RANKL inhibited the effects of BBR+Rb1 on the NF-κB pathway in TNF-α-treated adipocytes
As shown in , the relative luciferase activity and fluorescence intensity of NF-κB p65 were significantly increased in the TNF-α group but markedly decreased in the BBR+Rb1 group. Furthermore, relative luciferase activity and the relative fluorescence intensity of NF-κB p65 were markedly higher in the BBR+Rb1+ RANKL group than in the BBR+Rb1 group.
Figure 7. RANKL inhibited the effects of BBR+Rb1 on the NF-κB pathway in TNF-α-treated adipocytes. (a) The transcriptional activity of NF-κB was evaluated by measuring the luciferase activity of NF-κB promoter (**, p < 0.01, compared to Control; ##, p < 0.01, compared to TNF-α; &&, p < 0.01, compared to BBR+Rb1). (b) The expression level of NF-κB p65 was evaluated in an immunofluorescence assay (**, p < 0.01, compared to Control; ##, p < 0.01, compared to TNF-α; &&, p < 0.01, compared to BBR+Rb1). (c) The expression levels of p-IKK, IKK-β, p-p65, and p65 were determined in western blot assays (**, p < 0.01, compared to Control; ##, p < 0.01, compared to TNF-α; &&, p < 0.01, compared to BBR+Rb1)
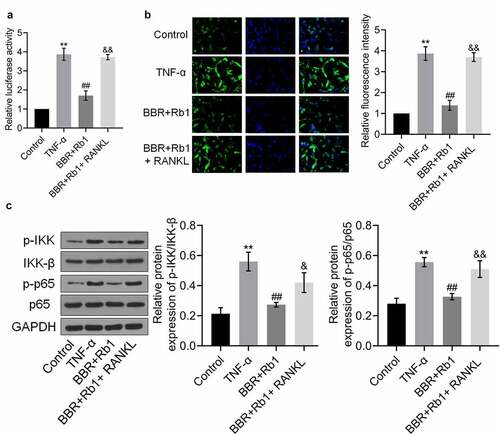
Finally, ) shows that the relative expression levels of p-IKK/IKK-β and p-p65/p65 were markedly higher in the TNF-α group than in the Control group, but were decreased after the co-treatment with BBR and Rb1. Additionally, the expression levels of p-IKK/IKK-β and p-p65/p65 were higher in the BBR+Rb1+ RANKL group than in the BBR+Rb1 group.
Discussion
Obesity is defined as the excessive accumulation of fat transformed from superfluous energy. It has been reported by the World Health Organization that a BMI that is higher than 30 kg/m2 indicates obesity [Citation23]. The quickening pace of life and changes in diet cause increased morbidity annually as a result of obesity [Citation24]. It was recently reported that chronic inflammation is involved in the pathogenesis of obesity [Citation25]. The hypothalamic-pituitary-adrenal axis and the autonomic nervous system are usually activated to prevent the development of obesity. However, this induces an increase in glucocorticoid production to trigger the differentiation of preadipocytes. Consequently, the growth of white adipose tissue is accelerated. During this vicious circle, there is an excessive release of proinflammatory factors such as TNF-α and IL-6, which finally results in the induction of chronic inflammation in adipose tissues [Citation26].
In the present study, an insulin resistance model was established in adipocytes by incubating the cells with TNF-α. This model has been widely used to investigate adipogenesis and lipolysis in different studies [Citation14,Citation27]. Our results showed that TNF-α decreased the viability of the adipocytes. Additionally, it increased adipogenesis as well as the production of inflammatory factors. The effects of TNF-α are consistent with those obtained in previous studies [Citation28]. We also found that BBR and Rb1, as individual agents, significantly ameliorated proliferation, inflammation, and adipogenesis in the TNF-α-treated adipocytes, which are consistent with previously reported effects of BBR [Citation29]. Interestingly, a synergetic effect was observed after treating the cells with 5 μM BBR and 5 μM Rb1 compared to 10 μM BBR or 10 μM Rb1. Therefore, we believe that BBR and Rb1 can be combined in future clinical therapeutic strategies for obesity management to achieve improved anti-obesity effects of the two compounds.
NF-κB is a transcriptional factor that is widely distributed in different types of cells. It plays a role in inflammatory reactions by regulating the expression levels of cytokines, chemokines, and adhesion molecules [Citation30]. Under normal physiological conditions, NF-κB is located in the cytoplasm, where it remains inactive by binding to its inhibitor IκB. The kinase of IκB (IKK) can be activated by inflammatory factors and during ischemic stress. IKK is a complex consisting of three subunits: IKK-α, IKK-β, and IKK-γ. It is reported that IKK-β is the essential subunit for the activation of the NF-κB signaling pathway. Consequently, it is an important mediator for multiple proinflammatory elements to activate NF-κB. Once IKK-β is activated, IκB phosphorylation is induced; this leads to the inactivation of IκB, which further disassociates from NF-κB to induce the transfer of NF-κB from the cytoplasm into the nucleus. Consequently, the transcription of different inflammatory factors is activated by NF-κB p65, a variant of NF-κB in the nucleus, which finally triggers the development of chronic inflammation in adipose tissues [Citation31].
In the present study, we found that the NF-κB signaling pathway was significantly activated in TNF-α-treated adipocytes, which was consistent with previous findings [Citation32]. To investigate whether the anti-inflammatory effect of BBR+Rb1 was mediated via inhibition of the NF-κB signaling pathway, TNF-α-stimulated adipocytes were treated with RANKL, which is a natural activator of NF-κB [Citation33], and BBR+Rb1. Interestingly, the effects of BBR+Rb1 on inflammation, adipogenesis, and the proliferation of the TNF-α-treated adipocytes were significantly inhibited by RANKL. This indicated that the therapeutic effects of BBR+Rb1 on TNF-α-treated adipocytes were mediated via suppression of the NF-κB signaling pathway. In our future work, the regulatory effects of BBR+Rb1 on the upstream pathway of NF-κB signaling will be further investigated to better understand the mechanism underlying the potential anti-obesity effect of BBR+Rb1.
Conclusion
Our study revealed that BBR and Rb1 have a synergetic protective effect against TNF-α-induced inflammation in adipocytes through inhibition of the NF-κB signaling pathway.
Research highlights
BBR and Rb1 have a synergetic effect on adipogenesis.
BBR and Rb1 have a synergetic effect on inflammation in adipocytes.
BBR and Rb1 have a synergetic inhibitory effect on the NF-κB signaling pathway.
Disclosure statement
No potential conflict of interest was reported by the author(s).
Additional information
Funding
References
- Bluher M. Obesity: global epidemiology and pathogenesis. Nat Rev Endocrinol. 2019;15(5):288–298.
- Reaven GM. Banting lecture 1988. Role of insulin resistance in human disease. Diabetes. 1988;37(12):1595–1607.
- Bochud M, Marquant F, Marques-Vidal PM, et al. Association between C-reactive protein and adiposity in women. J Clin Endocrinol Metab. 2009;94(10):3969–3977.
- Welsh P, Polisecki E, Robertson M, et al. Unraveling the directional link between adiposity and inflammation: a bidirectional Mendelian randomization approach. J Clin Endocrinol Metab. 2010;95(1):93–99.
- Zou K, Li Z, Zhang Y, et al. Advances in the study of berberine and its derivatives: a focus on anti-inflammatory and anti-tumor effects in the digestive system. Acta Pharmacol Sin. 2017;38(2):157–167.
- Sun SF, Zhao TT, Zhang HJ, et al. Renoprotective effect of berberine on type 2 diabetic nephropathy in rats. Clin Exp Pharmacol Physiol. 2015;42(6):662–670.
- Choi BH, Kim YH, Ahn IS, et al. The inhibition of inflammatory molecule expression on 3T3-L1 adipocytes by berberine is not mediated by leptin signaling. Nutr Res Pract. 2009;3(2):84–88.
- Ilyas Z, Perna S, Al-Thawadi S, et al. The effect of Berberine on weight loss in order to prevent obesity: a systematic review. Biomed Pharmacother. 2020;127:110137.
- Lan TH, Xu DP, Huang MT, et al. Ginsenoside Rb1 prevents homocysteine-induced EPC dysfunction via VEGF/p38MAPK and SDF-1/CXCR4 activation. Sci Rep. 2017;7(1):13061.
- Liu DH, Chen YM, Liu Y, et al. Ginsenoside Rb1 reverses H2O2-induced senescence in human umbilical endothelial cells: involvement of eNOS pathway. J Cardiovasc Pharmacol. 2012;59(3):222–230.
- Lu JM, Weakley SM, Yang Z, et al. Ginsenoside Rb1 directly scavenges hydroxyl radical and hypochlorous acid. Curr Pharm Des. 2012;18(38):6339–6347.
- Lin N, Cai DL, Jin D, et al. Ginseng panaxoside Rb1 reduces body weight in diet-induced obese mice. Cell Biochem Biophys. 2014;68(1):189–194.
- Yu X, Ye L, Zhang H, et al. Ginsenoside Rb1 ameliorates liver fat accumulation by upregulating perilipin expression in adipose tissue of db/db obese mice. J Ginseng Res. 2015;39(3):199–205.
- Cheng AW, Tan X, Sun JY, et al. Catechin attenuates TNF-alpha induced inflammatory response via AMPK-SIRT1 pathway in 3T3-L1 adipocytes. PloS One. 2019;14(5):e0217090.
- Yang H, Lv H, Li H, et al. Oridonin protects LPS-induced acute lung injury by modulating Nrf2-mediated oxidative stress and Nrf2-independent NLRP3 and NF-kappaB pathways. Cell Commun Signal. 2019;17(1):62.
- Duangjai A, Nuengchamnong N, Suphrom N, et al. Potential of coffee fruit extract and quinic acid on adipogenesis and lipolysis in 3T3-L1 Adipocytes. Kobe J Med Sci. 2018;64:E84–E92.
- Ma Y, Ren Y, Dai ZJ, et al. IL-6, IL-8 and TNF-alpha levels correlate with disease stage in breast cancer patients. Adv Clin Exp Med. 2017;26(3):421–426.
- Lin X, Bai D, Wei Z, et al. Curcumin attenuates oxidative stress in RAW264.7 cells by increasing the activity of antioxidant enzymes and activating the Nrf2-Keap1 pathway. PloS One. 2019;14:e0216711.
- Deb DK, Chen Y, Zhang Z, et al. 1,25-Dihydroxyvitamin D3 suppresses high glucose-induced angiotensinogen expression in kidney cells by blocking the NF-κB pathway. Am J Physiol Renal Physiol. 2009;296(5):F1212–8.
- Liu MF, Du CK, Su XY. Forskolin induced remodeling of lipid droplets in rat adipocytes. Sheng Li Xue Bao. 2019;71:379–387.
- Guo Y, Zhu X, Sun X. COTI-2 induces cell apoptosis in pediatric acute lymphoblastic leukemia via upregulation of miR-203. Bioengineered. 2020;11(1):201–208.
- Huang J, Zhou L, Wu H, et al. Triptolide inhibits osteoclast formation, bone resorption, RANKL-mediated NF-B activation and titanium particle-induced osteolysis in a mouse model. Mol Cell Endocrinol. 2015;399:346–353.
- Mayoral LP, Andrade GM, Mayoral EP, et al. Obesity subtypes, related biomarkers & heterogeneity. Indian J Med Res. 2020;151(1):11–21.
- Poston L, Caleyachetty R, Cnattingius S, et al. Preconceptional and maternal obesity: epidemiology and health consequences. Lancet Diabetes Endocrinol. 2016;4(12):1025–1036.
- Kuroda M, Sakaue H. Adipocyte death and chronic inflammation in obesity. J Med Invest. 2017;64(3.4):193–196.
- Karalis KP, Giannogonas P, Kodela E, et al. Mechanisms of obesity and related pathology: linking immune responses to metabolic stress. FEBS J. 2009;276(20):5747–5754.
- Xia W, Zhou Y, Wang L, et al. Tauroursodeoxycholic acid inhibits TNF-alpha-induced lipolysis in 3T3-L1 adipocytes via the IRE-JNK-perilipin-A signaling pathway. Mol Med Rep. 2017;15(4):1753–1758.
- Wu D, Xi QY, Cheng X, et al. miR-146a-5p inhibits TNF-alphainduced adipogenesis via targeting insulin receptor in primary porcine adipocytes. J Lipid Res. 2016;57(8):1360–1372.
- Choi BH, Ahn IS, Kim YH, et al. Berberine reduces the expression of adipogenic enzymes and inflammatory molecules of 3T3-L1 adipocyte. Exp Mol Med. 2006;38(6):599–605.
- Baker RG, Hayden MS, Ghosh S. NF-kappaB, inflammation, and metabolic disease. Cell Metab. 2011;13(1):11–22.
- Suganami T, Tanimoto-Koyama K, Nishida J, et al. Role of the Toll-like receptor 4/NF-kappaB pathway in saturated fatty acid-induced inflammatory changes in the interaction between adipocytes and macrophages. Arterioscler Thromb Vasc Biol. 2007;27(1):84–91.
- Contreras-Nunez E, Blancas-Flores G, Cruz M, et al. Participation of the IKK-alpha/beta complex in the inhibition of the TNF-alpha/NF-kappaB pathway by glycine: possible involvement of a membrane receptor specific to adipocytes. Biomed Pharmacother. 2018;102:120–131.
- Wu L, Luo Z, Liu Y, et al. Aspirin inhibits RANKL-induced osteoclast differentiation in dendritic cells by suppressing NF-kappaB and NFATc1 activation. Stem Cell Res Ther. 2019;10(1):375.