
ABSTRACT
Alzheimer’s Disease (AD) is a neurodegenerative disease featured by cognitive impairment. This bioinformatic analysis was used to identify hub genes related to cognitive dysfunction in AD. The gene expression profile GSE48350 in the hippocampus of AD patients aged >70 years was obtained from the Gene Expression Omnibus (GEO) database. A total of 96 differentially expressed genes (DEGs) were identified, and subjected to Gene Ontology (GO), Kyoto Encyclopedia of Genes and Genomes (KEGG) pathway enrichment analyses; a protein–protein interaction (PPI) network was constructed. The DEGs were enriched in synapse-related changes. A protein cluster was teased out of PPI. Furthermore, the cognition ranked the first among all the terms of biological process (BP). Next, 4 of 10 hub genes enriched in cognition were identified. The function of these genes was validated using APP/PS1 mice. Cognitive performance was validated by Morris Water Maze (MWM), and gene expression by RT-qPCR, Cholecystokinin (CCK), Tachykinin precursor 1 (TAC1), Calbindin 1 (CALB1) were downregulated in the hippocampus. These genes can provide new directions in the research of the molecular mechanism of AD.
Introduction
Alzheimer’s Disease (AD) is a neurodegenerative disease featured by cognitive decline, disorientation, abnormal behavior, impaired mobility, hallucinations, seizures, and emotional instability [Citation1] [Citation2]. The prevalence of AD is positively related to age, with an incidence of 10% to 30% in patients aged over 65 and doubling every 10 years after 60 [Citation3]. However, the mechanism underpinning AD remains controversial. Given its close relevance with age, amyloid-beta (Aβ) and tau protein accumulated in the aging brain may serve as critical players in AD [Citation4].
AD patients show short-term memory deficits. In the central nervous system (CNS), the hippocampus plays a vital role in the formation and consolidation of memory by long-term potentiation (LTP) and synaptic remodeling [Citation5]. Therefore, it has been researched extensively in the field of cognition. In the pathology of AD, the hippocampus suffers damage arising from abnormal amyloid beta-peptide and p-tau.
Microarray analysis or high-throughput sequencing have been employed to mine the potential biomarkers or therapeutic targets of AD. Berchtold NC et al. used a microarray method to obtain RNA expression profiles in different postmortem brain regions of AD patients, including the postcentral gyrus, superior frontal gyrus, entorhinal cortex and hippocampus [Citation6]. GSE48350 has also been used in some other studies [Citation7–12]. In these studies, however, other factors (e.g., immunity, aging, toxicity) and samples (e.g., cortex, blood) are analyzed.
Here we aim to identify genes responsible for the cognitive decline in the hippocampus.
2. Method
2.1. Data source
The original microarray dataset (.CEL file) was downloaded from the Gene Expression Omnibus (GEO) database (https://www.ncbi.nlm.nih.gov/geo/) in May 2020. GSE48350 was based on GPL570 platform (HG-U133_Plus_2), composed of postmortem brain samples from the AD patients and normal people. The samples meeting the following criteria were included: (1) from the hippocampus; (2) from aged patients (over 70-year-old). As a result, a total of 40 samples from the hippocampus were restricted into further analysis, including 19 samples from AD patients and 21 samples from normal people as a control group. (AD group: GSM1176221, GSM1176222, GSM1176223, GSM1176224, GSMx1176225, GSM1176226, GSM1176227, GSM1176228, GSM1176229, GSM1176211, GSM1176212, GSM1176213, GSM1176214, GSM1176215, GSM1176216, GSM1176217, GSM1176218, GSM1176219, GSM1176220; Control group: GSM300169, GSM300170, GSM300178, GSM300182, GSM300185, GSM300205, GSM300215, GSM300235, GSM300268, GSM300333, GSM300168, GSM300171, GSM300172, GSM300190, GSM300193, GSM300197, GSM300223, GSM300227, GSM300239, GSM300329, GSM300339).
2.2. Data preprocessing
Data processing was conducted using R (version 4.0.2) [Citation13]. The R package Affy was utilized to read raw data [Citation14], then the Robust Multichip Averaging (RMA) algorithm was used to normalize the data about the samples [Citation15], insuring that each sample was comparable. Probe ID was transferred to gene name according to the platform’s annotation. When a gene corresponded to multiple probes, the median expression value in various probe IDs was taken to represent the duplicated gene’s expression.
2.3. Identification of differentially expressed genes (DEGs)
The LIMMA package is a R’s extension for the analysis of gene expression data via linear models [Citation16]. It was used to compare the gene expression between AD group and control group in our study. Differentially expressed genes (DEGs) were identified according to P value < 0.05 and the absolute value of Fold Change > 2 (log2 |Fold Change| > 1).
2.4. Enrichment analysis of DEGs
The clusterProfiler is a package for functional and comparative study in R [Citation17]. Gene ontology (GO) and Kyoto Encyclopedia of Genes and Genomes (KEGG) enrichment analyses were performed via clusterProfiler package in our research. GO analysis covers three aspects about cellular component (CC), biological function (BP) and molecular function (MF). KEGG enrichment analysis covers pathways responsible for molecular interactions and biochemical reactions. A threshold of P < 0.05 and enrichment counts > 2 were set as thresholds. Replicated terms with different descriptions were removed.
2.5. PPI network of DEGs
Search Tool for the Retrieval of Interacting Genes (STRING) database(https://string-db.org/) is an online tool to calculate PPI connections and identify the potential relationship among DEGs [Citation18]. The Cytoscape software was used to visualize the results [Citation19]. The clusters of PPI were identified by MCODE tool, a plugin that defines highly interconnected regions in a network. The hub genes were screened out by the plugin cytoHubba, a tool that identifies hub genes through multiple algorithms [Citation20]. The intersections of four ranking algorithms, including Maximal Clique Centrality (MCC), Density of Maximum Neighborhood Component (DMNC), Maximum Neighborhood Component (MNC), Degree, were considered as hub genes.
2.6. Animal experiments
All experiments were conducted observing related laws and guidelines. All procedures were approved by the Nanjing University Institutional Animal Care and Use Committee. All processing methods were in line with Directive 2010/63/EU. Male APP/PS1 transgenic mice (aged 18 months) and wild-type littermates were purchased from Ziyuan Laboratory Animal Technology Co. Ltd. (Hangzhou, China) in June 2020. All mice were housed in separated cages with free access to food and water in a room under a 12 h light/dark cycle, with a temperature of 22 ± 2°C and a humidity of 50–70%. The behavioral test initiated after all the mice adjusted to the environment for 2 weeks.
2.7. Morris water maze
The MWM test contained a training phase and a probe test phase [Citation21]. The training phase was performed for five consecutive days. Each mouse completed four trials in different quadrants. In each trial, a mouse was allowed to search the platform within 60s and stay on the platform for 15s afterward. The mouse that failed to find the platform within 60s was manually guided to the platform and stayed at the platform for 30s. 60s was recorded as the escape latency. The probe test was performed on the 6th day, the platform was removed, and the mice were placed into 2 selected quadrants that did not contain the platform and were allowed to swim for 60s. The percentage of time spent in the target quadrant and platform crossings were recorded and analyzed.
2.8. RNA extraction and RT-qPCR
Mice were sacrificed after 2 hours of MWM. Total RNA was extracted from the hippocampus of the mice using TRIzol reagent (Vazyme, China), then cDNA was synthesized using HiScript Q RT SuperMix (Vazyme, China) according to manufacturer’s protocol. The SYBR qPCR master mix (Vazyme, China) was used to detect the relative mRNA expression in the QuantStudio 5 instrument (Applied Biosystems Inc.). The relative expression level was determined by the 2−ΔΔCt method and normalized to loading control β-actin. Primers of four hub genes were shown as follow:
β-actin forward primer 5ʹ-CTGTCCCTGTATGCCTCTG-3ʹ, reverser primer 5ʹ-ATGTCACGCACGATTTCC-3ʹ;
CCK forward primer 5ʹ-ATACATCCAGCAGGTCCGCAA-3ʹ, reverse primer 5ʹ- CAGACATTAGAGGCGAGGGGT-3ʹ;
TAC1 forward primer 5ʹ-CTAAATTATTGGTCCGACTG-3ʹ, reverse primer 5ʹ-TTCTGCATTGCGCTTCTTTC-3ʹ;
CALB1 forward primer 5ʹ-TCTGGCTTCATTTCGACGCTG-3ʹ, reverse primer 5ʹ-ACAAAGGATTTCATTTCCGGTGA-3ʹ;
CNR1 forward primer 5ʹ-AAGTCGATCTTAGACGGCCTT-3ʹ, reverse primer 5ʹ-TCCTAATTTGGATGCCATGTCTC-3ʹ.
2.9. Statistical analysis
All data were expressed as the mean ± SD. Data collected from the MWM training phase were analyzed using a repeated-measures ANOVA, followed by Student’s t-test for between-group comparison. The RNA expression of hub genes was analyzed using Student’s t-test. All data were analyzed with SPSS 26.0 software, and P < 0.5 was considered a significant difference.
3. Results
In this study, we identified hub genes associated with cognitive decline in AD patients by bioinformatic tools, including GO and KEGG enrichment analyses, PPI network analysis. Then we validated our findings by RT-qPCR on APP/PS1 mice. The aim was to delve into the molecular mechanism of cognitive dysfunction in AD and provide new options of diagnosis and treatment.
3.1. Identification of DEGs
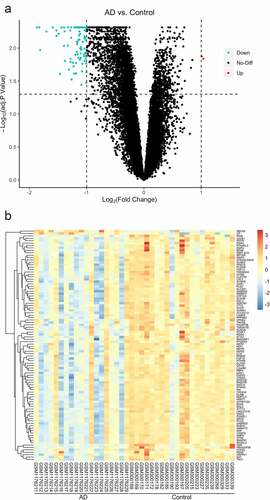
The dataset GSE48350 contained the expression profiles of genes in the hippocampus of 21 AD patients and 19 normal people. In total, 96 DEGs were identified between the two groups, with 2 upregulated and 94 downregulated. The expression levels in two upregulated genes increased by over twofold (ABCA6, CP). Of the 94 downregulated genes, the expression levels decreased by over fourfold in 2 (CALB1, TAC) and over onefold in 92 (PDYN, BDNF, etc.). All DEGs were visualized in volcano plot and heatmap ().
Figure 1. The visualization of differential gene expression profile (a) A volcano plot of the expression of DEGs in the whole gene profile, significantly upregulated genes are indicated in red, downregulated in green (b) Cluster pattern of Heat map concerning DEGs, high level expressions are indicated in red, low level in blue
3.2. GO and KEGG enrichment analyses
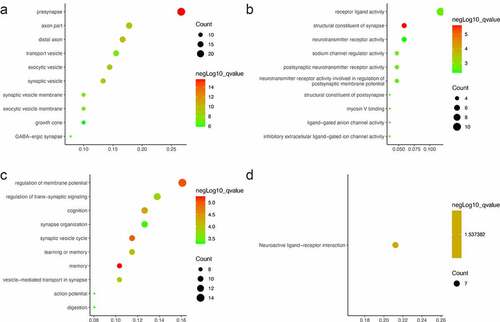
The 96 DEGs were then submitted to GO and KEGG pathway enrichment analyses. In the aspect of cellular component (CC), the DEGs were enriched in presynapse, axon part, distal axon ()). In the aspect of molecular function (MF), the DEGs were enriched in receptor ligand activity, structural constituent of synapse, neurotransmitter receptor activity ()). In the aspect of biological process (BP), the DEGs were significantly enriched in the regulation of membrane potential, regulation of trans-synaptic signaling, and cognition ()). In KEGG pathway enrichment analysis, the DEGs were enriched in neuroactive ligand–receptor interaction ()).
Figure 2. GO and KEGG pathway enrichment results of DEGs: (a) cellular component, (b) molecular function, (c) biological process, (d) KEGG pathways
3.3. PPI
After removing isolated proteins from the PPI network, 69 proteins were identified from the STRING database. Using MCODE, a cluster composed of PENK, CNR1, CALB1, TAC1, SST, GNG, CCK, BDNF, GAD1 and PDYN was identified ()). The cluster was then subjected to GO and KEGG analyses. In the aspect of CC, the DEGs in the cluster were enriched in presynapse, distal axon, axon part ()), neuronal cell body. In the aspect of MF, these DEGs were enriched in receptor ligand activity, hormone activity, G protein-coupled receptor binding (). In the aspect of BP, these DEGs were enriched in cognition, sensory perception of pain (). In KEGG pathway enrichment analysis, the DEGs were enriched in neuroactive ligand–receptor interaction ().
Figure 3. PPI network and GO/KEGG pathway enrichment results of genes in the cluster (a) DEGs in Protein-protein interaction network. Nodes in red represent upregulated genes and nodes in blue represent downregulated genes, the internal circle indicates the cluster (b) cellular component, (c) molecular function (d) biological process, (e) KEGG pathway
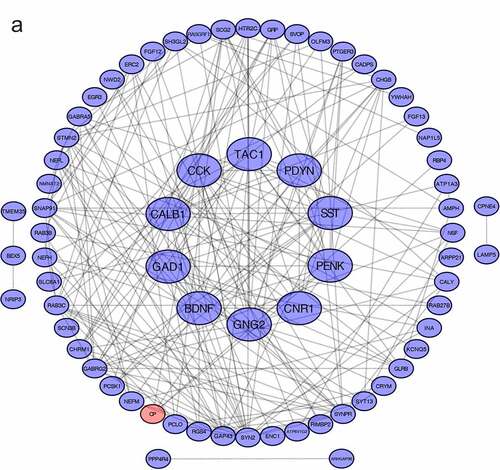
Figure 3. Continued
3.4. Hub genes
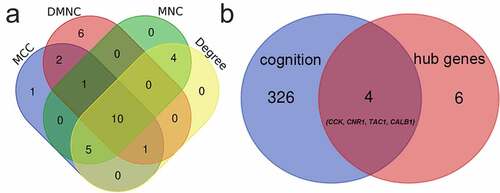
The tool cytoHubba in Cytoscape was used to screened out the hub genes. The top 20 genes in four ranked algorithms (MCC, DMNC, MNC, Degree) were figured out, and the intersections between the four algorithms were considered as the hub genes (, )). Finally, 10 genes were screened out. Of them, 4 genes, including Cholecystokinin (CCK), Cannabinoid receptor type 1 (CNR1), Tachykinin precursor 1 (TAC1), Calbindin 1 (CALB1), were identified related to cognitive dysfunction in BPs of Gene Ontology ()).
Table 1. Top 20 genes and the intersection in the cytoHubba. MCC, Maximal Clique Centrality. DMNC, Density of Maximum Neighborhood Component. MNC, Maximum Neighborhood Component
Figure 4. Venn diagrams for identification of hub genes (a) 10 hub genes were identified via the intersection of four algorithms (b) 4 genes related to the cognition according to biological process of Gene Ontology database. CALB1, Calbindin 1. TAC1, Tachykinin precursor 1. CCK, cholecystokinin. CNR1, cannabinoid receptor type 1
3.5. Impaired cognition of APP/PS1 mice in the Morris water maze
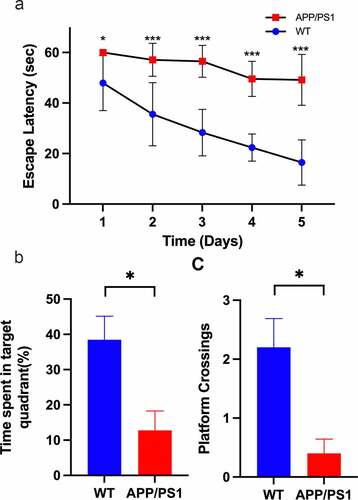
In MWM test, repeated measures ANOVA indicated a significant difference between the two groups (F[1,8] = 44.134, P < 0.0001). Wild-type mice showed a more pronounced downward trend than APP/PS1 in five consecutive days. In each day, APP/PS1 mice spent more time in finding the platform than wild-type mice: D1(60 ± 0 vs 47.90 ± 10.86, P = 0.038), D2(57.90 ± 6.50 vs 35.56 ± 12.48, P = 0.009), D3(56.48 ± 6.30 vs 28.30 ± 9.20, P < 0.0001), D4(49.54 ± 6.92 vs 22.38 ± 5.35, P < 0.0001), D5(49.17 ± 10.06 vs 16.46 ± 8.94, P = 0.001). In the probe test, there was a decline in the number of crossing removed platform (P = 0.018) and the time stayed in the platform quadrant (P = 0.011) (). So, APP/PS1 mice showed a cognitive impairment compared with wild-type littermates.
Figure 5. Validation of APP/PS1 mice. A. APP/PS1 mice spent more time finding the platform than wildtype mice in training phase, Day1(60 ± 0 vs 47.90 ± 10.86, P = 0.038), Day2(57.90 ± 6.50 vs 35.56 ± 12.48, P = 0.009), Day3(56.48 ± 6.30 vs 28.30 ± 9.20, P < 0.0001), Day4(49.54 ± 6.92 vs 22.38 ± 5.35, P < 0.0001), Day5(49.17 ± 10.06 vs 16.46 ± 8.94, P = 0.001). B. In probe test, the number of crossing removed platform location declined in APP/PS1 mice (P = 0.018) C. In probe test, the time stayed in the platform quadrant declined in APP/PS1 mice (P = 0.011)
3.6. Validation of hub genes
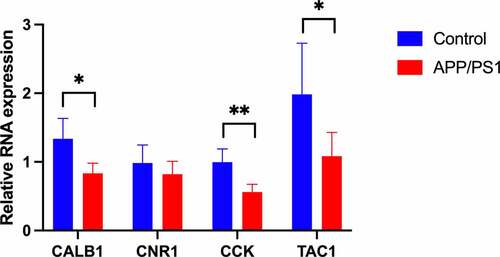
To validate the reliability of bioinformatic analysis, RT-qPCR was performed for hippocampal samples harvested from mice (five mice and control littermate). The expression of four hub genes was measured (). Compared with those in the normal tissue, the expression levels of four genes were decreased in the tissue samples of AD mice, with significance in three genes (P < 0.05).
Figure 6. mRNA expression of four hub genes in two groups. CALB1, CCK, TAC1 showed a significant difference between the two groups. CALB1(P = 0.01), TAC1(P = 0.039), CCK (P = 0.02), CNR1 (P = 0.29)
4. Discussion
Therapeutic targets for human AD remain to be discovered. Berchtold NC et al. made use of a microarray method to analyze RNA expression profiles in different brain regions of postmortem AD patients and normal people, including the postcentral gyrus, superior frontal gyrus and entorhinal cortex [Citation6]. Compared with other AD microarray analyses, theirs contained the data of RNA expression in brain samples from AD patients. Previous studies have shown an increasing incidence of cognitive disorders in patients aged over 70 years [Citation22–24], so we chose the data of these patients in our bioinformatic analysis, aiming to identify AD-related genes in the hippocampus.
After data processing, we found 96 DEGs involved in AD, including 94 downregulated and 2 upregulated (). Then, GO and KEGG analyses were performed for these DEGs (). Three aspects of results (CC, MF, BP) were all related to the synapse, a communicational unit that participates in neuronal interactions. Numerous basic and clinical studies have demonstrated the direct role of synapse in cognitive impairment. At the biological level, the synaptic function is distorted in the settings of neurogenerative diseases, especially the ‘synaptic plasticity’ in AD [Citation25]. Synaptic plasticity is closely associated with the formation of learning and memory [Citation26]. Several autopsy studies have reported that AD patients have a lower level of synapses than healthy people [Citation27–29]. Neurogenesis declines in the hippocampus of AD patients [Citation30]. Synaptic communications involve a series of neuropeptides that act in receptor–ligand interaction to regulate the postsynaptic membrane potential [Citation31]. These neuropeptides also show neuroprotective functions against AD [Citation32]. A message is transmitted through neurotransmitters, such as Acetylcholine (ACh), GABA, NMDA, which is stored in presynaptic vesicles. Any abnormal transmission results in disordered trans-synaptic signaling and membrane potential. The membrane potential in the CNS may contribute to memory formation [Citation33]. Then the protein–protein interaction (PPI) analysis was conducted, A protein cluster including PENK, CNR1, CALB1, TAC1, SST, GNG, CCK, BDNF, GAD1 and was identified and was transferred to the GO and KEGG analyses (). These 10 genes were enriched in CC and MF terms similar to those of the 96. Interestingly, in BP terms, ‘cognition’ ranked the first, indicating that the cluster is most closely related to cognitive function. As a consequence, we intended to identify hub genes related to cognition in the whole PPI. Four genes were enriched in the term of cognition, including CCK, CALB1, TAC1 and CNR1 (). Then we confirmed the reliability of bioinformatic analysis using APP/PS1 mice with a cognitive impairment phenotype (), and the expression of genes in the hippocampus were confirmed via RT-qPCR method (). Taken together, these hub genes play important roles in AD-related cognitive impairment.
CCK encodes the cholecystokinin and works as a pancreatic enzyme in the digestive system as known. However, it is also a kind of neuropeptide that’s abundant in the CNS [Citation34]. In AD, CCK may play a protective role. A higher CCK level predicts a better cognitive performance in a linear regression study [Citation35]. Anti-LINGO-1 reverses AD-induced cognitive decline via enriching CCK-GABA interneuron. On the contrary, CCK-KO mice showed worse cognition than wild-type littermates [Citation36]. CNR1 encodes cannabinoid receptor type 1 (CB1) and is distributed in the brain. Lower CB1 availability is correlated with cognitive decline in Parkinson’s Disease [Citation37]. A CB1 knockout model manifests an altered synaptic ingredient and memory impairment [Citation38], and cannabinoid receptor type1 agonist alleviates the cognitive dysfunction [Citation39]. CALB1, distributed in excitatory neurons and inhibitory interneurons in the hippocampus, encodes the calcium-binding protein Calbindin 1. In a CALB1-KD model, reduced level of hippocampal CALB1 contributed to spatial memory loss [Citation40]. In AD, the level of calbindin is related to the severity of cognitive decline, due to the epigenetic modification at the promotor of CALB1 [Citation41]. Furthermore, calbindin is upregulated in the early stage and downregulated in the late stage, making it an ideal biomarker [Citation42] . Tachykinin precursor 1 (TAC1) encodes a precursor protein to produced substance P, neurokinin A, etc. Among them, substance P has been studied most widely. It acts as a neurotransmitter to regulate the activities of the CNS, and also modulates learning and memory consolidation in the hippocampus. Substance P also decreases in the hippocampus of postmortem AD patients [Citation43–45]. It has been reported that the substance P can be modulated to improve cognitive performance in an Alzheimer’s model [Citation46]. Substance P also induces neuroinflammation. An antagonist of Substance P relives hippocampal inflammation and spatial memory impairment [Citation47]. Besides, we found that both CCK and CNR1 were expressed at CCK-expressing basket cells (CCKBC) located in the hippocampal CA1 region. CCKBC targets postsynaptic pyramidal cells with the different neural circuits in different layers. CCK receptors are expressed in postsynaptic pyramid cells. When CCK binds to the receptors, a cascade molecular pathway is activated, ending up with the synthesis of cannabinoids. Cannabinoids interact the receptor located at the presynaptic CCK’s terminal CB1 receptor [Citation48], a process known as the retrograde signaling pathway. Delta9-THC, an exogenous cannabinoid, can disrupt hippocampal network oscillations by binding to CB1R, resulting in a cognitive decline [Citation49] [Citation50]. The electrophysiological activation of CCKBC enhances multiple cognitive behaviors [Citation51]. On the contrary, an abnormal CCKBC wiring pattern disrupts spatial memory [Citation52]. The reduction of CCKBC causes alternations in spatial learning and memory [Citation53].
CCK, CNR1, CALB1, TAC1 were neuropeptides that play roles in the neurophysiology. Interestingly, all these four genes were packed into a PPI cluster, indicating that they interact with each other closely. It is worth noting that these four genes, expressed at the GABAergic neuron, can regulate the primary neuron circuit. Kenneth et al. have classified GABAergic neurons into 10 major clusters by single-cell transcriptomics, in which these genes were co-expressed in one of these clusters. CCK, CALB1 and CNR1 were mainly expressed in CCK interneurons while TAC1 was in PV interneurons. Both CCK and PV interneurons shared the same fast-spiking pattern [Citation54]. AD animal models showed decreased activity of GABAergic interneurons because Aβ decrease the activity of GABAergic via cholinergic system [Citation55] [Citation56].
Based on these reports and our findings, we argue that the downregulation of CCK, TAC1, CALB1 is associated with cognitive impairment in AD patients.
5. Conclusion
CCK, TAC1 and CALB1 is associated with cognition in the hippocampus of AD patients. These genes may serve as potential therapeutic targets for cognitive dysfunction in AD.
Author contribution
Study concept and design: Yu-Jia Liu, Tian-Tian Liu Acquisition of data: Yu-Jia Liu, Lin-Hao Jiang Analysis and interpretation: Yu-Jia Liu, Tian-Tian Liu, Qian Liu Critical revision of the manuscript for important intellectual content: Zheng-Liang Ma, Tian-Jiao Xia, Xiao-Ping Gu. Study supervision: Tian-Jiao Xia, Xiao-Ping Gu
Disclosure statement
No potential conflict of interest was reported by the author(s).
Additional information
Funding
References
- Eratne D, Loi SM, Farrand S, et al. Alzheimer’s disease: clinical update on epidemiology, pathophysiology and diagnosis. Australas Psychiatry. 2018 Aug;26(4):347–357.
- Lane CA, Hardy J, Schott JM. Alzheimer’s disease. Eur J Neurol. 2018Jan01;25(1):59–70. Blackwell Publishing Ltd.
- Zanetti O, Solerte SB, Cantoni F. Life expectancy in Alzheimer’s disease (AD). Arch Gerontol Geriatr. 2009;49(Suppl 1):237–243.
- Selkoe DJ, Hardy J. The amyloid hypothesis of Alzheimer’s disease at 25 years. EMBO Mol Med. 2016 Jun;8(6):595–608.
- Bliss TVP, Collingridge GL. A synaptic model of memory: long-term potentiation in the hippocampus. Nature. 1993;361(6407):31–39.
- Berchtold NC, Cribbs DH, Coleman PD, et al. Gene expression changes in the course of normal brain aging are sexually dimorphic. Proc Natl Acad Sci U S A. 2008 Oct;105(40):15605–15610.
- Kumon H, Yoshino Y, Funahashi Y, et al. PicalM mRNA expression in the blood of patients with neurodegenerative diseases and geriatric depression. J Alzheimer’s Dis. 2021;79(3):1055–1062.
- Xu H, Jia J. Immune-related hub genes and the competitive endogenous RNA network in Alzheimer’s disease. J Alzheimer’s Dis. 2020;77(3):1255–1265.
- Quan X, Liang H, Chen Y, et al. Related network and differential expression analyses identify nuclear genes and pathways in the hippocampus of Alzheimer disease. Med Sci Monit. 2020;26. DOI:10.12659/MSM.919311.
- Yan T, Ding F, Zhao Y. Integrated identification of key genes and pathways in Alzheimer’s disease via comprehensive bioinformatical analyses. Hereditas. 2019;156(1). DOI:10.1186/s41065-019-0101-0
- Xu M, Liu Y, Huang Y, et al. Re-exploring the core genes and modules in the human frontal cortex during chronological aging: insights from network-based analysis of transcriptomic studies. Aging (Albany NY). 2018;10(10):2816–2831.
- Ling J, Yang S, Huang Y, et al. Identifying key genes, pathways and screening therapeutic agents for manganese-induced Alzheimer disease using bioinformatics analysis. Med (United States). 2018. DOI:10.1097/MD.0000000000010775
- R Core Team. R: a language and environment for statistical computing. In: R Foundation for Statistical Computing. Vienna, Austria. URL http://www.R-project.org/. 2019.
- Gautier L, Cope L, Bolstad BM, et al. Affy - analysis of affymetrix GeneChip data at the probe level. Bioinformatics. 2004;20(3):307–315.
- Irizarry RA, Hobbs B, Collin F, et al. Exploration, normalization, and summaries of high density oligonucleotide array probe level data. Biostatistics. 2003;4(2):249–264.
- Ritchie ME, Phipson B, Wu D, et al. limma powers differential expression analyses for RNA-sequencing and microarray studies. Nucleic Acids Res. 2015 Apr;43(7):e47–e47.
- Yu G, Wang LG, Han Y, et al. ClusterProfiler: an R package for comparing biological themes among gene clusters. Omi A J Integr Biol. 2012 May;16(5):284–287.
- Szklarczyk D, Morris JH, Cook H, et al. The STRING database in 2017: quality-controlled protein-protein association networks, made broadly accessible. Nucleic Acids Res. 2017;45(D1):D362–D368.
- Shannon P, Markiel A, Ozier O, et al. Cytoscape: a software environment for integrated models of biomolecular interaction networks. Genome Res. 2003 Nov;13(11):2498–2504.
- Lin CY, Chin CH, Wu HH, et al. Hubba: hub objects analyzer–a framework of interactome hubs identification for network biology. Nucleic Acids Res. 2008 July, 36(suppl_2):W438–W443.
- Vorhees CV, Williams MT. Morris water maze: procedures for assessing spatial and related forms of learning and memory. Nat Protoc. 2006;1(2):848–858.
- César KG, Brucki S, Takada L T, et al. Prevalence of cognitive impairment without dementia and dementia in Tremembé, Brazil. Alzheimer Dis Assoc Disord. 2016;30(3):264–271.
- Hale JM, Schneider DC, Mehta NK, et al. Cognitive impairment in the U.S.: lifetime risk, age at onset, and years impaired. SSM Popul Heal. 2020;11:100577.
- Qiu C, Fratiglioni L, Perry G. Aging without dementia is achievable: current evidence from epidemiological research. J Alzheimers Dis. 2018;62(3):933–942.
- Pannuzzo M. Beta-amyloid pore linked to controlled calcium influx into the cell: a new paradigm for Alzheimer’s Disease. Alzheimer’s Dement. 2021. DOI:10.1002/alz.12373
- Jeong Y, Cho HY, Kim M, et al. Synaptic plasticity-dependent competition rule influences memory formation. Nat Commun. 2021. DOI:10.1038/s41467-021-24269-4.
- Rajmohan R, Reddy PH. Amyloid-beta and phosphorylated tau accumulations cause abnormalities at synapses of Alzheimer’s disease neurons. J Alzheimers Dis. 2017. DOI:10.3233/JAD-160612
- Scheff SW, Price DA, Schmitt FA, et al. Synaptic alterations in CA1 in mild Alzheimer disease and mild cognitive impairment. Neurology. 2007;68(18):1501–1508.
- Scheff SW, Ansari MA, Mufson EJ. Oxidative stress and hippocampal synaptic protein levels in elderly cognitively intact individuals with Alzheimer’s disease pathology. Neurobiol Aging. 2016;42:1–12.
- Moreno-Jiménez EP, Flor-García M, Terreros-Roncal J, et al. Adult hippocampal neurogenesis is abundant in neurologically healthy subjects and drops sharply in patients with Alzheimer’s disease. Nat Med. 2019Apr01;25(4):554–560. Nature Publishing Group.
- Petrella C, Di Certo MG, Barbato C, et al. Neuropeptides in Alzheimer’s Disease: an Update. Curr Alzheimer Res. 2019 Aug;16(6):544–558.
- Kandimalla R, Reddy PH. Therapeutics of neurotransmitters in Alzheimer’s disease. J Alzheimers Dis. 2017;57(4):1049–1069. IOS Press.
- Pfeiffer P, Egorov AV, Lorenz F, et al. Clusters of cooperative ion channels enable a membrane-potential-based mechanism for short-term memory. Elife. 2020 Feb;9: DOI:10.7554/eLife.49974
- Raiteri M, Paudice P, Vallebuona F. Release of cholecystokinin in the central nervous system. Neurochem Int. 1993 Jun;22(6):519–527.
- Plagman A, Hoscheidt S, McLimans KE, et al. Cholecystokinin and Alzheimer’s disease: a biomarker of metabolic function, neural integrity, and cognitive performance. Neurobiol Aging. 2019Apr;76:201–207.
- Lo CM, Samuelson LC, Chambers JB, et al. Characterization of mice lacking the gene for cholecystokinin. Am J Physiol - Regul Integr Comp Physiol. 2008;294(3):R803–R810.
- Ceccarini J, Casteels C, Ahmad R, et al. Regional changes in the type 1 cannabinoid receptor are associated with cognitive dysfunction in Parkinson’s disease. Eur J Nucl Med Mol Imaging. 2019;46(11):2348–2357.
- Aso E, Andrés-Benito P, Ferrer I. Genetic deletion of CB1 cannabinoid receptors exacerbates the Alzheimer-like symptoms in a transgenic animal model. Biochem Pharmacol. 2018;157:210–216.
- Crunfli F, Vrechi TA, Costa AP, et al. Cannabinoid receptor type 1 agonist ACEA improves cognitive deficit on STZ-induced neurotoxicity through apoptosis pathway and NO modulation. Neurotox Res. 2019;35(3):516–529.
- Li J-T, Xie X-M, Yu J-Y, et al. Suppressed calbindin levels in hippocampal excitatory neurons mediate stress-induced memory loss. Cell Reports. 2017;21(4):891–900.
- You JC, Muralidharan K, Park JW, et al. Epigenetic suppression of hippocampal calbindin-D28k by ΔfosB drives seizure-related cognitive deficits. Nat Med. 2017 Nov;23(11):1377–1383.
- Verdaguer E, Brox S, Petrov D, et al. Vulnerability of calbindin, calretinin and parvalbumin in a transgenic/knock-in APPswe/PS1dE9 mouse model of Alzheimer disease together with disruption of hippocampal neurogenesis. Exp Gerontol. 2015;69:176–188.
- Rösler N, Wichart I, Jellinger KA. Ex vivo lumbar and post mortem ventricular cerebrospinal fluid substance P-immunoreactivity in Alzheimer’s disease patients. Neurosci Lett. 2001;299(1–2):117–120.
- Johansson P, Almqvist EG, Wallin A, et al. Cerebrospinal fluid substance P concentrations are elevated in patients with Alzheimer’s disease. Neurosci Lett. 2015Nov;609:58–62.
- Perry EK, Oakley AE, Candy JM, et al. Properties and possible significance of substance P and insulin fibrils. Neurosci Lett. 1981 Sep;25(3):321–325.
- Campolongo P, Ratano P, Ciotti MT, et al. Systemic administration of substance P recovers beta amyloid-induced cognitive deficits in rat: involvement of Kv potassium channels. Plos One. 2013;8(11):e78036.
- Fernandes J, Mudgal J, Rao CM, et al. N-acetyl-L-tryptophan, a substance-P receptor antagonist attenuates aluminum-induced spatial memory deficit in rats. Toxicol Mech Methods. 2018 Jun;28(5):328–334.
- Armstrong C, Soltesz I. Basket cell dichotomy in microcircuit function. J Physiol. 2012;590(4):683–694.
- Lupica CR, Hu Y, Devinsky O, et al. Cannabinoids as hippocampal network administrators. Neuropharmacology. 2017;124:25–37.
- Lupica CR, Hoffman AF. Cannabinoid disruption of learning mechanisms involved in reward processing. Learn Mem. 2018;25(9):435–445.
- Whissell PD, Bang JY, Khan I, et al. Selective activation of cholecystokinin-expressing GABA (CCK-GABA) neurons enhances memory and cognition. eneuro. 2019;6(1):ENEURO.0360–18.
- Del Pino I, Brotons-Mas JR, Marques-Smith A, et al. Abnormal wiring of CCK+ basket cells disrupts spatial information coding. Nat Neurosci. 2017;20(6):784–792.
- Zhang B, Chen X, Lin Y, et al. Impairment of synaptic plasticity in hippocampus is exacerbated by methylprednisolone in a rat model of traumatic brain injury. Brain Research. 2011;1382:165–172.
- Harris KD, Hochgerner H, Skene NG, et al. Classes and continua of hippocampal CA1 inhibitory neurons revealed by single-cell transcriptomics. Plos Biol. 2018;16(6):e2006387.
- Xu Y, Zhao M, Han Y, et al. GABAergic inhibitory interneuron deficits in alzheimer’s disease: implications for treatment. Front Neurosci. 2020. DOI:10.3389/fnins.2020.00660
- Abbas G, Mahmood W, Kabir N. Recent progress on the role of GABAergic neurotransmission in the pathogenesis of Alzheimer’s disease. Rev Neurosci. 2016;27(4):449–455.