
ABSTRACT
Osteoporosis, as a common metabolic disorder characterized by the decrease of bone mass, can cause fractures, thereby threatening the life quality of females, especially postmenopausal women. Thus, it is necessary to reveal the genes involved in osteoporosis and explore biomarkers for osteoporosis. In this study, two groups, smokers and nonsmokers with different bone mineral density (BMD) levels, were collected from the Gene Expression Omnibus (GEO) database GSE13850. Consensus modules of the two groups were identified; the variety of gene modules between smokers and nonsmokers with different BMD levels was observed; and a consensus module, including 390 genes significantly correlated with different BMD levels, was identified. Function analysis revealed the significantly enriched osteoporosis-related pathways, such as the PI3K-Akt signaling pathway. Hub genes analysis revealed the critical role of CXCL12 and CHRM2 in modules related to BMD levels. Based on the support vector machine recursive feature elimination (SVM-RFE) analysis, the model containing 10 genes (TNS4, IRF2, BSG, GZMM, ARRB2, COX15, RALY, TP53, RPS6KA3, and SYNPO) with good performance in identifying people with different BMD levels was constructed. Among them, the roles of RALY and SYNPO in the osteogenic differentiation of hBMSCs were verified experimentally. Overall, this study provides a strategy to explore the biomarkers for osteoporosis through analysis of consensus modules.
1. Introduction
As people get older, the bone mass decreases, and the risk of fractures increases significantly, especially for women after menopause [Citation1]. Osteoporosis is a common metabolic disorder often characterized by low bone mineral density (BMD). It places thousands of premenopausal and postmenopausal women as victims, causing fractures of their spine, hip, and wrist, with some even worse fractures directly leading to mortality, such as hip fractures [Citation1,Citation2]. The association between smoking and the loss of bone mineral density has been reported. Insufficient bone mineral density, especially at the hip, is considered significantly positively associated with smoking [Citation3,Citation4]. Therefore, it is of great significance to reveal the pathophysiology of osteoporosis, explore its novel diagnostic features and analyze the relations between smoking and BMD related features.
Assessing the bone mineral density with dual-energy X-ray absorptiometry is the most widely used method for the diagnosis of osteoporosis [Citation5]. Diagnostic features such as biomarkers involving the formation of bones in the aspects of serum procollagen type I N-terminal propeptide (s-PINP), urinary N-telopeptide (NTX), and serum C-terminal telopeptide type I collagen (s-CTX), etc. were developed for predicting the risks of fractures and other skeletal pathologies [Citation6]. Markers such as s-PINP and s-CTX still have limitations, for they lack specificity and fail to reflect the osteocyte activity or the bone tissue quality [Citation6,Citation7]. It is a widely acknowledged fact that the process of bone loss can’t be tracked by these molecular markers, especially at the early stage [Citation6,Citation7]. So, the exploration of associated biomarkers is undoubtedly necessary. With the development of sequencing, multiple molecular biomarkers including the circulating miRNAs, have been explored [Citation6,Citation7].
Circulating monocytes, also known as peripheral blood monocytes, play important roles in the response to inflammation [Citation8]. Researchers summarized the benefits and reasons for using peripheral blood monocytes (PBMs) containing precursors of osteoclasts, as study models for bone-related diseases [Citation9–11]. For example, PBMs could be used as possible precursors of osteoclasts and affect the differentiation of osteoclast by producing potent cytokines [Citation12–14]. The significant role of peripheral blood monocyte-expressed genes in osteoporosis has already been reported by multiple publications. Deng’s team found that the expression of ANXA2 was significantly upregulated in patients with low BMD compared with those healthy people with high BMD [Citation15]. The expression of long noncoding RNAs in PBMs was confirmed to be involved in the regulation of osteoporosis [Citation16]. Zhou, et al. revealed five critical independent pathways related to BMD [Citation17]. Recently, the weighted gene co-expression network analysis (WGCNA), as an efficient tool for locating the highly correlated gene clusters (modules), has been widely used to analyze the network of genes or hub genes in multiple diseases. Researchers has constructed a scoring system for the prediction of BMD and then found the significant role of ribonucleoprotein complex biogenesis in osteoporosis [Citation18]. Smoking is reported as a common behavior that can lead to impaired osteogenesis [Citation19]. A recent study revealed six genes (HNRNPC, PFDN2, PSMC5, RPS16, TCEB2, and UBE2V2) associated with smoking-related postmenopausal osteoporosis [Citation20]. At present, studies on the comparative analysis of multiple groups with osteoporosis (such as smokers and nonsmokers) are limited. However, they are essential in exploring behavior-related osteoporosis and revealing critical osteoporosis-related gene clusters (also called consensus modules in WGCNA).
In this study, the analysis of consensus modules was performed among smokers and nonsmokers with different BMD levels to reveal the association between smoking-related modules and osteoporosis-related consensus modules. Two groups of samples (including 20 smokers and 20 nonsmokers) with low or high BMD, were collected for weighted gene co-expression network analysis to identify consensus modules. The gene modules associated with smoking were constructed and then mapped to consensus modules to analyze the smoking-specific modules. Consensus modules were related to clinical conditions (different levels of BMD). Function analysis and protein–protein interactions (PPI) analysis were performed to explore the functional processes and interactions of genes involved in the smoking-specific modules and consensus modules significantly negatively correlated with BMD. Hub genes were revealed based on the interactions of genes. Support vector machine recursive feature elimination (SVM-RFE) was employed to construct the prediction model for people with low BMD and the constructed model was validated with independent data, GSE56815.
2. Materials and methods
2.1. Data collection and preparation
To analyze osteoporosis-related gene modules, gene expression profiles associated with osteoporosis were collected and downloaded from the GEO database (https://www.ncbi.nlm.nih.gov/geo/) by searching for the key words ‘osteoporosis’ and ‘smoking’. To perform WGCNA analysis, experiments with the sample size larger than 15 were collected. Finally, GSE13850, containing 20 postmenopausal female smokers and 20 nonsmoking samples with low or high BMD, was used for analysis (https://www.ncbi.nlm.nih.gov/geo/query/acc.cgi?acc=GSE13850). GSE56815 was adopted as validation data, with 80 female samples – 40 with high BMD (20 premenopausal samples and 20 postmenopausal samples) and 40 with low BMD (20 premenopausal samples and 20 postmenopausal samples) [Citation17]. The expression profiles were annotated with annotation files. The expression matrix in this analysis was performed from the same platform, [HG-U133A] Affymetrix Human Genome U133A Array. The average expression level was calculated and considered as the gene expression for genes with multiple probes.
2.2. Network construction and consensus module detection
Before the network construction, genes and samples were examined with the WGCNA package, and those containing excessive numbers of missing values were removed [Citation21]. Clustering analysis was performed with R software and the outliers were identified and removed based on the expression of genes. Then, clustering trees were depicted. The network topology was analyzed to choose a proper soft-thresholding power used for the network construction. To make the data sets comparable, the topological overlap matrices (TOM) of the two datasets (the expression set of smokers and nonsmokers) were scaled to mitigate the effect between different statistical properties of TOM and the results of scaling was depicted with the Q-Q plot function in the WGCNA package [Citation21]. The consensus TOM was used as input to perform hierarchical clustering analysis to identify modules. To obtain larger modules, the ‘minModuleSize’ of 30 was considered as cutoff and modules with higher similarity and correlation, 0.75, were merged.
2.3. Identifying the smoking-related specific modules
To identify the gene modules specifically related to smoking, the modules were constructed based on the expression profiles of smokers with proper soft power value. The correlations between modules and BMD statuses were analyzed and the smoking-related modules were, then, mapped to consensus modules. The overlaps of smoking-consensus modules were calculated and the P-value of each pairwise overlap was analyzed with the Fisher’s exact test [Citation21,Citation22]. The overlapped counts and the significance of overlaps were depicted with the color-coded table.
2.4. Relating consensus modules to the clinical traits
The correlation analysis between consensus modules and the BMD statuses (low or high BMD) in smokers and nonsmokers was conducted, individually. The correlations and the corresponding significance values (P-value) were displayed with a color-coded table [Citation21]. To explore the similarities and differences of the module-trait relationships between different groups (smokers and nonsmokers), the relationships in these two sets were integrated and depicted within one color-code table: taking the lower absolute value as correlation values with similar signs and signing zero relationships as correlation values with opposite signs [Citation21,Citation22].
2.5. GO and KEGG analysis
Two gene sets were collected for downstream analysis (one with genes involved in the smoking-related specific modules and the other with genes in consensus modules negatively correlated with BMD levels in smokers and nonsmokers). Function analysis was performed with clusterProfiler software to explore the KEGG pathways and function processes involved, respectively. The P-value cutoff and q-value cutoff were set to 0.05 and ‘BH’ method was used to adjust the P-value. The minimal number of genes annotated by Ontology term was set to 10 [Citation23].
2.6. Protein–protein interactions analysis
To analyze the interactions of genes in modules, the genes were collected and predicted with STRING database (https://string-db.org/). ‘Cytohubba’ (https://apps.cytoscape.org/apps/cytohubba), a plugin of Cytoscape software, was employed to analyze the critical genes with default parameters. The top 10 hub genes were precited and depicted with Cytoscape (https://apps.cytoscape.org/).
2.7. Osteoporosis-related signatures analysis
To explore osteoporosis-associated genes, the samples of smokers were randomly and averagely divided into two groups: the train group and the test group. The SVM-RFE method was applied with the ‘e1071ʹ package (https://cran.r-project.org/web/packages/e1071/index.html) to construct a model based on the train group. The model was depicted based on the test group to analyze the potential in separating samples with different BMD levels [Citation24]. The nonsmokers in GSE13850 and the premenopausal and postmenopausal samples in another independent experiment, GSE56815, were used for validation.
2.8. Cell culture
Primary hBMSCs (Cyagen Biosciences Inc., US) were cultured in an incubator with 5% CO2 at 37°C, and DMEM medium (Gibco, US) with 10% fetal bovine serum (Gibco, US) was used. When the cell density reached 70%–80%, the cells were subcultured. hBMSCs were transfected with siRALY or siSYNPO to downregulate the gene expression, and were then divided into four groups: hBMSCs, siRALY, siSYNPO, siRALY + siSYNPO. The cells in hBMSCs group were not treated; the cells in siRALY group were transfected with siRALY; the cells in siSYNPO group were transfected with siSYNPO; and the cells in siRALY + siSYNPO group were transfected with siRALY and siSYNPO.
2.9. Alizarin red S (ARS) staining assay and the osteogenic marker gene expression detected by qRT-PCR
Osteogenic induction fluid (10 mM β-glycerophosphate, 200 μM ascorbic acid and 100 nM dexamethasone) was prepared to treat hBMSCs. ARS staining assay was performed on the 21st day after osteogenesis induction, and Nikon microscope was used to take photos. Meanwhile, the relative expression of osteogenic marker genes OPN, RUNX2 and ALP mRNA was detected by qRT-PCR. OPN, forward 5ʹ-GAAGTTTCGCAGACCTGACAT-3ʹ and reverse 5ʹ – GTATGCACCATTCAACTCCTCG-3ʹ; RUNX2, forward 5ʹ-TGTCATGGCGGGTAACGAT-3ʹ and reverse 5ʹ-AAGACGGTTATGGTCAAGGTGAA-3ʹ; ALP, forward 5ʹ-AGAATCTGGTGCAGGAATGG-3ʹ and reverse 5ʹ-TCGTATTTCATGTCTCCAGGC −3ʹ. GAPDH was an internal reference gene.
2.10. Western blot
After siRALY or siSYNPO was transfected into hBMSCs, hBMSCs were collected and proteins were extracted. The expression of RALY and SYNPO was detected by Western blotting analysis according to the conventional method [Citation25].
3. Results
3.1. Construction of consensus modules
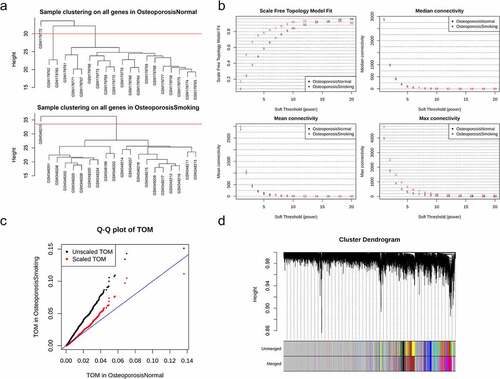
Revealing consensus modules or gene clusters related to BMD provides basis for exploring critical BMD-related genes. Based on clustering analysis, 3 samples of nonsmokers in GSE13850, and 1 sample of smokers in GSE13850 were identified as outliers and were then removed. 36 samples (including 17 nonsmokers and 19 smokers) and 12,402 genes were used for this study (). Topology analysis results were depicted and shown in , indicating that the soft power of 9 attaining the minimal approximate scale-free topology of 0.8 was suitable for network construction because the summary connectivity measures declined significantly around the soft power of 9. Compared with the raw TOM of the two sets, the scaling process made the TOM of the two groups more uniform (). A total of 9 consensus modules were identified (module ‘greenyellow’ with 106 genes, module ‘blue’ with 469 genes, module ‘purple’ with 721 genes, module ‘red’ with 425 genes, module ‘pink’ with 237 genes, module ‘turquoise’ with 484 genes, module ‘brown’ with 917 genes, module ‘black’ with 390 genes and module ‘grey’ with 8653 genes) ().
Figure 1. Data process and consensus modules detection. (a) the clustering trees of the samples of nonsmokers (upside) and smokers (downside) in GSE13850; (b) network topology analysis: network indices (y-axes) and their corresponding soft thresholding power (x-axes); (c) the Q-Q plot of TOM before (black) and after scaling (red); (d) the consensus modules before and after merging
3.2. Smoking-related specific modules
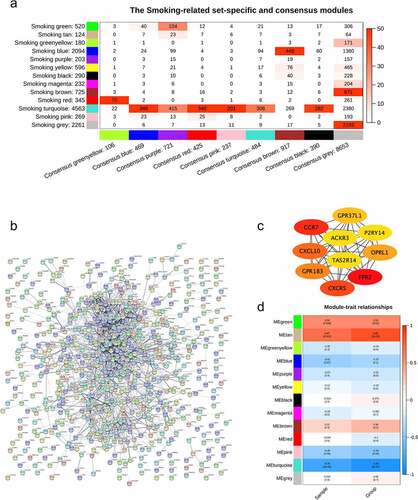
To explore smoking-related specific modules, modules constructed with smokers were mapped to consensus modules. Based on the correlation analysis of the modules of the smoking samples and consensus modules, relations of modules among the smoking samples and nonsmokers were observed. Few modules in the smoking samples were significantly overlapped by consensus modules (). Multiple modules in the smoking samples showed specificity, including module ‘brown’, module ‘magenta’, module ‘yellow’, and module ‘greenyellow’ (). Functional analysis of genes was performed using the smoking-related specific module ‘brown’ with the largest specific genes (671 genes significantly overlapped with genes in the consensus module gray). No significant enriched pathways and GO terms was observed. PPI analysis indicated significant interactions among genes in the module ‘brown’. Hub gene analysis revealed 10 critical genes, CCR7, FPR2, CXCR5, GPR183, CXCL10, OPRL1, GPR37L1, ACKR3, P2RY14, and TAS2R14 (). Through relating modules to the clinical traits of the smoking samples, a significant correlation was shown between the four modules (module ‘green’, module ‘tan’, module ‘pink’, and module ‘turquoise’) and the levels of BMD ().
Figure 2. Smoking-related modules. (a) the correlation between modules detected in the samples of smokers in GSE13850 and consensus modules among the samples of both smokers and nonsmokers; (b) protein-protein interactions of the smoking-related specific genes in module ‘brown’; (c) the top 10 critical genes revealed by hub genes analysis; (d) relationships of modules detected in the smoking samples and the level of bone mineral density
3.3. Relationships between consensus modules and the clinical traits
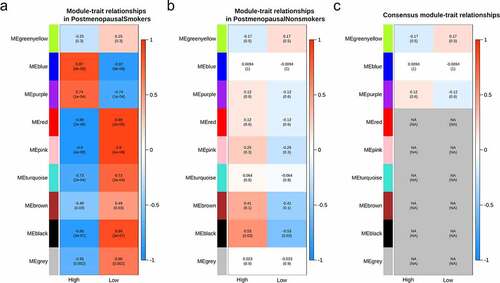
Correlation analysis was performed to analyze the relationships between consensus modules and BMD statuses in smokers and nonsmokers. Based on the correlation analysis, multiple consensus modules, including module ‘blue’, module ‘purple’, module ‘red’, module ‘pink’, module ‘turquoise’, module ‘brown’, and module ‘black’, were significantly correlated with different BMD statuses (). On the contrast, only one consensus module, the module ‘black’, indicated considerable correlation with BMD with a correlation score of 0.53 and a P-value of 0.03 (). Six of nine consensus modules showed opposite correlation with BMD in the two groups of smokers and nonsmokers ().
Figure 3. Correlations between consensus modules and the clinical traits. The relationship between consensus modules and BMD levels in the two groups were analyzed. The correlations between consensus modules and the BMD in smokers (a) and nonsmokers (b) and the consensus relationship between consensus modules and the clinical traits of smokers and nonsmokers (c) were depicted. The correlation scores were depicted with colors (blue for negative correlation, red for positive correlation); the lower absolute scores were used to denote the relationships with similar signs between the two groups, while ‘NA’ refers to those with opposite scores
3.4. Function analysis of genes in module ‘black’ with opposite relationship
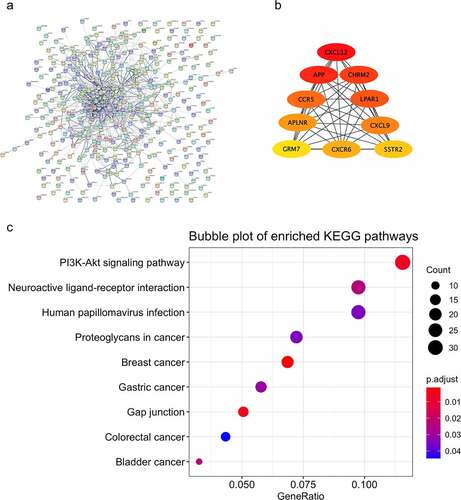
Analyzing the consensus relationships between modules and the BMD of both smokers and nonsmokers indicated that though the module ‘black’ showed a significant correlation with the BMD, they represented opposite relationships in smokers and nonsmokers (). To explore the critical genes involved in the opposite module, protein–protein interactions analysis was performed with genes in module ‘black’, and the top 10 hub genes were revealed, including CXCL12, APP, CHRM2, CCR5, LPAR1, APLNR, CXCL9, GRM7, CXCR6, and SSTR2 (). Genes involved in the module ‘black’ were collected and used for function analysis. Enriched GO terms were not observed significantly. KEGG pathways, such as PI3K-Akt signaling pathway, Neuroactive ligand–receptor interaction, and Human papillomavirus infection pathway were significantly enriched ().
Figure 4. Function analysis and PPI analysis of the module ‘black’. The PPI and function analyses of consensus module ‘black’ were analyzed. (a) the predicted protein-protein interactions of genes in consensus module ‘black’ with STRING database; (b) critical genes revealed with the Cytoscape software; (c) KEGG pathways of genes in consensus module ‘black’
3.5. Critical features associated with osteoporosis
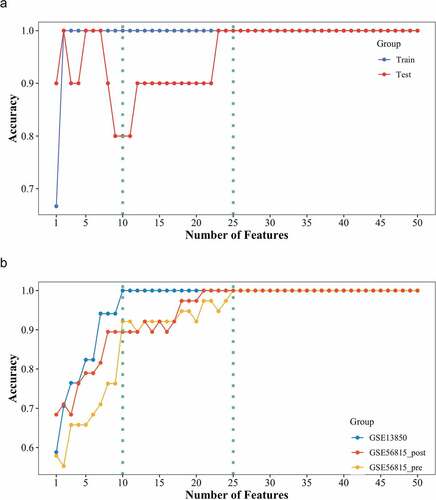
To explore biomarkers associated with osteoporosis, SVM-RFE analysis was performed based on the consensus module ‘black’, which showed a significant correlation between BMD statuses in smokers and nonsmokers (). Based on the SVM-RFE analysis of genes in consensus module ‘black’, including 390 genes, a model of the features related to BMD levels was constructed and the top 50 features were displayed. The SVM-RFE model performed well in distinguishing smokers with low BMD from those with high BMD, both in the train set and the test set (). Moreover, the property of the model was tested with nonsmokers in GSE13850 as well as an independent experiment of osteoporosis, GSE56815, including 40 premenopausal samples and 40 postmenopausal samples (4 samples, 2 samples in each group, were identified as outliers and removed through clustering analysis). Considering the variety of genes between premenopausal and postmenopausal females, the samples were divided into two groups according to the menopausal status, and a test analysis was performed for each group, respectively. The testing analysis presented that the features showed pretty stable and great performance in identifying the females with both low and high BMD. The AUC of the model containing 10 genes (TNS4, IRF2, BSG, GZMM, ARRB2, COX15, RALY, TP53, RPS6KA3, and SYNPO) exceeded 0.9 and the AUC of the model with 25 genes (TNS4, IRF2, BSG, GZMM, ARRB2, COX15, RALY, TP53, RPS6KA3, SYNPO, TRPV2, WNT10B, NUBPL, CHRM5, PPP1R7, SH3TC1, PCOLCE, HCFC1R1, RPL14, MEN1, TAF10, MTA2, SULT1B1, ADAM11, and ZNF185) even reached 1.0 ().
Figure 5. SVM-RFE analysis of genes in consensus module ‘black’. (a) the SVM-RFE model was constructed with smokers in GSE13850 and tested in the train set (blue) and the test set (red). (b) Testing analysis of the constructed SVM-RFE model with female nonsmokers in GSE13850 (blue), premenopausal female (yellow), and postmenopausal female (red) in GSE56815. The y-axis indicates the number of genes, while the x-axis shows the corresponding accuracy
3.6. Validation of osteoporosis-related genes
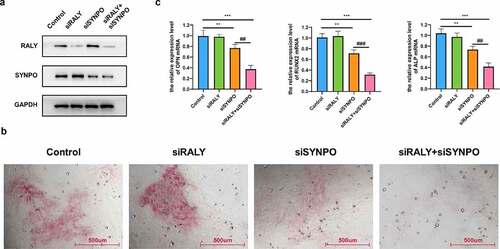
Osteoporosis is mainly caused by the disorder of bone homeostasis, that is, the balance between osteogenesis and bone resorption is broken. Osteogenesis is mainly regulated by osteoblasts, which are generally differentiated from bone-derived mesenchymal stem cells (BMSCs). Considering the limitations of experiments (lacking critical clinical BMD-related features, such as the loss of body weight, physical inactivity, alcohol, etc.) used for bioinformatic analysis, the role of RALY and SYNPO in the osteogenic differentiation of hBMSCs was verified with cell experimental method. Western blot results showed that after transfection with siRALY or siSYNPO, the expression of RALY or SYNPO was significantly down-regulated (). Then osteogenic induction was performed on hBMSCs, and the osteogenic differentiation ability of hBMSCs was detected by ARS staining assay. The results showed that there was no significant change in the osteogenic differentiation ability of siRALY, the osteogenic differentiation ability of siSYNPO was significantly weakened, and the osteogenic differentiation ability of siRALY + siSYNPO was further weakened (). qRT-PCR was used to detect the relative expression level of osteogenic marker gene (OPN, RUNX2 and ALP) mRNA. The relative expression level of osteogenic marker genes in siRALY did not change significantly, the relative expression level in siSYNPO decreased significantly, and the relative expression level in siRALY + siSYNPO further decreased ().
Figure 6. RALY and SYNPO regulate the osteogenic differentiation of hBMSCs. (a) The expression of RALY and SYNPO was detected by Western blot. (b) The osteogenic differentiation ability was detected by ARS staining assay. (c) The relative expression of osteogenic marker genes (OPN, RUNX2, and ALP) mRNA was detected by qRT-PCR. Compared with the control group, **P < 0.01, ***P < 0.001; Compared with the siSYNPO group, ##P < 0.01, ###P < 0.001
4. Discussion
Before scaling analysis, a great difference was shown in the topological overlap matrices (TOM) of the two groups, indicating the significance of the scaling process before analysis (). Various gene patterns of both smokers and nonsmokers were revealed by means of relating the constructed modules with the gene expression of 19 smokers to consensus modules (). Few modules of the smokers were significantly overlapped with consensus modules, except consensus module ‘grey’ (). No significantly enriched pathways were observed with genes in smoking-specific modules (module ‘greenyellow’, ‘yellow’, ‘magenta’, and ‘brown’) (). Smoking-related genes such as CCR7 were revealed through hub genes analysis [Citation26]. Cigarette smoking has been considered as one of the negative factors influencing osteoporosis, though its role was still unclear [Citation19,Citation27]. In our study, there was no significant correlation between smoking-related specific modules and different BMD levels. Considering the limitations in our study, such as the variety of sequencing between the two groups, more works are need to be done to further explore the smoking-specific modules associated with osteoporosis. Nevertheless, our study provides a strategy for exploring behavior-related gene clusters associated with osteoporosis.
Relating consensus modules to the levels of BMD revealed that most consensus modules showed significant correlation with the BMD levels in smokers (). This is not unexpected because most consensus modules, including module ‘blue’, ‘purple’, ‘red’, ‘pink’, ‘turquoise’, and ‘black’, were significantly overlapped by the largest smoking-related module ‘turquoise’ containing 4563 genes with significant association with the BMD levels of smokers (). Most consensus modules showed no significant correlation with different levels of BMD in nonsmokers () Interestingly, consensus module ‘black’, with 390 genes, indicated a statistically significant correlation with different BMD levels (), reflecting its critical role in the regulation of osteoporosis. Function analysis showed a statistically significantly enriched PI3K-Akt signaling pathway (). The PI3K/Akt signaling pathways were widely reported in regulating the process of osteoporosis [Citation28–30]. It was reported by previous publications that the differential gene expressions of circulating monocytes were involved in neuroactive ligand-receptor interaction pathways [Citation31]. According to our analysis, the significantly enriched neuroactive ligand-receptor interaction was observed, showing its potential role in response to the osteoporosis. The top 10 critical genes based on interactions of genes were revealed by hub gene analysis, including CXCL12, APP, CHRM2, CCR5, LPAR1, APLNR, CXCL9, GRM7, CXCR6, and SSTR2 (). CXCL12 signaling was considered as an important component in regulating the development and activity of osteoblasts [Citation32]. The increase of the level of plasma CXCL12 was reportedly associated with the severity of postmenopausal osteoporosis patients [Citation33]. CHRM2 was a critical gene regulating the osteogenic differentiation of adipose stem cells [Citation34]. And, based on our analysis, the critical roles of CXCL12 and CHRM2 were shown in the interaction with genes of the BMD-related module in smokers and nonsmokers.
The SVM-RFE model with 10 genes (TNS4, IRF2, BSG, GZMM, ARRB2, COX15, RALY, TP53, RPS6KA3, and SYNPO) presented good performance in predicting the BMD levels of people, especially for those without smoking behavior and with AUC > 0.9 (). The correlation between seven genes (IRF2, BSG (CD147), GZMM, ARRB2, COX15, TP53, and RPS6KA3) and the process of osteoporosis has already been reported [Citation35–38]. The expression of TNS4 was widely analyzed in cancers. The risky SNPs of RALY and SYNPO associated with osteoporosis were reported as well [Citation39]. The RALY expression was significantly downregulated in non-small cell lung cancer patients with bone metastasis [Citation40]. Considering the limitation of experiments (lacking critical clinical BMD-related features, such as the loss of body weight, physical inactivity, alcohol, etc.) used for bioinformatic analysis, the role of RALY and SYNPO in the osteogenic differentiation of hBMSCs was verified. It was found that the osteogenic differentiation ability did not change significantly when down-regulating RALY expression, the osteogenic differentiation ability was significantly weakened when down-regulating SYNPO expression, and the osteogenic differentiation ability was further weakened when down-regulating RALY and SYNPO expression (). The relative expression level of osteogenic marker genes (OPN, RUNX2, and ALP) mRNA also changed accordingly. These results indicated the potential role of SYNPO in regulating osteoporosis. Additionally, a model containing 25 genes (TNS4, IRF2, BSG (CD147), GZMM, ARRB2, COX15, RALY, TP53, RPS6KA3, SYNPO, TRPV2, WNT10B, NUBPL, CHRM5, PPP1R7, SH3TC1, PCOLCE, HCFC1R1, RPL14, MEN1, TAF10, MTA2, SULT1B1, ADAM11, and ZNF185) showed great performance for predicting BMD levels, which were both validated by nonsmokers of GSE13850 and premenopausal and postmenopausal females. More experiments and sequencing dates are needed to validate the potential of the model in the prediction of BMD levels.
5. Conclusion
One module containing 10 genes (TNS4, IRF2, BSG, GZMM, ARRB2, COX15, RALY, TP53, RPS6KA3, and SYNPO) with good performance in identifying different BMD levels was constructed based on consensus module analysis. Expression of two genes, RALY and SYNPO, in osteogenic differentiation of hBMSCs was validated.
Author contributions
Bingyuan Lin: Conceptualization; Formal analysis; Methodology; Writing the original draft.
Zhijun Pan: Data curation; Methodology; Validation; Editing & Supervision.
Availability of data and material
The datasets used and/or analyzed during the current study are available from the corresponding author on reasonable request.
Disclosure statement
No potential conflict of interest was reported by the author(s).
Additional information
Funding
References
- Cummings SR, Melton LJ. Epidemiology and outcomes of osteoporotic fractures. Lancet. 2002;359:1761–1767.
- Sambrook P, Cooper C. Osteoporosis. Lancet. 2006;367:2010–2018.
- Hollenbach KA, Barrett-Connor E, Edelstein SL, et al. Cigarette smoking and bone mineral density in older men and women. Am J Public Health. 1993;83:1265–1270.
- Ward KD, Klesges RC. A meta-analysis of the effects of cigarette smoking on bone mineral density. Calcif Tissue Int. 2001;68:259–270.
- Cummings SR, Black DM, Nevitt MC, et al. Bone density at various sites for prediction of hip fractures. The study of osteoporotic fractures research group. Lancet. 1993;341:72–75.
- Garnero P. New developments in biological markers of bone metabolism in osteoporosis. Bone. 2014;66:46–55.
- Materozzi M, Merlotti D, Gennari L, et al. The potential role of miRNAs as new biomarkers for osteoporosis. Int J Endocrinol. 2018;2018:2342860.
- Auffray C, Sieweke MH, Geissmann F. Blood monocytes: development, heterogeneity, and relationship with dendritic cells. Annu Rev Immunol. 2009;27:669–692.
- Xiao P, Chen Y, Jiang H, et al. In vivo genome-wide expression study on human circulating B cells suggests a novel ESR1 and MAPK3 network for postmenopausal osteoporosis. J Bone Miner Res. 2008;23:644–654.
- Yun TJ, Tallquist MD, Aicher A, et al. Osteoprotegerin, a crucial regulator of bone metabolism, also regulates B cell development and function. J Immunol. 2001;166:1482–1491.
- Li Y, Toraldo G, Li A, et al. B cells and T cells are critical for the preservation of bone homeostasis and attainment of peak bone mass in vivo. Blood. 2007;109:3839–3848.
- Zhou Y, Deng HW, Shen H. Circulating monocytes: an appropriate model for bone-related study. Osteoporos Int. 2015;26:2561–2572.
- Zambonin Zallone A, Teti A, Primavera MV. Monocytes from circulating blood fuse in vitro with purified osteoclasts in primary culture. J Cell Sci. 1984;66:335–342.
- Pacifici R, Rifas L, Teitelbaum S, et al. Spontaneous release of interleukin 1 from human blood monocytes reflects bone formation in idiopathic osteoporosis. Proc Natl Acad Sci USA. 1987;84:4616–4620.
- Deng FY, Lei SF, Zhang Y, et al. Peripheral blood monocyte-expressed ANXA2 gene is involved in pathogenesis of osteoporosis in humans. Mol Cell Proteomics. 2011;10:M111 011700.
- Zhou Y, Xu C, Zhu W, et al. Long noncoding RNA analyses for osteoporosis risk in caucasian women. Calcif Tissue Int. 2019;105:183–192.
- Zhou Y, Gao Y, Xu C, et al. A novel approach for correction of crosstalk effects in pathway analysis and its application in osteoporosis research. Sci Rep. 2018;8:668.
- Xiao KW, Li JL, Zeng ZH, et al. Monocytes affect bone mineral density in pre- and postmenopausal women through ribonucleoprotein complex biogenesis by integrative bioinformatics analysis. Sci Rep. 2019;9:17290.
- Aspera-Werz RH, Ehnert S, Heid D, et al. Nicotine and cotinine inhibit catalase and glutathione reductase activity contributing to the impaired osteogenesis of SCP-1 cells exposed to cigarette smoke. Oxid Med Cell Longev. 2018;2018:3172480.
- Li S, Chen B, Chen H, et al. Analysis of potential genetic biomarkers and molecular mechanism of smoking-related postmenopausal osteoporosis using weighted gene co-expression network analysis and machine learning. Plos One. 2021;16:e0257343.
- Langfelder P, Horvath S. WGCNA: an R package for weighted correlation network analysis. BMC Bioinformatics. 2008;9:559.
- Trjpnasu JD. Statistical significance for genome-wide experiments. P Natl Acad Sci USA. 2003;100:94409445.
- Yu G, Wang LG, Han Y, et al. clusterProfiler: an R package for comparing biological themes among gene clusters. OMICS. 2012;16:284–287.
- Guyon I, Weston J, Barnhill S, et al. Gene selection for cancer classification using support vector machines. Machine Learning. 2002;46:389–422.
- Wang Q, Chen B, Cao M, et al. Response of MAPK pathway to iron oxide nanoparticles in vitro treatment promotes osteogenic differentiation of hBMSCs. Biomaterials. 2016;86:11–20.
- Demoor T, Bracke KR, Vermaelen KY, et al. CCR7 modulates pulmonary and lymph node inflammatory responses in cigarette smoke-exposed mice. J Immunol. 2009;183:8186–8194.
- Lane NE. Epidemiology, etiology, and diagnosis of osteoporosis. Am J Obstet Gynecol. 2006;194:S3–11.
- Xi JC, Zang HY, Guo LX, et al. The PI3K/AKT cell signaling pathway is involved in regulation of osteoporosis. J Recept Signal Transduct Res. 2015;35:640–645.
- Ke K, Li Q, Yang X, et al. Asperosaponin VI promotes bone marrow stromal cell osteogenic differentiation through the PI3K/AKT signaling pathway in an osteoporosis model. Sci Rep. 2016;6:35233.
- Wang H, Zhao W, Tian QJ, et al. Effect of lncRNA AK023948 on rats with postmenopausal osteoporosis via PI3K/AKT signaling pathway. Eur Rev Med Pharmacol Sci. 2020;24:2181–2188.
- Xiao Y, Zhao XP. Screening pathways and hub genes involved in osteoclastogenesis by gene expression analysis of circulating monocytes based on Gibbs sampling. Exp Ther Med. 2019;17:2529–2534.
- Gilbert W, Bragg R, Elmansi AM, et al. Stromal cell-derived factor-1 (CXCL12) and its role in bone and muscle biology. Cytokine. 2019;123:154783.
- Yang XW, Huang HX, Wang F, et al. Elevated plasma CXCL12/SDF-1 levels are linked with disease severity of postmenopausal osteoporosis. Innate Immun. 2020;26:222–230.
- Cheng J, Zhao X, Liu J, et al. Bioinformatic analysis of transcriptomic data reveals novel key genes regulating osteogenic differentiation of human adipose stem cells. Stem Cells Int. 2019;2019:1705629.
- van de Peppel J, Strini T, Tilburg J, et al. Identification of three early phases of cell-fate determination during osteogenic and adipogenic differentiation by transcription factor dynamics. Stem Cell Reports. 2017;8:947–960.
- Tongquan L, Yugang L, Xu H, et al. Effect of CD147 on differentiation and maturation of osteoclasts in vitro. Acta Academiae Medicinae Militaris Tertiae. 2010;24:013.
- Yan B, Li J, Zhang L. Identification of B cells participated in the mechanism of postmenopausal women osteoporosis using microarray analysis. Int J Clin Exp Med. 2015;8:1027–1034.
- Zhou T, Chen C, Xu C, et al. Mutant MAPK7-induced idiopathic scoliosis is linked to impaired osteogenesis. Cell Physiol Biochem. 2018;48:880–890.
- Yang J, Gu H, Jiang X, et al. Identifying the risky SNP of osteoporosis with ID3-PEP decision tree algorithm. Complexity. 2017;9194801:1-8.
- Li N, Cao X, Li W, et al. Identification of differential genes by microarray and COL6A1 induced the bone metastasis of non-small cell lung cancer. Oncol Lett. 2021;22:693.