
ABSTRACT
4IgB7-H3 (4Ig) and 2IgB7-H3 (2Ig) expression characteristics in acute myeloid leukemia (AML) remain unknown. This study investigated mRNA and membrane protein expression of two B7-H3 isoforms in AML cell lines and de novo patients by using RT-PCR and flow cytometry, and analyzed the B7-H3 promoter methylation state by utilizing RQ-MSP. 4Ig was the dominant isoform. 2Ig mRNA expression rate and abundance were elevated in AML in comparison with controls (P = 0.000 and 0.000), while no significant difference in 4Ig (P = 0.802, P = 0.398). Membrane protein levels of B7-H3 isoforms in AML was higher than controls, detected by total B7-H3 expression rate (P = 0.002), total B7-H3 mean fluorescence intensity (MFI) ratio of blast cells and lymphocytes (MFI ratio) (P = 0.000), and 4Ig B7-H3 MFI ratio (P = 0.005). Compared with 2Iglow group, 2Ighigh patients had older age, lower NPM1 mutation, higher FLT3-ITD mutation, and declining complete remission (CR) rates (P = 0.026, 0.012, 0.047, and 0.028). In B7-H3high group, there was a trend toward older age, M4 and M5, worse karyotype, and lower CR rates, although with no marked difference (P > 0.05). The overall survival (OS) of 2Ighigh and B7-H3high groups were shorter than that of 2Iglow and B7-H3low groups in the whole and non-M3 AML cohorts (P = 0.006 and 0.046; P = 0.003 and 0.032). Besides, an unmethylated B7-H3 promoter was identified. In conclusion, 2Ig mRNA and total B7-H3 membrane protein tended to have potential diagnostic value for AML. Specifically, high 2Ig mRNA and total B7-H3 membrane protein expression indicate worse OS. 4Ig and 2Ig expression are methylation-independent.
Introduction
Acute myeloid leukemia (AML) is a heterogeneous hematologic malignancy characterized by abnormal growth and differentiation of hematopoietic stem cells. In AML, immature myeloid precursors accumulate in bone marrow (BM), peripheral blood, and/or other tissues at the expense of normal terminally differentiated counterparts [Citation1]. With constant advances in the study on AML genetic and epigenetic characterization, a variety of new targeted drugs have emerged and been established to tackle the pathophysiology within individual AML subsets [Citation2]. Although the new therapies had improved the AML patients outcomes, these treatment options pose some new challenges for physicians to treat unfit populations, and the refractory/relapsed patients [Citation3]. The personalized treatment of AML is a promising strategy focusing on the targets in survival and propagation pathways of AML cells and combination therapies [Citation4]. Hence, it is important to identify new valuable biomarkers, which can contribute to recognize the poor prognosis of AML patients and to distinguish the biological drivers before the individual treatment of AML.
B7-H3 (CD276), a part of the B7 immunoregulatory family, involves two isoforms 4IgB7-H3 (4Ig) and 2IgB7-H3 (2Ig) in humans. The two isoforms have similar structures, with extracellular immunoglobulin domain IgV-IgC for 2Ig and IgV-IgC-IgV-IgC for 4Ig, and 4Ig is the main isoform expressed in malignant cells [Citation5,Citation6]. B7-H3 exon duplication generates a conserved region in the first IgC domain of 4Ig, which could disable 4Ig from releasing soluble form, whilst 2Ig produced both membrane and soluble forms [Citation7]. B7-H3 mRNA is ubiquitously expressed in non-lymphoid and lymphoid organs but with limited protein expression, suggesting the presence of post-transcriptional control mechanisms [Citation8,Citation9]. B7-H3 had both co-stimulatory and co-inhibitory immunoregulatory functions. It was reported that 2Ig could increase the proliferation of T cells and the production of IL-2, IFN-γ, while 4Ig could decrease cytokine production and T cell proliferation [Citation7]. In many solid tumors and AML patients, aberrant B7-H3 protein overexpression has been indicated and linked to poor prognosis [Citation10,Citation11], suggesting that B7-H3 may have the capability in becoming a therapeutic target. There was a relationship concerning alternative splicing events and DNA methylation across ten human solid tumor types through genome-wide analysis [Citation12]. A CpG Island located in B7-H3 promoter region was revealed using the UCSC database. However, B7-H3 isoforms expression characteristics and clinical significance and B7-H3 methylation levels in AML have not yet been elucidated.
This study hypothesized that the two B7-H3 isoforms had different expression state, prognostic significance, and methylation levels in AML. First, the mRNA and membrane protein expression of 4Ig and 2Ig in AML cell lines and de novo patients was investigated. Then the prognostic correlation analysis was carried out. Additionally, this study analyzed the association between the methylation state of B7-H3 promoter and the two isoforms mRNA expression. This research aimed at valuing the diagnosis and prognostic risk estimation for B7-H3 isoforms in AML, and providing the foundation for further study on function and regulatory mechanism.
Materials and methods
Cell lines and cell culture
Human acute promyelocytic leukemia cell lines (NB4, HL-60), human acute monocytic leukemia cell lines (THP-1, U937, and SHI-1), human acute erythroleukemia cell line (HEL) and human chronic myeloid leukemia transformed to erythroleukemia cell line (K562) were donated by the First Affiliated Hospital of Soochow University. Human myelodysplastic syndrome transformed to acute monocytic leukemia cell line (SKM-1) was donated by the First Affiliated Hospital of Zhejiang University. The cell lines were cultured in RPMI-1640 (Thermo Fisher Scientific, Shanghai, China) medium comprising 10% heat-inactivated fetal bovine serum (Sciencell, Carlsbad, US), 100 U/mL penicillin and 100 μg/mL streptomycin (Harbin Pharmaceutical Group, Heilongjiang, China), at 37° in a 5% CO2 incubator. AML cell lines in the logarithmic growth phase were collected for the subsequent assays.
Patients characteristics
This research was approved by the Institutional Ethics Committee of both the Affiliated Jiangning Hospital with Nanjing Medical University and the Affiliated People’s Hospital of Jiangsu University. With written informed consent provided by each subjects, the BM samples were collected from 68 de novo AML patients and 32 healthy donors, who were enrolled in the Department of Hematology in the Affiliated Jiangning Hospital with Nanjing Medical University and the Affiliated People’s Hospital of Jiangsu University, respectively. Healthy donors enrolled in this study were qualified on physical examinations and BM inspections, and had no medical history such as blood, heart, liver, kidney, digestive, neuropsychiatric system diseases and metabolic abnormalities; there were 17 males and 15 females, with a median age of 39.5 (19–58 years) years. AML patients were diagnosed in accordance with the 2008 World Health Organization diagnostic criteria for AML [Citation13]. The following subjects were excluded: patients with other hematopoietic diseases except AML, and AML patients accompanied with other solid tumors. The AML patients were treated with combined chemotherapy containing induction therapy and consolidation and maintenance therapy subsequently. Induction therapy for non-M3 AML (non-acute promyelocytic leukemia) patients consisted of singular or doubled courses of daunorubicin or idarubicin in combination with cytarabine. Consolidation therapy consisted of intermediate-dose or high-dose cytarabine, mitoxantrone combined with cytarabine and homoharringtonine in combination with cytarabine. For AML-M3 patients, the induction therapy consists of all-trans retinoic acid (ATRA) or in combination with arsenic acid, and chemotherapy, such as daunorubicin and cytarabine. Maintenance therapy consisted of ATRA, mercaptopurine, and methotrexate for two or more years [Citation14]. The drug selection and dose of the above combined chemotherapy are based on NCCN Clinical Practice Guidelines in Oncology: Acute Myeloid Leukemia [Citation15,Citation16]. The clinical appearances and laboratory characteristics of AML patients were collected and analyzed.
RT-PCR assay
Bone marrow mononuclear cells (BMMNCs) was gained from BM samples of de novo AML patients and healthy donors using Lymphocyte Separation Medium (TBD Sciences, Tianjin, China) in the density gradient centrifugation method. Total RNA of AML cell lines and BMMNCs was extracted utilizing the Trizol reagent (Invitrogen, Carlsbad, CA, US). Then, the total RNA was reverse transcribed into cDNA according to the manufacturer’s instructions. illustrates B7-H3 isoforms primer sequences. The reaction system was comprised of 1 μM primers, 12.5 μM 2× Vazyme LAmp Master Mix (Vazyme, Nanking, China) and 20 ng cDNA. The PCR conditions are listed as so: 5 min in 94°C; 35 or 28 cycles (primer1-4: 35 cycles, β-actin: 28 cycles) for 30 sec at 94°C, 30 sec in 56–69°C (primer1 56°C, primer2 and primer4 69°C, primer3 66°C, β-actin 59°C), 30 sec at 72°C (primer1, primer2, and β-actin) or for 90 sec (primer3 and primer4); and finally 72°C for 10 min. Each assay was carried out with the positive and negative controls and was in triplicate. The mRNA expression rate was calculated by the ratio of the number of cases expressing 4Ig or 2Ig in total numbers of tested cases. And the expression abundance, relative expression level toward reference gene β-actin, was calculated by the ratio of gray values of 4Ig or 2Ig to that of β-actin [Citation17].
Table 1. Primer sequences for B7-H3 isoforms
Flow cytometry (FCM) assay
The AML cell lines and clinical BM samples were resuspended in precooled phosphate-buffered saline (PBS) to obtain single-cell suspensions with the density of 1 × 10⁶ cells/mL. Subsequently, antibodies were used to stain the suspensions for 30 min on ice. After triplicate washes in PBS, a flow cytometry system (Beckmen Counter, Miami, FL, US) through the Kaluza software (Beckmen Counter, Miami, FL, US) was used to analyze the cells collecting at least 10,000 events. B7-H3-specific monoclonal antibodies PE-mouse anti-human CD276 (B7-H3) (clone 2E6) and PE-mouse anti-human CD276 (B7-H3) (clone 3H4), together with PE-IgG1 murine isotype control were purchased from Suzhou Bright Scistar Biotechnology Company. The antibody 2E6 could recognize both 4Ig and 2Ig, while the antibody 3H4 specifically bonded 4Ig. Other monoclonal antibodies used for distinguishing the AML immunophenotype were as follows: CD45, CD13, CD33, CD34, CD117, HLA-DR, CD15, CD14, CD64, CD56, CD41, CD61, CD3, CD4, CD8, CD5, CD10, CD19, CD20, CD22, et al. (Beckmen Counter, Miami, FL, US). The membrane protein expression rate and mean fluorescence intensity (MFI) was assessed, and the MFI ratio of blast cells and lymphocytes was calculated [Citation18].
Real-time quantitative methylation-specific PCR (RQ-MSP) assay
The genomic DNA from AML cell lines and BMMNCs of clinical samples was separated with the use of a genomic DNA purification kit (Gentra, Minneapolis, MN, US), and chemically adjusted with CpGenome™ DNA Modification Kit (Chemicon, Ternecula, Canada). Methylated B7-H3 promoter (M-B7-H3) primer sequences were as follows: 5ʹ- GAGTTTTAGAGTCGGCGC-3ʹ (forward) and 5ʹ-AAACGAAAACGTACGAACCT-3ʹ (reverse) with 120bp PCR products, while for the unmethylated B7-H3 promoter (U-B7-H3) were 5ʹ-TTTGAGTTTTAGAGTTGGTGT-3ʹ (forward) and 5ʹ-CCTAAACAAAAACATACAAACCT-3ʹ (reverse) with 120bp PCR products. SYBR Premix Ex Taq II (TaKaRa, Tokyo, Japan) was employed to RQ-MSP reaction, and the whole system was operated on a 7500 Thermo Cycler (Applied Biosystems, CA, US). RQ-MSP conditions were as follows: 30 sec at 95°C; 40 cycles for 5 sec at 95°C, 60°C for 30 sec, 30 sec at 72°C; and finally 75°C for 30 sec. Each assay contained positive and negative controls. The normalized ratio (NU-B7-H3) was implicated in unmethylation levels of B7-H3 promoter assessment. NU-B7-H3 was calculated with the following formula: NU-B7-H3 = (EU-B7-H3) ΔCT U-B7-H3 (control-sample) /(EALU) ΔCT ALU (control-sample).
Statistical analysis
Mann-Whitney’s U test was performed to compare continuous variables between two groups, while the χ2 test to compare categorical variables between two groups. The receiver operating characteristic curve (ROC) and area under the curve (AUC) was used to separate AML patients into high and low B7-H3 isoforms expression groups. Kaplan–Meier and Cox regression analyses were used to evaluate B7-H3 isoforms expression’s effect on overall survival (OS). P < 0.05 was regarded as statistically significant. The SPSS 20.0 software (SPSS, Chicago, IL) was adopted for the statistical analysis.
Results
Aberrant B7-H3 expression has been reported to indicate and be linked to poor prognosis in AML and many other tumors. However, the expression characteristics and clinical significance of B7-H3 isoforms and B7-H3 methylation levels were unclear. We found that the high 2Ig mRNA and high total B7-H3 membrane protein expression indicated shorter OS compared with the relative low expression groups, respectively. It suggested that the 2Ig mRNA and total B7-H3 membrane protein expression might have potential diagnostic value for AML, although they was not identified to be independent prognostic biomarkers in multivariate analysis. 4Ig and 2Ig expression are methylation-independent.
The mRNA expression of B7-H3 isoforms in AML cell lines
We performed RT-PCR to detect the mRNA level of 4Ig and 2Ig in 8 AML cell lines (). The results indicated that B7-H3 was expressed in the whole-cell lines, showing the lowest expression in NB4. Except for SKM-1, 4Ig was the dominant B7-H3 isoform expressed in other 7 AML cell lines, especially in THP-1 and SHI-1. 2Ig was weakly expressed in HL-60 and K562, but not expressed in NB4. Exclusively in SKM-1, the expression abundance of 2Ig was remarkably higher than that of 4Ig (P = 0.037 and 0.010, detected by B7-H3-specific primer 3 and primer 4, respectively).
Figure 1. The mRNA expression of B7-H3 isoforms in 8 AML cell lines. (a-e) RT-PCR was used to analyze mRNA expression with various B7-H3-specific primers. The ordinate in B-E represents gray values of B7-H3, 4Ig B7-H3, B7-H3 isoforms (detected by B7-H3-specific primer 3), and B7-H3 isoforms (detected by B7-H3-specific primer 4)/gray value of β-actin, respectively. The data is gained from no less than 3 individual experiments
To determine if minor bands of B7-H3 isoforms were due to PCR artifacts, we performed RT-PCR with two sets of B7-H3-specific primers by increasing annealing temperature and reducing cycles in THP-1 and SKM-1 cells, which expressed the strongest 4Ig and 2Ig, respectively. The results showed that both the large and the small bands were detected persistently, whenever the PCR conditions changed in THP-1 and SKM-1 (). Moreover, the two amplified PCR products of THP-1 and SKM-1 obtained using B7-H3-specific primer 3 were sent for DNA sequencing. The nucleic acid sequences of the large and minor band in two cell lines were consistent with that of 4Ig and 2Ig isoforms in the NCBI database (data not shown).
Figure 2. RT-PCR analysis of THP-1 and SKM-1 with B7-H3-specific primers by changing PCR conditions. (a) RT-PCR using B7-H3-specific primers in THP-1 and SKM-1 by increasing annealing temperature. The annealing temperature of primer 3 (up) and primer 4 (down) was 58.1°C, 61.3°C, 63.1°C, 66.4°C, 69°C and 59.9°C, 61.4°C, 62.5°C, 64.8°C, 68.9°C from left to right lanes, respectively. (b) RT-PCR using B7-H3-specific primers in THP-1 and SKM-1 by reducing cycles. The cycles were 35, 33, and 30 cycles from left to right lanes. The data is gained from no less than 3 individual experiments
The mRNA expression of B7-H3 isoforms in de novo AML patients and controls
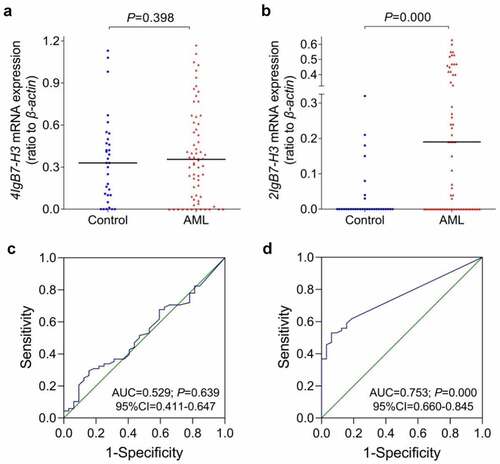
The mRNA expression of B7-H3 isoforms in 68 de novo AML patients and 32 healthy donors were analyzed using RT-PCR. The total B7-H3 mRNA was widely expressed in the whole clinical samples (data not shown). Performing with B7-H3-specific primer 3, the mRNA expression rates of 4Ig and 2Ig were 82.4% (56/68) and 63.2% (43/68) in the AML group, while the expression rates were 84.4% (27/32) and 21.9% (7/32) in the control group, respectively. The expression abundance was calculated by the ratio of gray values of 4Ig or 2Ig to that of β-actin (). The results showed that neither the expression rate nor the expression abundance of 4Ig had considerable discrepancies concerning the two groups (P = 0.802, P = 0.398). However, 2Ig expression rate and abundance both increased in AML patients when in comparison with the controls (P = 0.000 and 0.000). The ROC was applied to differentiate AML patients from controls with mRNA expression of B7-H3 isoforms (). It showed that 4Ig could not distinguish all AML patients from controls (P = 0.639), while the 2Ig mRNA expression could achieve it (P = 0.000). Similar phenomenon was also observed in the non-M3 AML patients compared with controls (data not shown). The cut off value of the 2Ig expression level was 0.185, according to the maximum sum with sensitivity plus specificity in ROC analysis.
Figure 3. The mRNA expression of B7-H3 isoforms in de novo AML patients and controls. RT-PCR with B7-H3-specific primer3 was used to detect mRNA expression of B7-H3 isoforms in AML patients and controls followed by analysis by ROC curve. (a-b) The ordinate represents gray values of 4Ig B7-H3 and 2Ig B7-H3/gray value of β-actin, respectively. (c-d) The ROC curve analysis of 4Ig B7-H3 and 2Ig B7-H3 mRNA expression. AUC, area under the ROC curve
Subsequently, the whole AML cohort was separated into low (2Iglow) and high 2Ig mRNA expression group (2Ighigh), respectively (). Compared with the 2Iglow group, 2Ighigh AML patients had the older age (P = 0.026), lower NPM1 mutation (P = 0.012), higher FLT3-ITD mutation (P = 0.047), the declining complete remission (CR) rates after standard induction therapy for 2 cycles (P = 0.028), and a worse trend of karyotype classification (P = 0.056). No noteworthy variations in clinical manifestations and laboratory features were observed between the 2Iglow and 2Ighigh groups, including sex, WBC, Hb, Plt, BM blasts, karyotype, and other common gene mutations (P > 0.05).
Table 2. Comparison of clinical manifestations and laboratory features between AML patients with low and high mRNA expression of 2Ig B7-H3 (2Ig)
The membrane protein expression of B7-H3 isoforms in AML cell lines
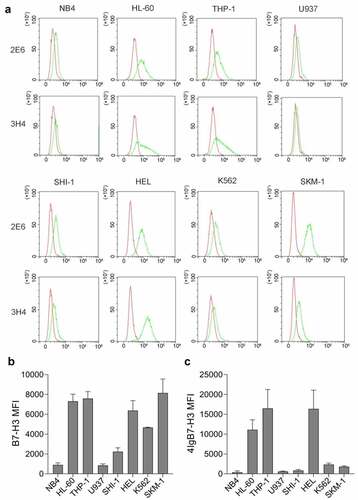
We selected two B7-H3-specific monoclonal antibodies and examined membrane protein expression of B7-H3 isoforms in 8 AML cell lines by flow cytometry. 2E6 antibody could recognize both two types of B7-H3 isoforms, while the antibody 3H4 specifically recognized 4Ig, but not 2Ig. As shown in , the majority of AML cell lines expressed total B7-H3 isoforms detected by antibody 2E6, with the lowest expression abundance in NB4. The 4Ig membrane protein detected by antibody 3H4 was also expressed in most AML cell lines, with no or low expression in NB4, U937, and SHI-1. Interestingly, the expression level of 4Ig in K562 and SKM-1 was substantially lower, while total B7-H3 isoforms expression was relatively higher. It was presumed that 2Ig might be the main B7-H3 isoform type for membrane protein expression in K562 and SKM-1.
Figure 4. B7-H3 isoforms in AML cell line membrane protein expression. (a) The histograms revealed the expression of B7-H3 isoforms, gating with isotype controls. The red and green lines in each histogram represent isotype control and B7-H3 isoforms, respectively. The antibody 2E6 bound both 4Ig B7-H3 and 2Ig B7-H3, while the antibody 3H4 specifically bound 4Ig B7-H3. (b-c) The mean fluorescence intensity (MFI) of total B7-H3 isoforms and 4Ig B7-H3 in AML cell lines. The data is gained from no less than 3 individual experiments
The membrane protein expression of B7-H3 isoforms in de novo AML patients and controls
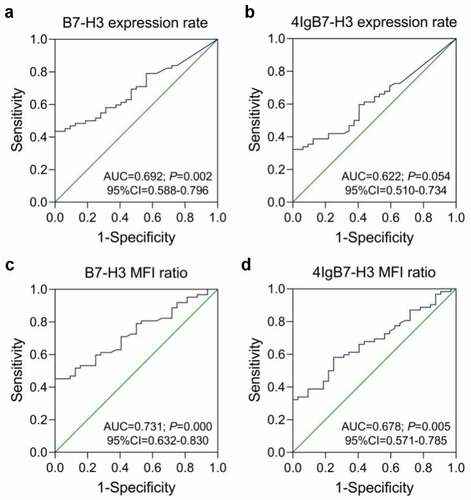
The two B7-H3-specific monoclonal antibodies, 2E6 and 3H4, were also utilized for flow cytometry-based detection of membrane protein expression of B7-H3 isoforms in 62 AML patients and 32 controls. There were six patients in the whole enrolled AML cohort had inadequate BM samples to detect membrane protein level of the two B7-H3 isoforms. Compared with the controls, a significant increase was identified in the total B7-H3 isoforms membrane protein expression rates on blast cells and MFI ratio of blast cells and lymphocytes in AML patients (P = 0.002 and 0.000). 4Ig MFI ratio in the AML group was also higher when compared with the controls (P = 0.005), while 4Ig expression rates had no noteworthy difference (P = 0.051) (). Analyzing by ROC curves, the whole AML patients could be distinguished from controls through the total B7-H3 expression rates (P = 0.002), total B7-H3 MFI ratios (P = 0.000), and 4Ig MFI ratios (P = 0.005) (). Similar phenomenon was also observed in the non-M3 AML patients compared with controls (data not shown).
Figure 5. The membrane protein expression of B7-H3 isoforms in de novo AML patients and controls. (a-b) The expression rates of total B7-H3 isoforms and 4Ig on blast cells in AML patients and controls. (c-d) The mean fluorescence intensity ratio of blast cells and lymphocytes (MFI ratio) of total B7-H3 isoforms and 4Ig B7-H3 in AML patients and controls
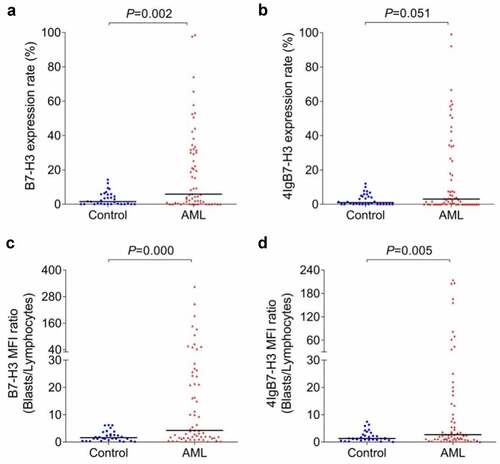
Figure 6. The ROC curve analysis of B7-H3 isoforms membrane protein expression in de novo AML patients and controls. (a-b) The expression rates of total B7-H3 isoforms and 4Ig on blast cells. (c-d) The mean fluorescence intensity ratio of blast cells and lymphocytes (MFI ratio) of total B7-H3 isoforms and 4Ig B7-H3. AUC, area under the ROC curve
Furthermore, we selected the total B7-H3 MFI ratios, which have the strongest discrimination, to analyze the B7-H3 membrane protein expression level along with clinical manifestations and laboratory features in AML patients. The cutoff value was 6.265, determined by ROC analysis with the maximum of the Youden index. Then, the AML patients were separated into low (B7-H3low) and high membrane protein expression groups (B7-H3high) (). Although no noteworthy variances were found between the B7-H3low and B7-H3high groups in common clinical and laboratory features (P > 0.05), several indicators tended to occur in the B7-H3high group, including older age, FAB classification of M4 and M5, worse karyotype classification, and lower CR rates.
Table 3. Evaluation of clinical manifestations and laboratory features amongst AML patients with low and high membrane protein expression of total B7-H3 isoforms
Correlation amid B7-H3 isoforms expression and clinical outcome in de novo AML patients
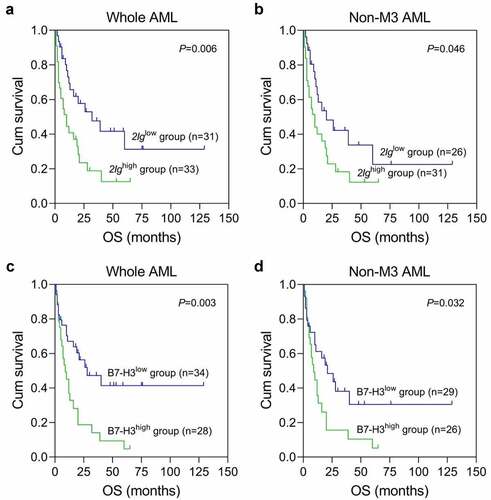
To explore prognostic significances of 2Ig mRNA and total B7-H3 membrane protein expression in AML patients, the survival figures were obtained from 64 de novo AML patients with a median follow-up time of 11.5 (1–129 months) months. Data from Kaplan–Meier analysis showed that OS in the 2Ighigh group (estimated median OS: 10 and 10 months) was significantly shorter than that in the 2Iglow group (estimated median OS:32 and 20 months) in the whole and non-M3 AML patients (P = 0.006 and 0.046). Similarly, the B7-H3high group (estimated median OS: 9 and 9 months) had worse OS compared with B7-H3low group (estimated median OS: 28 and 21 months) in the whole and non-M3 AML cohorts, respectively (P = 0.003 and 0.032) ().
Figure 7. The Kaplan–Meier analysis of B7-H3 isoforms expression in de novo AML patients. (a-b) The influence of 2Ig B7-H3 mRNA expression on OS in the whole AML and non-M3 AML patients, respectively. (c-d) The influence of total B7-H3 isoforms membrane protein expression on OS in the whole AML and non-M3 AML patients, respectively. Non-M3 AML, non-acute promyelocytic leukemia in AML; OS, overall survival
The univariate analysis for OS in AML patients suggested that there were several potential poor prognostic factors in both whole AML patients and non-M3 AML patients, including age ≥ 60 years, WBC ≥ 30 × 109/L, poor karyotypic classification, NPM1 wild-type, TP53 mutation, and without achieving CR after standard induction therapy for 2 cycles. High 2Ig mRNA expression served as poor prognostic factor in the whole AML patients, while the high total B7-H3 membrane protein as a poor biomarker in the non-M3 AML patients (). On account of 2Ig mRNA expression and total B7-H3 membrane protein were significant in one cohort for univariate analysis, they were included in multivariate analysis. The TP53 mutation and no CR was an independent poor prognostic factor for OS both in the whole and non-M3 AML cohorts (P = 0.005 and 0.011 for TP53 mutation, P = 0.000 and 0.001 for CR, respectively). Both high 2Ig mRNA and B7-H3 membrane protein expression reminded the trend to have a higher hazard ratio and shorter OS, although having no statistical difference (P > 0.05).
Table 4. Univariate and multivariate analysis of prognostic factors for overall survival in de novo AML patients
B7-H3 methylation in AML cell lines, de novo AML patients and controls
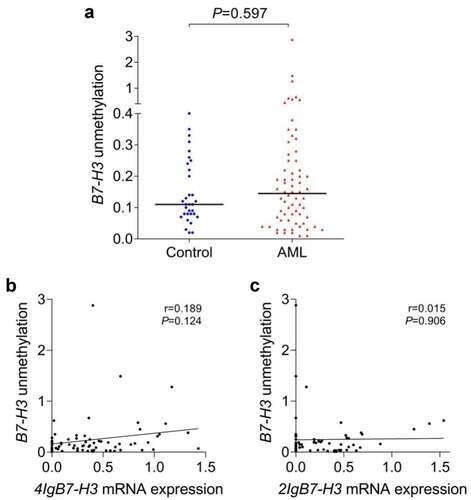
RQ-MSP was designed to determine B7-H3 promoter methylation state in 8 AML cell lines, 68 AML patients and 32 controls. In cell lines, the B7-H3 methylation was detected in HL-60 and HEL, and partial methylation was found in U937 (data not shown). A majority of AML cell lines and clinical samples had the unmethylated state of B7-H3 gene promoter, and no significant difference in B7-H3 unmethylation level between AML patients and controls (P = 0.597, )). Furthermore, we searched DiseaseMeth Databases (http://bioinfo.hrbmu.edu.cn/diseasemeth) and consistently confirmed that the methylation or low methylation level of the B7-H3 promoter region had no marked difference between the AML group and controls (P = 0.6366). Besides, correlation analysis revealed that the unmethylation level of the B7-H3 promoter had no significant relationship with either 4Ig or 2Ig mRNA expression ().
Figure 8. B7-H3 unmethylation level and its correlation with the mRNA expression of B7-H3 isoforms in de novo AML patients. (a) B7-H3 unmethylation level in AML patients and controls. (b-c) Correlation between B7-H3 promoter unmethylation level and the mRNA expression of 4Ig B7-H3 and 2Ig B7-H3 in AML patients
Discussion
B7-H3 gene was firstly identified in a human DC-derived cDNA library by Chapoval et al. [Citation8]. The mouse B7-H3 gene was described as a molecule consisting of two Ig-like domains (2IgB7-H3, 2Ig), while human B7-H3 had the other isoform with four Ig-like domains (4IgB7-H3, 4Ig), resulting from gene duplication and differential splicing [Citation5,Citation19]. The two isoforms share identical exons, resulting in the same transmembrane and intracellular sequences [Citation19]. In the present study, four sets of primers specific to B7-H3 isoforms were selected to perform RT-PCR. Consistent with the previous studies, we found that the two B7-H3 isoforms 4Ig and 2Ig were widely expressed in AML cell lines, de novo AML patients and controls, and they were persistently detected through RT-PCR by increasing annealing temperature and reducing cycles, followed by DNA sequencing confirmed. 4Ig was the dominant type of isoform. Among 8 AML cell lines, SKM-1 had remarkably higher expression abundance of 2Ig than that of 4Ig, suggesting that the aberrant 2Ig mRNA expression might participate in the progression of AML with myelodysplasia-related changes. Furthermore, the ROC curve analysis suggested that the 2Ig mRNA expression level, but not 4Ig, could become a biomarker for diagnosing AML. This study firstly exhibited that both the mRNA expression rate and the expression abundance of 2Ig were significantly elevated in de novo AML patients, and high 2Ig mRNA expression indicated shorter OS in the whole and the non-M3 AML cohorts. The 2Ig mRNA overexpression might harm the prognosis of AML patients, although it was no statistical differences in multivariate analysis. The independent poor prognostic factors for OS both in the whole and non-M3 AML cohorts were the TP53 mutation and no CR after standard induction therapy for two cycles.
Aberrant protein overexpression of B7-H3 has shown up in a wide range of solid cancer tissues, including the brain [Citation20], lung [Citation21], liver [Citation22], pancreatic [Citation23], and colorectal cancers [Citation24]. It is linked to more advanced diseases and poor prognosis. In 134 acute leukemia patients, the B7-H3 membrane protein expression was substantially superior in CD34+ cases, with a 44.8% positive rate, and predicted an unfavorable outcome in AML patients [Citation11]. Another research reported that the membrane protein of B7-H3 was expressed in blast cells in 30 of the 111 AML patients (27%), B7-H3-positive patients had prolonged event-free survival (P = 0.014) and improved overall survival tendency [Citation18]. However, few studies have focused on individual B7-H3 isoform’s protein expression characteristics. Wang et al. [Citation25] generated two specific monoclonal antibodies recognizing 2Ig and total B7-H3 isoforms for an immunohistochemical test and found that 2Ig, but not 4Ig, was specifically expressed in glioma. In this study, two B7-H3-specific antibodies 3H4 and 2E6, which specifically recognized 4Ig and the total B7-H3, were selected for detecting membrane protein expression of B7-H3 isoforms in AML cell lines, de novo AML patients and controls. It also confirmed that 4Ig rather than 2Ig was the dominant expression isoform in most AML cell lines and de novo AML patients. Interestingly, we found the SKM-1 cell line had a low membrane protein expression abundance of 4Ig, while the total B7-H3 expressed relatively higher. Similarly, with its mRNA expression state, 2Ig might be the main B7-H3 isoform type in SKM-1, and it was presumed again that 2Ig might participate in the disease progression. The total B7-H3 membrane protein and MFI ratio of blast cells and lymphocytes in de novo AML patients were higher than the controls. Perhaps because of the summarization of 2Ig membrane protein into total B7-H3 expression levels, total B7-H3 expression rates and MFI ratios could preferably distinguish AML patients from controls. By ROC curve analysis, the total B7-H3 MFI ratio, with the highest AUC value, might be a utility biomarker for AML diagnosis. Besides, the AML patients could be divided into low and high total B7-H3 membrane protein expression groups with cut off value of 6.265, and the B7-H3high patients accounted for 45.2% (28/62). In univariate analysis, the high B7-H3 MFI ratio predicted a poor prognosis in the non-M3 AML cohort. However, the total B7-H3 isoforms membrane protein expression level was not identified to be an independent prognostic biomarker in multivariate analysis.
Aberrant patterns of DNA promoter methylation is a common epigenetic alteration, which regulates several gene expressions and participates in leukemogenesis [Citation26]. To explore the pathogenic mechanisms and biological characteristics of AML, it is recommended to include DNA methylation analysis in disease classification [Citation27]. The promoter methylation at cg10586317 loci exhibited the negative association with B7-H3 expression in lower-grade gliomas, which was analyzed through 15 methylation probes designed for B7-H3 from Infinium HumanMethylation450 BeadChip [Citation28]. B7-H3 promoter methylation was also inversely correlated with B7-H3 mRNA levels in 379 colorectal cancer samples, using TCGA data from cBioPortal (Spearman: −0.383) [Citation29]. In the current study, we designed RQ-MSP to determine the promoter methylation state of B7-H3 in AML cell lines, de novo AML patients and controls. Similarly, with the results from the DiseaseMeth database, the majority of AML cell lines and clinical samples had the B7-H3 unmethylated state, and the unmethylation level showed no significant difference between AML patients and controls. Though, there was no substantial relationships between the unmethylation level of the B7-H3 promoter and the mRNA expression of B7-H3 isoforms. Collectively, it is indicated that B7-H3 promoter methylation was not the main epigenetic mechanism regulating B7-H3 isoforms expression in AML, differently from the previous results on some solid tumors. It had been stated that several miRNAs could regulate B7-H3 gene expression in many solid tumors [Citation30], and miR-506 could inhibit cell proliferation and invasion by suppress B7-H3 expression in mantle cell lymphoma [Citation31]. Thus, we should perform further studies to determine the epigenetic regulation mechanism of 4Ig and 2Ig expression in AML, including miRNAs. Besides, the gradually increased B7-H3 mRNA levels were found in cases with gene copy number alterations (shallow deletions, diploid and copy number gains) in colorectal cancer samples from four studies queried with cBioPortal [Citation29]. Therefore, whether the two B7-H3 isoforms were genetically dysregulated in AML also requested further researches to assess.
This study has several limitations: Firstly, we initially collected a small dataset of AML patients to assess the expression characteristic of two B7-H3 isoforms. Further studies with expanded cohorts are required to verify the results of two B7-H3 isoforms expression state in AML. Secondly, we indirectly detected the membrane protein level of two B7-H3 isoforms in flow cytometry by using two monoclonal antibodies, one of which could recognize both 4Ig and 2Ig and the other specifically bonded 4Ig. Subsequent experiments should be validated by direct approaches to differentiate two isoforms on protein level, such as Western blot combined with flow cytometry. Although we found B7-H3 isoforms expression were methylation-independent in AML patients, the main mechanism regulating the two isoforms expression were unclear. Therefore, the relative regulatory genes and signaling pathways of B7-H3 isoforms should be screened through bioinformatics analysis, and then be validated by the in vivo and in vitro experiments.
Conclusion
This study suggests that both overexpression of 2Ig in mRNA level and total B7-H3 in membrane protein level may tend to have potential diagnostic value in AML. The OS is worse in the patients with high 2Ig mRNA or total B7-H3 membrane protein expression, although they were not independent prognostic biomarkers. In addition, the expression of B7-H3 isoforms is methylation-independent in AML, which is worth to perform further research focusing on epigenetic and genetical regulation in order to find new therapeutic targets.
HIGHLIGHTS
2Ig B7-H3 mRNA expression was elevated in AML than that of controls.
The OS of 2Ig high group was shorter than 2Ig low group in AML.
Membrane protein expression of total B7-H3 isoforms in AML was higher than controls.
The worse OS was in B7-H3high group in AML, compared with B7-H3low group.
4Ig B7-H3 and 2Ig B7-H3 expression are methylation-independent in AML.
Ethics committee approval
This study was conducted according to the Declaration of Helsinki and was approved by the Institutional Ethics Committee of the Affiliated Jiangning Hospital with Nanjing Medical University (2020-03-033-K01) and the Affiliated People’s Hospital of Jiangsu University (K-20180035-Y).
Author contribution
Wei Zhang, Jinning Shi and Hong Zhou conceived and designed this study. Jinning Shi and Hong Zhou provided administrative support. Wei Zhang, Lingyi Zhang, Jun Qian and Jiang Lin conducted the study methods. Wei Zhang, Qian Yuan and Jingdong Zhou collected and assembled clinical data. Wei Zhang, Qiaoyun Chen and Tingjuan Zhang developed the data interpretation and analysis. Wei Zhang and Jinning Shi wrote and revised the manuscript. All authors approved the final manuscript.
Acknowledgements
We are very grateful for the assistance from Professor Xueguang Zhang of Institute of Medical Biotechnology of Soochow University and Jiangsu Institute of Clinical Immunology.
Disclosure statement
No potential conflict of interest was reported by the authors.
Additional information
Funding
References
- Khwaja A, Bjorkholm M, Gale RE, et al. Acute myeloid leukaemia. Nat Rev Dis Primers. 2016;2:16010.
- Kadia TM, Ravandi F, Cortes J, et al. Toward individualized therapy in acute myeloid leukemia: a contemporary review. JAMA Oncol. 2015;1:820–828.
- DiNardo CD, Wei AH. How I treat acute myeloid leukemia in the era of new drugs. Blood. 2020;135:85–96.
- Nair R, Salinas-Illarena A, Baldauf HM. New strategies to treat AML: novel insights into AML survival pathways and combination therapies. Leukemia. 2021;35:299–311.
- Steinberger P, Majdic O, Derdak SV, et al. Molecular characterization of human 4Ig-B7-H3, a member of the B7 family with four Ig-like domains. J Immunol. 2004;172:2352–2359.
- Zhou YH, Chen YJ, Ma ZY, et al. 4IgB7-H3 is the major isoform expressed on immunocytes as well as malignant cells. Tissue Antigens. 2007;70:96–104.
- Sun J, Fu F, Gu W, et al. Origination of new immunological functions in the costimulatory molecule B7-H3: the role of exon duplication in evolution of the immune system. PLoS One. 2011;6:e24751.
- Chapoval AI, Ni J, Lau JS, et al. B7-H3: a costimulatory molecule for T cell activation and IFN-gamma production. Nat Immunol. 2001;2:269–274.
- Picarda E, Ohaegbulam KC, Zang X. Molecular pathways: targeting B7-H3 (CD276) for human cancer immunotherapy. Clin Cancer Res. 2016;22:3425–3431.
- Zhang W, Wang J, Wang Y, et al. B7-H3 silencing by RNAi inhibits tumor progression and enhances chemosensitivity in U937 cells. Onco Targets Ther. 2015;8:1721–1733.
- Hu Y, Lv X, Wu Y, et al. Expression of costimulatory molecule B7-H3 and its prognostic implications in human acute leukemia. Hematology. 2015;20:187–195.
- Sun X, Tian Y, Wang J, et al. Genome-wide analysis reveals the association between alternative splicing and DNA methylation across human solid tumors. BMC Med Genomics. 2020;13:4.
- Vardiman JW, Thiele J, Arber DA, et al. The 2008 revision of the World Health Organization (WHO) classification of myeloid neoplasms and acute leukemia: rationale and important changes. Blood. 2009;114:937–951.
- Zhang ZH, Zhang W, Zhou JD, et al. Decreased SCIN expression, associated with promoter methylation, is a valuable predictor for prognosis in acute myeloid leukemia. Mol Carcinog. 2018;57:735–744.
- O’Donnell MR, Abboud CN, Altman J, et al. NCCN clinical practice guidelines acute myeloid leukemia. J Natl Compr Canc Netw. 2012;10:984–1021.
- Tallman MS, Wang ES, Altman JK, et al. Acute myeloid leukemia, version 3.2019, NCCN clinical practice guidelines in oncology. J Natl Compr Canc Netw. 2019;17:721–749.
- Zhang W, Wang J, Wang YF, et al. [Expression and subcellular distribution of costimulatory molecules B7-H1,B7-H3 and B7-H4 in human hematologic malignancy cell lines]. J Exp Hematol. 2016;24:1539–1546.
- Guery T, Roumier C, Berthon C, et al. B7-H3 protein expression in acute myeloid leukemia. Cancer Med. 2015;4:1879–1883.
- Sun M, Richards S, Prasad DV, et al. Characterization of mouse and human B7-H3 genes. J Immunol. 2002;168:6294–6297.
- Xu H, Cheung IY, Guo HF, et al. MicroRNA miR-29 modulates expression of immunoinhibitory molecule B7-H3: potential implications for immune based therapy of human solid tumors. Cancer Res. 2009;69:6275–6281.
- Chen C, Shen Y, Qu QX, et al. Induced expression of B7-H3 on the lung cancer cells and macrophages suppresses T-cell mediating anti-tumor immune response. Exp Cell Res. 2013;319:96–102.
- Sun TW, Gao Q, Qiu SJ, et al. B7-H3 is expressed in human hepatocellular carcinoma and is associated with tumor aggressiveness and postoperative recurrence. Cancer Immunol Immunother. 2012;61:2171–2182.
- Inamura K, Takazawa Y, Inoue Y, et al. Tumor B7-H3 (CD276) expression and survival in pancreatic cancer. J Clin Med. 2018;7:172.
- Zhang T, Wang F, Wu JY, et al. Clinical correlation of B7-H3 and B3GALT4 with the prognosis of colorectal cancer. World J Gastroenterol. 2018;24:3538–3546.
- Wang Z, Yang J, Zhu Y, et al. Differential expression of 2IgB7-H3 and 4IgB7-H3 in cancer cell lines and glioma tissues. Oncol Lett. 2015;10:2204–2208.
- Wouters BJ, Delwel R. Epigenetics and approaches to targeted epigenetic therapy in acute myeloid leukemia. Blood. 2016;127:42–52.
- Giacopelli B, Wang M, Cleary A, et al. DNA methylation epitypes highlight underlying developmental and disease pathways in acute myeloid leukemia. Genome Res. 2021;31:747–761.
- Wang Z, Wang Z, Zhang C, et al. Genetic and clinical characterization of B7-H3 (CD276) expression and epigenetic regulation in diffuse brain glioma. Cancer Sci. 2018;109:2697–2705.
- Tang J, Jiang W, Liu D, et al. The comprehensive molecular landscape of the immunologic co-stimulator B7 and TNFR ligand receptor families in colorectal cancer: immunotherapeutic implications with microsatellite instability. Oncoimmunology. 2018;7:e1488566.
- Yang Q, Cao W, Wang Z, et al. Regulation of cancer immune escape: the roles of miRNAs in immune checkpoint proteins. Cancer Lett. 2018;431:73–84.
- Zhu XW, Wang J, Zhu MX, et al. MicroRNA-506 inhibits the proliferation and invasion of mantle cell lymphoma cells by targeting B7H3. Biochem Biophys Res Commun. 2019;508:1067–1073.
- Zhao X, Li DC, Zhu XG, et al. B7-H3 overexpression in pancreatic cancer promotes tumor progression. Int J Mol Med. 2013;31:283–291.
- Zhang W, Wang Y, Wang J, et al. B7-H3 silencing inhibits tumor progression of mantle cell lymphoma and enhances chemosensitivity. Int J Oncol. 2015;46:2562–2572.