
ABSTRACT
AKT Serine/Threonine Kinase 3 (AKT3) has been reported to play an important role in different tumors. However, its clinical value, biological function, and molecular mechanism in testicular germ cell tumors (TGCT) remains unclear. In the current study, we applied the Gene Set Cancer Analysis (GSCA), UCSC XENA, Gene Expression Omnibus (GEO), the Human Protein Atlas (HPA), LinkedOmics, DiseaseMeth version 2.0, TISIDB, and other databases for TGCT data mining. Then, we investigated AKT3’s mechanism of action and clinical survival significance via bioinformatics followed by in vitro experiments. We found that AKT3 was upregulated and had frequent copy number amplifications in TGCT, which were associated with poor survival outcomes of patients. On the other hand, mutations that led to AKT3 loss-of-function were correlated to a better prognosis in patients. Moreover, AKT3 silencing significantly inhibited the proliferation, DNA synthesis and colony formation of NCCIT cells (a TGCT cell line). AKT3 might participate in TGCT progression through multiple signaling pathways, such as ErbB, oxidative phosphorylation, and affecting tumor immune infiltration. Also, the upregulation of AKT3 mRNA expression might be driven by the hypomethylation of its promoter region. Overall, AKT3 is a potential TGCT oncogene and can be further used as a therapeutic target.
KEYWORDS:
Introduction
Testicular germ cell tumors (TGCT) are malignant solid tumors frequently occurring in men from 15 to 40 years [Citation1]. Histologically, TGCT have two major subtypes: seminomas (SE) and non-seminomas (NSE). It is believed that NSE originates from earlier gonadal stem cells and SE from later gonadal stem cells [Citation2]. Besides, NSE is more likely to metastasize due to its lower sensitivity to chemotherapy and radiotherapy, resulting in more adverse outcomes [Citation3]. Currently, TGCTs are managed mainly by surgery, radiotherapy, and cisplatin-based chemotherapy, which can contribute to an overall cure rate of up to ~80% [Citation4]. Unfortunately, 20% of patients respond incompletely to such treatments, have a risk of recurrence and 15% will have a refractory disease [Citation5]. Therefore, understanding TGCT’s occurrence and development, and the mechanisms behind their metastasis and recurrence in a comprehensive fashion are required to develop more effective therapeutic strategies.
AKT3, is an AKT subtype, is composed of two different splice variants: AKT3/+S472 and AKT3/-S472. Generally, AKT3/-S472 leads to a protein lacking a phosphorylation site at S472 [Citation6], and AKT phosphorylated at this spot can negatively regulate cell apoptosis [Citation7]. Additionally, the crucial functional roles of AKT3 in several tumors have been well investigated. For instance, AKT3 can be regulated by miR-582-5p to promote tumor cell proliferation in gastric cancer [Citation8]. Besides, the activation of the miR-665/AKT3 signaling pathway can enhance the proliferation and metastasis of ovarian tumor cells [Citation9]. Furthermore, increasing evidence indicates that AKT3 can be an oncogene in many cancers, including osteosarcoma [Citation10], colorectal cancer [Citation11], prostate cancer [Citation12], and breast cancer [Citation13]. In TGCT, the TR4/AKT3 signaling was identified as a potential promotor of tumor metastasis [Citation14]. Nevertheless, the clinical significance and specific role of AKT3 in TGCTs remains unclear. Thus, we hypothesized that AKT3 would be highly expressed in TGCT patients, and this high expression would be driven by DNA copy number amplification and hypomethylation. Additionally, AKT3 would participate in the proliferation, colony formation, immune infiltration, and drug sensitivity of TGCT through different signaling pathways. Therefore, in the current study, we evaluated AKT3’s possible roles and mechanisms in TGCT via data mining and in vitro experimental verification to provide new ideas for future treatment strategies.
Materials and methods
Genomic variation and expression analysis of AKT3 in TGCT
AKT3 gene copy number variations (CNVs) and the corresponding associations with AKT3 mRNA expression and survival outcome in TGCT patients were analyzed using the data available on the Gene Set Cancer Analysis (GSCA) online software (http://bioinfo.life.hust.edu.cn/GSCA/#/) and based on the TGCT dataset from The Cancer Genome Atlas (TCGA) project with default parameters [Citation15]. Then, AKT3 mRNA differential expression data in TGCT were retrieved from the Gene Expression Omnibus (GEO) database (accession number: GSE3218) [Citation16]. The detailed information on TCGA (TCGA-TGCT) and GEO (GSE3218) datasets are as . Correlation analyses between AKT3 mRNA expression and survival in TGCT patients were implemented via the Kaplan-Meier Plotter [Citation17] online tool (http://kmplot.com/analysis/index.php?p=background) and based on the TCGA-TGCT dataset. AKT3 protein levels data in normal testis and TGCT were retrieved from the Human Protein Atlas (HPA) [Citation18] database (https://www.proteinatlas.org/). The proportion of positive cells per unit area is used to determine the difference of AKT3 expression among groups. The mutation frequency of AKT3 in TGCT patients and its associations with clinicopathological characteristics were analyzed by the cBioPortal [Citation19] online tool (https://www.cbioportal.org/).
Table 1. The detailed information on TCGA-TGCT and GSE3218 datasets
Cell culture and siRNA-silencing
The human TGCT cell line, NCCIT (NSE cell line), was the most widely used and most common TGCT cell line and NCCIT cells have stronger proliferation and clone formation capabilities. We obtained the NCCIT cell line from proffessor Suren Chen. First, cells were grown in RPMI-1640 medium (Gibco) containing 10% fetal bovine serum (FBS, Gibco), 100 U/mL penicillin, and 100 μg/mL streptomycin (Gibco) in a constant temperature and humidity incubator at 37 °C and 5% CO2. Cells growing logarithmically were collected and transferred to a 6-well plate (5.0 × 10⁵ cells/well). Then they were processed by small interfering RNA (siRNA) transfection until the cell density reached about 70%. According to the manufacturer’s instructions, AKT3 siRNA (siRNA1, siRNA2) and scrambled siRNA were transfected into cells using the Lipofectamine 3000 transfection reagent to generate experimental and control groups, respectively. After 48 h of transfection, cells were collected for subsequent experiments. All siRNAs were designed and synthesized by Guangzhou RiboBio.
RNA extraction and qRT-PCR
Total RNA of the NCCIT cells was extracted by TRIzol (Invitrogen). One μg of RNA was used as a template, and the first-strand complementary DNA (cDNA) synthesis was completed using the Transcriptor First Strand cDNA Synthesis Kit (Roche). Next, the cDNA was processed for qRT-PCR using the LightCycler 480 PCR instrument (Roche), according to the LightCycler 480 SYBR Green I Master (Roche) experimental instructions. The AKT3 mRNA expression level, relative to β-actin, was calculated by the 2−ΔΔCT method. The primers were designed and synthesized by Shanghai Sangon as follows: AKT3 forward: 5’ – ACCGCACACGTTTCTATGGT-3’, reverse: 5’ – CCCTCCACCAAGGCGTTTAT-3’; β-actin forward: 5’ – TCACCAACTGGGACGACATG-3’, reverse: 5’ – GTCACCGGAGTCCATCACGAT – 3’.
MTT
After transfection, NCCIT cells were inoculated into a 96-well plate (1 × 10³ cells/well – 100 μL) and transferred to a constant temperature and humidity incubator. At 6 h, 1, 2, 3, 4, and 5 d, 10 μL of MTT solution was added into each well, then cultured for additional 4 hours. The absorbance at 450 nm was measured by enzyme-linked immunosorbent assay to determine the cell proliferation status in each well.
EdU
After 72 h of transfection, NCCIT cells were transferred to a medium containing the EdU reagent for 2 h. Then, the medium was discarded and replaced by 4% paraformaldehyde to fix the cells at room temperature for 20 min, followed by 2 mg/mL glycine solution to neutralize and 0.5% Triton X-100. Next, the plate was washed twice with PBS. The 1× Apollo 643 staining solution was prepared according to instructions, then added into wells for 30 min at normal temperature, and protected from light. The staining solution was replaced by 0.5% Triton X-100, and the plate was washed on a shaker (2 to 3 times, 10 min each). The permeate was discarded and the plate was washed twice with PBS. Finally, 1× DAPI reaction solution was added, and cells were incubated for 30 min at room temperature in the dark. The reaction solution was removed, and the plate was washed 3 times with PBS. Images were captured by Acumen X3.
Colony formation assay
First, cells were harvested 36 h after transfection and seeded into a 6-well plate (5 × 10² cells/well). Three repetitions were performed for each group. For cell culture, a constant temperature incubator was used and the complete medium was replaced once during the process. After 2 weeks, the medium was discarded and the plate was washed twice with PBS. Subsequently, 4% paraformaldehyde was used to fix cells (30 min), followed by crystal violet staining solution (1 mL) at room temperature (15 min). Finally, images were photographed.
Gene co-expression and pathway enrichment analyses
LinkedOmics online tool contains multi-omics data and clinical data for cancer patients from TCGA project. We can use this tool to analyze the co-expressed genes and regulatory networks of target genes. Moreover, this tool is also directly linked to the WebGestalt database, which can facilitate the enrichment analysis and visualization data. For AKT3 gene co-expression analysis, the LinkedOmics [Citation20] online tool was applied based on the TCGA-TGCT cohort data, along with the Spearman correlation test to identify the top 50 most positively or negatively genes correlated with AKT3 (visualized by a heat map). For biological analysis, Gene Set Enrichment Analysis (GSEA) was performed using the LinkedOmics online tool based on GO and KEGG databases. Gene co-expression and pathway enrichment analyses were implemented with default parameters. A false discovery rate (FDR) of less than 0.05 is determined to be statistically significant.
AKT3 methylation analysis
The CpG islands around the AKT3 gene promoter were profiled by the UCSC Genome online tool (https://genome.ucsc.edu/). The DNA methylation data of the AKT3 gene was retrieved from the DiseaseMeth version 2.0 database (http://bio-bigdata.hrbmu.edu.cn/diseasemeth/). The correlation between AKT3 mRNA and methylation levels was retrieved from the UCSC XENA database [Citation21] based on the TCGA-TGCT cohort.
Correlation of AKT3 mRNA with immune cells, molecules, infiltration, and drug sensitivity
Correlation analyses for AKT3 mRNA were performed based on the TCGA-TGCT cohort data using default parameters. The TISIDB [Citation22] database (http://cis.hku.hk/TISIDB/index.php) was applied to characterize AKT3 mRNA associations with immune cells and molecules, and the Gene Set Cancer Analysis (GSCA) online software was used to identify its associations with immune infiltration and drug sensitivity.
Statistical analyses
Differences between two groups were analyzed by the Student’s t-test, and among more than two groups by analysis of variance (ANOVA). The survival significance was determined by a p < 0.05 in the log-rank test. Histograms and Broken Line Charts construction and statistical analyses were performed using the GraphPad Prism v.5 software.
Results
In this study, we hypothesized that AKT3 would be abnormally expressed in TGCT and regulated by copy number variation and DNA methylation. Thus, it would participate in the proliferation, colony formation, immune infiltration, drug sensitivity, and other TGCT processes. Therefore, we used GSCA, UCSC XENA, GEO, HPA, and DiseaseMeth for data mining. We found that the high AKT3 expression can be related to its copy number amplification and DNA hypomethylation. Additionally, our in vitro experiments confirmed that AKT3 can promote the proliferation and colony formation of TGCT cells. LinkedOmics and TISIDB database analyses revealed that AKT3 might be related to the activation of multiple oncogenic signaling pathways and immune infiltration in TGCT. These results suggested that AKT3 can be a potential target for TGCT treatments.
High AKT3 expression is related to poor outcomes of TGCT patients
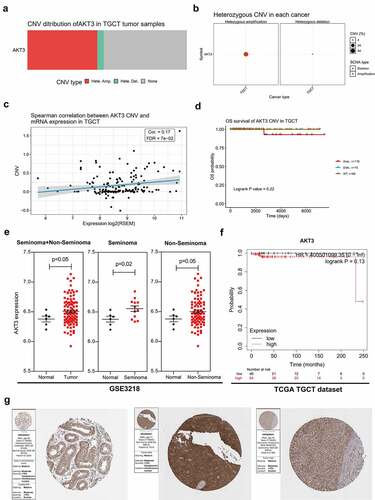
In the TCGA-TGCT cohort, CNVs were mainly manifested by heterozygous amplification, along with heterozygous deletion in a very small number of samples (). Additionally, a positive correlation was detected between AKT3 mRNA expression and CNVs (). Patients with heterozygous amplification tended to have a worse outcome than those with copy number deletion and wild-type AKT3 (). Also, we found that AKT3 expression levels in tumor tissues were higher than in normal ones (). Based on TCGA-TGCT data, higher AKT3 mRNA expressions (cut off value = 487) tended to correlate to a poorer overall survival outcome (, ). However, no statistical difference was detected due to the small sample size or the higher survival rate of patients. Finally, we found that AKT3 proteins increased in TGCT ().
Table 2. The clinical follow-up data in TCGA-TGCT dataset
Figure 1. AKT3 high copy number and expression correlates to TGCT patients prognosis. (a) 100% Stacked Column Chart showing CNV of the AKT3 gene in the TCGA-TGCT cohort. (b) Bubble Chart showing CNV type of the AKT3 gene in the TCGA-TGCT cohort. (c) Correlation between AKT3 CNV and mRNA expression in the TCGA-TGCT cohort. (d) Correlation between AKT3 CNV and the survival outcome of patients in the TCGA-TGCT cohort. (e) AKT3 differential expression in tumor versus normal tissues from GSE3218. (f) Correlation between AKT3 mRNA expression and the survival outcome of patients from the TCGA-TGCT cohort. (g) AKT3 protein levels in normal testis and TGCT
AKT3 mutations are correlated to moderate survival outcomes in TGCT patients
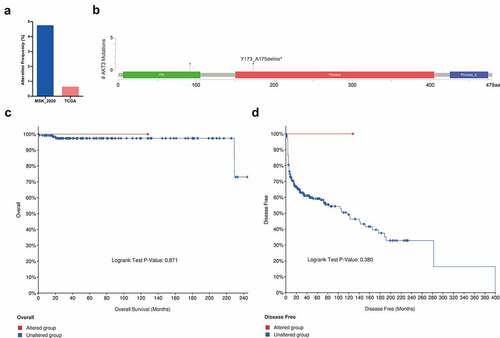
Mutation analysis showed a low AKT3 mutation frequency in TGCT (). Mutations were mainly located in the PH and Pkinase functional domains (). Furthermore, we demonstrated that patients with AKT3 mutations had better overall and recurrence-free survivals ().
Figure 2. AKT3 mutation is associated with survival outcomes of TGCT patients. (a) Mutation frequency of AKT3 in different TGCT cohorts in the cBioPortal database. (b) The position of the AKT3 mutation site on the AKT3 protein. (c) Association of AKT3 mutation with overall survival. (d) Association of AKT3 mutation with disease-free survival
AKT3 promotes NCCIT cells’ proliferation and colony formation
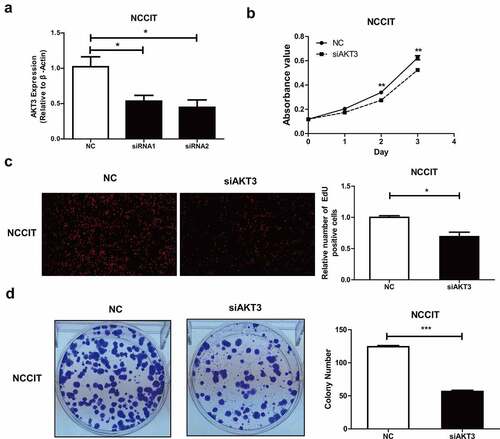
Further, we conducted in vitro experiments to evaluate AKT3’s biological functions. First, NCCIT cells were treated by AKT3-siRNA to create an AKT3-silencing cell model. Two siRNAs (siRNA1, siRNA2) were used. The siRNA2 had a better silencing effect and was selected for subsequent experiments (). MTT results revealed reduced proliferative ability of cells upon AKT3 silencing (). Similarly, the DNA synthesis and colony formation ability of NCCIT cells significantly decreased when AKT3 expression was silenced ().
Figure 3. Effect of AKT3 silencing on NCCIT cells biological functions. (a) The silencing effect of AKT3 siRNA by qRT-PCR. (b) MTT assay showing cell proliferation upon AKT3 silencing. (c) EdU assay showing DNA synthesis ability of AKT3-silenced NCCIT cells. (d) Colony formation assay showing cell colony formation ability after AKT3 silencing. *p< 0.05, **p< 0.01, ***p< 0.001
AKT3 can regulate multiple signaling pathways in TGCT
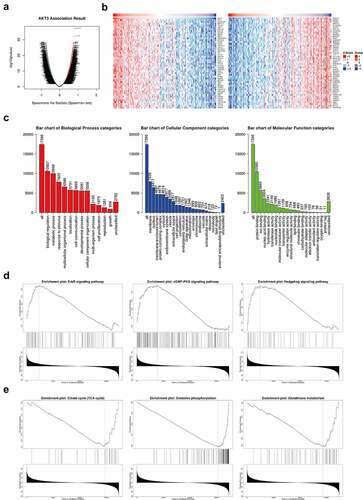
We obtained 5,036 positively and 3,849 negatively correlated genes with AKT3 expression (), and the top 50 are displayed on the heat map (, ). These genes were significantly enriched for cancer-promoting terms, such as cell proliferation, growth, cytoskeleton, nucleic acid binding, enzyme regulatory activity (). Moreover, KEGG analysis indicated significant enrichment in ErbB, cGMP-PKG, and Hedgehog signaling pathways. The TCA cycle, oxidative phosphorylation, and glutathione metabolism signaling pathways were also significantly enriched (/E).
Table 3. Each 50 gene which showed positive and negative correlation with AKT3 expression based on TCGA-TGCT dataset
Figure 4. Enrichment analysis of AKT3 co-expressed genes. (a) Volcano map of genes significantly associated with AKT3. (b) Heat Map showing genes that are significantly positively and negatively related to AKT3. (c) Most enriched GO terms from Biological Process, Cellular Component, and Molecular Function. D, (e) Most enriched KEGG pathways
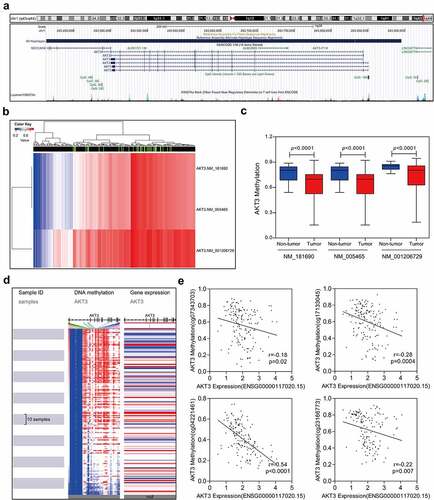
AKT3 mRNA expression might be regulated by DNA methylation
DNA methylation can participate in the regulation of various genes. Multiple CpG islands were noted around the AKT3 promoter region (). Then, the methylation level of AKT3 was retrieved from the TGCT methylation data. We found that all AKT3 transcripts were methylated to varying degrees (), and the level was significantly lower in TGCT tumor tissues compared to controls (). Moreover, the methylation signal intensity on CpG islands was negatively correlated to AKT3 mRNA expression levels (). Finally, four methylation signal probe datasets were randomly selected and demonstrated a clear negative correlation between AKT3 methylation and mRNA expression levels ().
Figure 5. Correlation between AKT3 DNA methylation and mRNA expression level. (a) Distribution of AKT3 CpG islands. (b) Heatmap showing DNA methylation levels in different AKT3 subtypes. (c) The methylation level of AKT3 significantly reduced in TGCT samples. (d) Heatmap of AKT3 DNA methylation and expression levels. (e) Correlation between signal values of different AKT3 methylation probes and mRNA expression
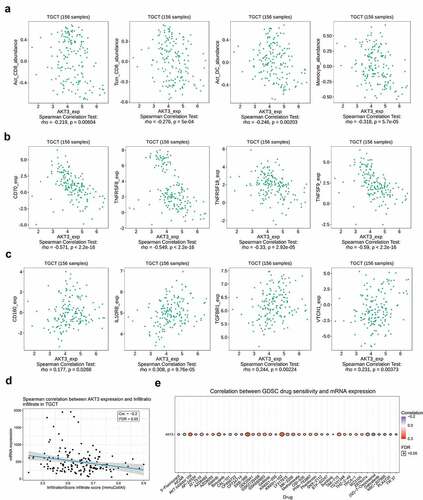
AKT3 expression correlates to TGCT immune infiltration and drug sensitivity
Many studies have shown that tumor immune infiltrates are involved in the occurrence and development of tumors and can be potential prognostic markers for patients’ survival outcomes. Here, we demonstrated a significantly negative correlation of AKT3 expression with the abundance of tumor-infiltrating cells, including activated CD8 + T cells, CD8+ memory T cells, activated dendritic cells, and monocytes (). Besides, the AKT3 expression was related to many immune-related molecules. We found that the AKT3 expression significantly negatively correlated to immune-activating molecules, including CD70, TNFRSF8, TNFRSF18, TNFSF9 (); while positively correlated to immunosuppressive molecules, including CD160, IL10RB, TGFBR1, and VTCN1 (). Additionally, we detected a significantly negative correlation between AKT3 expression and immune infiltration scores (). The drug sensitivity analysis revealed a positive correlation between the AKT3 expression and the sensitivity to different drugs (). The AKT3 expression was significantly positively correlated with the sensitivity to AKT inhibitors VIII, MK-2206, and GSK690693. Also, its expression level was related to the sensitivity to the CDK inhibitor AT-7519. These data suggest that these inhibitors can be used for AKT3 in vivo experiments, especially AKT inhibitors VIII, MK-2206, and GSK690693.
Figure 6. AKT3 is associated with tumor immune infiltration and drug sensitivity. (a) Correlation with different types of immune infiltrates. (b) Correlation with immune-activating molecules. (c) Correlation with immunosuppressive molecules. (d) Correlation with the TGCT overall immune infiltration. (e) Correlation with the sensitivity to multiple drugs
Discussion
Multiple studies have demonstrated that AKT3 is involved in almost all processes during tumor initiation and progression, including proliferation, migration, invasion, and drug resistance. For example, a prostate cancer study found that AKT3 overexpression could lead to increased resistance of differentiated neuroendocrine tumor cells to androgen therapy [Citation23]. In interstitial colorectal cancer, AKT3 played a promotive role in tumor cell growth and was potentially correlated to the malignant epithelial-mesenchymal transition (EMT) [Citation24]. On the other hand, different AKT3 functions have been reported. For example, a team from the Universität Hamburg, Germany, found that AKT3 silencing contributed to increased invasion and migration of breast cancer cells by activating HER2 and DDR signals [Citation25]. The aforementioned studies reflect the complexity and diversity of AKT3 molecular functions. Thus, more in-depth studies should be conducted. In the current study, we demonstrated for the first time the promotive role of AKT3 expression in the proliferation and colony formation of NSE cells, indicative of the potential cancer-promoting role of AKT3 in TGCT, especially NSE. A further in-depth study on the underlying mechanism might help AKT3 become a molecular target for NSE treatments.
Also, AKT3 co-expressed genes were identified and annotated by GO analysis. The results revealed significant enrichment of biological processes related to cell proliferation, indicating the role of AKT3 in the regulation of this process. Additionally, KEGG pathway enrichment analysis showed that AKT3 positive-related genes were significantly enriched in cancer-promoting signaling pathways such as ErbB and Hedgehog, suggesting that, in TGCT, AKT3 is more likely to promote tumor progression. Besides, AKT3 negative-related genes were found highly activated in metabolism-related signaling pathways such as the TCA cycle, oxidative phosphorylation, and glutathione metabolism, which suggested the involvement of AKT3 in the energy metabolism and oxidative stress of tumor cells. However, the mechanisms underlying the AKT3 participation in these signaling pathways remain unclear.
DNA methylation is essential for gene transcriptional regulation and generally serves as a determinant of transcriptional activity [Citation26,Citation27]. Previous studies revealed that DNA methylation was closely related to cisplatin resistance in TCGT patients [Citation28]. Also, the high expression of DNA methyltransferase 3B was related to the sensitivity of TGCT to 5-aza-deoxycytidine [Citation29]. In the present study, data from multiple databases showed significantly hypomethylated AKT3 promoters in TGCT, which was negatively correlated with AKT3 mRNA expression levels. This suggested that AKT3 upregulation is highly likely a result of AKT3 promoter demethylation. Therefore, drugs targeting DNA methylation can be regarded as a new treatment strategy for TGCT.
The tumor immune microenvironment is closely related to tumor progression and treatment. Studies revealed that the abundance of immune infiltrates is significantly related to the outcome of TGCT patients. Also, low infiltration abundances of CD4 + T and CD8 + T cells generally indicate a higher recurrence rate [Citation30–32]. Also, it was reported that AKT3, despite its regulatory role in proliferation and apoptosis, was associated with the infiltration of various immune cells in tumor tissues, including T cells and macrophages [Citation33]. TLR2 is reported to be positively correlated with M0 macrophage infiltration and negatively correlated with naive B and follicular helper T cells in TGCT [Citation34]. In the current study, we found a new marker of TGCT immune infiltration. Based on the TISIDB database, we found a negative correlation between AKT3 expression and the abundance of immune infiltrates, including CD8 + T cells. Additionally, immune-related genes have been previously related to the prognosis of TGCT patients [Citation35]. Here, we found that AKT3 expression was negatively correlated with four immune-activating genes, while positively correlated with four immunosuppressive genes. Therefore, AKT3 might play an important role in TGCT anti-tumor immunity.
Limitations
Our study also has some limitations. For example, our results were obtained from in vitro studies and in vivo experiments are required in the future. Also, the specific molecular mechanism by which AKT3 promotes NCCIT cell proliferation has not been clarified, and further molecular experiments are still needed.
Conclusions & future perspectives
Overall, we showed an increased AKT3 expression in TGCT patients and identified its associations with poor survival outcomes and immune infiltration. AKT3 could also promote the proliferation, DNA synthesis and colony formation of NES cells in vitro. AKT3 might be a potential therapeutic target and a novel molecular marker of TGCT.
Availability of data and materials
The data supporting the findings reported in this study are available from the corresponding author upon reasonable request.
Author contributions
Yang Luo, Qianyin Zhou, Fang Zhu, and Hao Bo mainly performed the experiments and analyzed the data. Qianyin Zhou, Xingming Wang, and Hao Bo wrote the paper. Yang Luo, Hao Bo, and Xingming Wang helped analyze the data. Hao Bo, Xingming Wang, and Liqing Fan carried out the experimental design. All authors edited and approved the final manuscript.
List of abbreviations
TGCT: testicular germ cell tumors; SE: seminomas; NSE: non-seminomas; RPMI: Roswell Park Memorial Institute; FBS: fetal bovine serum; siRNA: small interfering RNA; qRT-PCR: quantitative real-time polymerase chain reaction; GEO: gene expression omnibus; HPA: Human Protein Atlas; TCGA: The Cancer Genome Atlas; CNVs: copy number variations; ANOVA: analysis of variance; GSEA: Gene Set Enrichment Analysis; cDNA: complementary DNA; GSCA: Gene Set Cancer Analysis; EMT: epithelial-mesenchymal transition.
Disclosure statement
No potential conflict of interest was reported by the author(s).
Additional information
Funding
References
- Ferlay J, Soerjomataram I, Dikshit R, et al. Cancer incidence and mortality worldwide: sources, methods and major patterns in GLOBOCAN 2012. Int J Cancer. 2015;136(5):E359–86.
- Tu SM, Lin SH, Logothetis CJ. Stem-cell origin of metastasis and heterogeneity in solid tumours. Lancet Oncol. 2002;3(8):508–513.
- Hanna NH, Einhorn LH. Testicular cancer–discoveries and updates. N Engl J Med. 2014;371(21):2005–2016.
- di Pietro A, Vries EG, Gietema JA, et al. Testicular germ cell tumours: the paradigm of chemo-sensitive solid tumours. Int J Biochem Cell Biol. 2005;37(12):2437–2456.
- International Prognostic Factors Study G, Lorch A, Beyer J, Bascoul-Mollevi C, et al. Prognostic factors in patients with metastatic germ cell tumors who experienced treatment failure with cisplatin-based first-line chemotherapy. J Clin Oncol. 2010;28(33):4906–4911.
- Suyama K, Yao J, Liang H, et al. An AKT3 splice variant lacking the serine 472 phosphorylation site promotes apoptosis and suppresses mammary tumorigenesis. Cancer Res. 2018;78(1):103–114.
- De Vries G, Rosas-Plaza X, van Vugt M, et al. Testicular cancer: Determinants of cisplatin sensitivity and novel therapeutic opportunities. Cancer Treat Rev. 2020;88:102054.
- Jin Y, Tao LP, Yao SC, et al. MicroRNA-582-5p suppressed gastric cancer cell proliferation via targeting AKT3. Eur Rev Med Pharmacol Sci. 2017;21(22):5112–5120.
- Zhao J, Yang T, Ji J, et al. RHPN1-AS1 promotes cell proliferation and migration via miR-665/AKT3 in ovarian cancer. Cancer Gene Ther. 2021;28(1–2):33–41.
- Liu W, Zhou Z, Zhang Q, et al. Overexpression of miR-1258 inhibits cell proliferation by targeting AKT3 in osteosarcoma. Biochem Biophys Res Commun. 2019;510(3):479–486.
- Wang Y-X, Zhu H-F, Zhang Z-Y, et al. MiR-384 inhibits the proliferation of colorectal cancer by targeting AKT3. Cancer Cell Int. 2018;18(1):124.
- Lin H-P, Lin C-Y, Huo C, et al. AKT3 promotes prostate cancer proliferation cells through regulation of AKT, B-Raf & TSC1/TSC2. Oncotarget. 2015;6(29):27097–27112.
- Hinz N, Jucker M. Distinct functions of AKT isoforms in breast cancer: a comprehensive review. Cell Commun Signal. 2019;17(1):154.
- Chen Y, Lu J, Xia L, et al. Testicular orphan receptor 4 promotes tumor progression and implies poor survival through AKT3 regulation in seminoma. Cancer Sci. 2018;109(2):384–394.
- Liu CJ, Hu FF, Xia MX, et al. GSCALite: a web server for gene set cancer analysis. Bioinformatics. 2018;34(21):3771–3772.
- Korkola JE, Heck S, Olshen AB, et al. Development and validation of a gene-based model for outcome prediction in germ cell tumors using a combined genomic and expression profiling approach. PLoS One. 2015;10(12):e0142846.
- Gyorffy B. Survival analysis across the entire transcriptome identifies biomarkers with the highest prognostic power in breast cancer. Comput Struct Biotechnol J. 2021;19:4101–4109.
- Uhlen M, Fagerberg L, Hallstrom BM, et al. Proteomics. Tissue-based map of the human proteome. Science. 2015;347(6220):1260419.
- Cerami E, Gao J, Dogrusoz U, et al. The cBio cancer genomics portal: an open platform for exploring multidimensional cancer genomics data. Cancer Discov. 2012;2(5):401–404.
- Vasaikar SV, Straub P, Wang J, et al. LinkedOmics: analyzing multi-omics data within and across 32 cancer types. Nucleic Acids Res. 2018;46(D1):D956–D63.
- Goldman MJ, Craft B, Hastie M, et al. Visualizing and interpreting cancer genomics data via the Xena platform. Nat Biotechnol. 2020;38(6):675–678.
- Ru B, Wong CN, Tong Y, et al. TISIDB: an integrated repository portal for tumor-immune system interactions. Bioinformatics. 2019;35(20):4200–4202.
- Wiesehofer M, Czyrnik ED, Spahn M, et al. Increased expression of AKT3 in neuroendocrine differentiated prostate cancer cells alters the response towards anti-androgen treatment. Cancers (Basel). 2021;13:3.
- Buikhuisen JY, Gomez Barila PM, Torang A, et al. AKT3 expression in mesenchymal colorectal cancer cells drives growth and is associated with epithelial-mesenchymal transition. Cancers (Basel). 2021;13:4.
- Hinz N, Baranowsky A, Horn M, et al. Knockdown of AKT3 activates HER2 and DDR kinases in bone-seeking breast cancer cells, promotes metastasis in vivo and attenuates the TGFbeta/CTGF axis. Cells. 2021;10:2.
- Bo H, Cao K, Tang R, et al. A network-based approach to identify DNA methylation and its involved molecular pathways in testicular germ cell tumors. J Cancer. 2019;10(4):893–902.
- Li J, Bo H, Zhu F, et al. Hypomethylated SPANXA1/A2 promotes the metastasis of head and neck squamous cell carcinoma. Med Oncol. 2020;37(12):112.
- Fazal Z, Singh R, Fang F, et al. Hypermethylation and global remodelling of DNA methylation is associated with acquired cisplatin resistance in testicular germ cell tumours. Epigenetics. 2021; 16(10): 1071–1084.
- Beyrouthy MJ, Garner KM, Hever MP, et al. High DNA methyltransferase 3B expression mediates 5-aza-deoxycytidine hypersensitivity in testicular germ cell tumors. Cancer Res. 2009;69(24):9360–9366.
- Siska PJ, Johnpulle RAN, Zhou A, et al. Deep exploration of the immune infiltrate and outcome prediction in testicular cancer by quantitative multiplexed immunohistochemistry and gene expression profiling. Oncoimmunology. 2017;6(4):e1305535.
- Luo Y, Sun Y, Li L, et al. METTL3 may regulate testicular germ cell tumors through EMT and immune pathways. Cell Transplant. 2020;29:963689720946653.
- Wang Y, Ji C, Liu J, et al. A model based on tumor-infiltrating immune cells for predicting the relapse rates of patients with testicular germ cell tumors. Int Immunopharmacol. 2020;86:106710.
- Takahashi H, Rokudai S, Kawabata-Iwakawa R, et al. AKT3 is a key regulator of head and neck squamous cell carcinoma. Cancer Sci. 2021;112(6):2325–2334.
- Wu H, Zhang Z, Xiao XY, et al. Toll-like receptor 2 (TLR2) is a candidate prognostic factor in testicular germ cell tumors as well as an indicator of immune function in the tumor microenvironment. Bioengineered. 2021;12(1):1939–1951.
- Ji C, Wang Y, Wang Y, et al. Immune-related genes play an important role in the prognosis of patients with testicular germ cell tumor. Ann Transl Med. 2020;8(14):866.